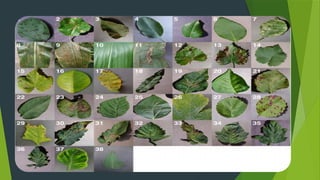
Title: "Plant Disease
Classification using CNN
Created By
1.Manish Panwar(BT22CSA017)
2.Shubhanshu Sahu(BT22CSA018)
3.Utkarsh Singh(BT22CSA039)
Brief overview of the project
 Diseases found in agricultural crops is a major threat that cause production
and economic losses as well as reduction in both quality and quantity of
agricultural products.
 In India 70% of population depend on agriculture and contributes 17%
towards the GDP of country.
 Farmers experience great difficulties in switching from one disease control
policy to another. The naked eye observation of experts is the traditional
approach, this method can be time consuming, expensive and inaccurate
 The crop losses can be minimized by applying pesticides or its equivalent to
combat the effect of specific pathogens, if diseases are correctly diagnosed
and identified early.
Importance of plant disease detection
 The main advantage of automatic plant disease detection is to protect crop
production from quantitative losses.
 Automatic detection of plant disease is essential as it may prove benefits in
monitoring large fields of crops and thus automatically detect the symptoms of
diseases as soon as they appear on plant leaves.
 This system can work as a universal detector, recognizing general abnormalities
on the leaves such as scorching or mold etc.
 It can be implemented to increase crop productivity by ensuring the quality and
quantity of the food product.
OBJECTIVE OF THE PROJECT
 Forecasting of plant leaf disease (Quantification) as soon it appears
on plant leaves.
 Automatic detection of plant leaf disease detection and
classification.
 Increase accuracies Using large dataset to train the Algorithm and
maximize epoch values.
 Make use of existing deep learning models VGG16 and VGG19
for plant leaf disease detection and will check their performance on
the basis of various evaluation.

Artificial Intelligence is a technique which allows the machines to act like humans by
replicating their behavior and nature.

Machine Learning is a subset of artificial intelligence. It allows the machines to learn and
make predictions based on its experience(data).

Deep Learning is a subfield of machine learning concerned with algorithms inspired by the
structure and function of the human brain called artificial neural networks.

The ANN architecture is constituted of 3 layers, input layer, hidden layer, and output layer.
OVERVIEW OF CONVOLUTIONAL NEURAL Network
 CNN's are feedforward neural networks wherein data moves from the input layer to the output layer.
 CNN based classifiers can be directly trained using raw images without the intervention of humans in feature
extraction.
 CNN's architectures consist of input, hidden, and fully-connected (output) layers.
 The hidden layers are convolutional, ReLU (rectified linear unit), and pooling layers which are stacked to
form a single network.
 CNN can be used to solve classification, clustering, regression, pattern recognition, dimension reduction,
structured prediction, machine translation, anomaly detection, decision making, visualization, and computer
vision problems.
Description of the dataset
 The Dataset collected from open source website “Kaggle”.
 The Dataset contains 87k image samples of 14 crops.
 The dataset consists of 38 classes corresponding to 38 leaf diseases of 14 crops.
the 38 disease are listed bellow and their corresponding images.
 1)Apple Scab, 2) Apple black rot, 3)Apple Cedar Rust, 4)Apple healthy,5)Blueberry Healthy,
Cherry Healthy,6)Cherry powdery Mildew,7)Corn Gray Leaf Spot,8)Corn Common
Rust,9)Corn Healthy,10) Corn Northern Leaf,11)Grape Black Rot,12)Grape Black
Measles,13)Grape Healthy, 14)Grape Black Rot,15)Grape Black Measles,16)Grape
Healthy,17)Frape Leaf Blight,18)Orange Haunglongbing, 19)Peach Bacterial Spot,20)Peach
Healthy,21)Bell Paper Bacterial Spot,22)Bell Paper Healthy,23)Potato Early Blight,24)Potato
Healthy,25)Potato Late Blight,26)Raspberry Healthy, 27)Soybean Healthy,28)Squash
Powdery Mildew,29)Strawberry Healthy,30)Strawberry Leaf Scorch, 31)Tomato Bacterial
Spot,32)Tomato Early Blight,33)Tomato Late Blight,34)Tomato Leaf Mold,35)Tomato Two
Spotted Spider,36)Tomato Mosaic Virus,37)Tomato Yellow Leaf Curl Virus,38)Tomato
Healthy of plant leaves.
DATA PREPROCESSING
 Image Data Generators
 What are Image Data Generators?
 Image Data Generators are a feature of TensorFlow and Keras that allow for real-time data
augmentation and batch processing of image data during model training.
 Data Augmentation
 Rescaling:
 Images are rescaled by dividing each pixel value by 255, resulting in pixel values between 0
and 1. This normalizaTrain-Validation Split
 Validation Split:
 The dataset is split into training and validation sets using a validation split ratio of 0.2,
meaning 20% of the data is reserved for validation.
 The training set is used to train the model, while the validation set is used to evaluate the
model's performance on unseen data and prevent overfitting.tion step standardizes the pixel
values and helps improve convergence during model training.
 Train Generator
 Flow from Directory:
 The flow_from_directory method is used to create a data generator for the training set.
 Images are loaded from the specified directory (base_dir) and resized to the target size (img_size,
img_size).
 Batch size is specified to control the number of samples processed in each training iteration.
 Class mode is set to 'categorical', indicating that the labels are one-hot encoded for multiclass
classification.
 Validation Generator
 Flow from Directory:
 Similarly, another data generator is created for the validation set using the flow_from_directory
method.
 Images from the same directory (base_dir) are loaded, resized, and batched for validation.
 The subset parameter is set to 'validation' to specify that this generator will load data from the
validation split.
 Class mode is again set to 'categorical' for consistency with the training generator.
Training Process/Model Architecture:
CNN MODEL TRAINING
 Sequential Model:
 Sequential model is chosen for its simplicity in defining a linear stack of layers.
 Input Layer:
 Conv2D Layer (32 filters, 3x3 kernel size):
 Utilizes 32 filters to extract features from input images.
 Rectified Linear Unit (ReLU) activation function for introducing non-linearity.
 Input shape set to (img_size, img_size, 3) to accommodate image dimensions and
color channels.
 Pooling Layer (MaxPooling2D):
 Reduces spatial dimensions through downsampling.
 2x2 pooling window to retain important features while reducing computational
complexity.
 Convolutional Layers:
 Conv2D Layer (64 filters, 3x3 kernel size):
 Further extraction of features with 64 filters.
 ReLU activation function applied.
 Flattening Layer:
 Converts the multidimensional feature maps into a one-dimensional array for input to fully
connected layers.
 Fully Connected Layers:
 Dense Layer (256 neurons, ReLU activation):
 256 neurons introduced to learn complex patterns in flattened feature maps.
 ReLU activation function for introducing non-linearity.
 Output Layer (Dense Layer, Softmax activation):
 Number of neurons equals the number of classes in the dataset (train_generator.num_classes).
 Softmax activation function used to obtain class probabilities.
Model compilation
 What is Model Compilation?
 Model compilation is the process of configuring the learning process for a
neural network model before it is trained.
 Optimizer
 Adam Optimizer:
 The Adam optimizer is a popular optimization algorithm used for training
deep learning models.
 It combines the advantages of both AdaGrad and RMSProp algorithms by
adapting the learning rate for each parameter individually.
 Adam optimizer is well-suited for training on large-scale datasets and is
known for its fast convergence and robustness.
 Loss Function
 Categorical Crossentropy Loss:
 Categorical crossentropy is a common loss function used for multiclass
classification problems.
 It measures the dissimilarity between the true class labels and the predicted
probability distributions produced by the model.
 The goal during training is to minimize this loss, effectively steering the model
towards making more accurate predictions.
 Metrics
 Accuracy:
 Accuracy is a commonly used evaluation metric for classification tasks.
 It measures the proportion of correctly classified samples out of the total number
of samples.
 While accuracy provides a straightforward measure of model performance, it may
not always be the most informative metric, especially for imbalanced datasets.
Input image output image
ACCURACY
Model deployment process
 Overview
 The model deployment process involves integrating the trained neural network model into a Streamlit web application to
enable users to classify plant disease images interactively.
 Dependencies
 TensorFlow and Keras:
 TensorFlow and Keras libraries are used to load the pre-trained neural network model and perform image classification.
 Streamlit:
 Streamlit library is utilized to create a user-friendly web interface for uploading images and displaying classification results.
 Model Loading
 Pre-Trained Model:
 The pre-trained neural network model is loaded from the specified file path (plant_disease_predicton_model.h5).
 This model was previously trained on a dataset of plant disease images to recognize and classify different types of diseases.
 Class Indices:
 Class indices mapping is loaded from the class_indices.json file, which associates numerical class labels with their
corresponding disease names
 Image Preprocessing
 Load and Preprocess Image:
 Uploaded images are loaded and preprocessed using the load_and_preprocess_image function.
 The image is resized to the target size (224, 224) and scaled to values between 0 and 1.
 Prediction
 Image Classification:
 The preprocessed image is passed through the loaded model to obtain predictions using the predict_image_class function.
 The model predicts the most probable disease class for the uploaded image based on the trained classification model.
 Streamlit App
 User Interface:
 Streamlit is used to create a simple and intuitive user interface.
 Users can upload images using the file uploader widget and click the "Classify" button to trigger the classification process.
 Image Display:
 Uploaded images are displayed in one column, allowing users to visualize the image they want to classify.
 Resized images are shown to maintain consistency and improve display performance.
 Classification Result:
 Upon clicking the "Classify" button, the application performs image classification using the pre-trained model and displays the predicted disease
class in a success message.
WEB app

AI_ML_WORKSHOP_project_on_plant_disease_detection.pptx

  • 1.
    Title: "Plant Disease Classificationusing CNN Created By 1.Manish Panwar(BT22CSA017) 2.Shubhanshu Sahu(BT22CSA018) 3.Utkarsh Singh(BT22CSA039)
  • 2.
    Brief overview ofthe project  Diseases found in agricultural crops is a major threat that cause production and economic losses as well as reduction in both quality and quantity of agricultural products.  In India 70% of population depend on agriculture and contributes 17% towards the GDP of country.  Farmers experience great difficulties in switching from one disease control policy to another. The naked eye observation of experts is the traditional approach, this method can be time consuming, expensive and inaccurate  The crop losses can be minimized by applying pesticides or its equivalent to combat the effect of specific pathogens, if diseases are correctly diagnosed and identified early.
  • 3.
    Importance of plantdisease detection  The main advantage of automatic plant disease detection is to protect crop production from quantitative losses.  Automatic detection of plant disease is essential as it may prove benefits in monitoring large fields of crops and thus automatically detect the symptoms of diseases as soon as they appear on plant leaves.  This system can work as a universal detector, recognizing general abnormalities on the leaves such as scorching or mold etc.  It can be implemented to increase crop productivity by ensuring the quality and quantity of the food product.
  • 4.
    OBJECTIVE OF THEPROJECT  Forecasting of plant leaf disease (Quantification) as soon it appears on plant leaves.  Automatic detection of plant leaf disease detection and classification.  Increase accuracies Using large dataset to train the Algorithm and maximize epoch values.  Make use of existing deep learning models VGG16 and VGG19 for plant leaf disease detection and will check their performance on the basis of various evaluation.
  • 5.
     Artificial Intelligence isa technique which allows the machines to act like humans by replicating their behavior and nature.  Machine Learning is a subset of artificial intelligence. It allows the machines to learn and make predictions based on its experience(data).  Deep Learning is a subfield of machine learning concerned with algorithms inspired by the structure and function of the human brain called artificial neural networks.  The ANN architecture is constituted of 3 layers, input layer, hidden layer, and output layer.
  • 6.
    OVERVIEW OF CONVOLUTIONALNEURAL Network  CNN's are feedforward neural networks wherein data moves from the input layer to the output layer.  CNN based classifiers can be directly trained using raw images without the intervention of humans in feature extraction.  CNN's architectures consist of input, hidden, and fully-connected (output) layers.  The hidden layers are convolutional, ReLU (rectified linear unit), and pooling layers which are stacked to form a single network.  CNN can be used to solve classification, clustering, regression, pattern recognition, dimension reduction, structured prediction, machine translation, anomaly detection, decision making, visualization, and computer vision problems.
  • 7.
    Description of thedataset  The Dataset collected from open source website “Kaggle”.  The Dataset contains 87k image samples of 14 crops.  The dataset consists of 38 classes corresponding to 38 leaf diseases of 14 crops. the 38 disease are listed bellow and their corresponding images.  1)Apple Scab, 2) Apple black rot, 3)Apple Cedar Rust, 4)Apple healthy,5)Blueberry Healthy, Cherry Healthy,6)Cherry powdery Mildew,7)Corn Gray Leaf Spot,8)Corn Common Rust,9)Corn Healthy,10) Corn Northern Leaf,11)Grape Black Rot,12)Grape Black Measles,13)Grape Healthy, 14)Grape Black Rot,15)Grape Black Measles,16)Grape Healthy,17)Frape Leaf Blight,18)Orange Haunglongbing, 19)Peach Bacterial Spot,20)Peach Healthy,21)Bell Paper Bacterial Spot,22)Bell Paper Healthy,23)Potato Early Blight,24)Potato Healthy,25)Potato Late Blight,26)Raspberry Healthy, 27)Soybean Healthy,28)Squash Powdery Mildew,29)Strawberry Healthy,30)Strawberry Leaf Scorch, 31)Tomato Bacterial Spot,32)Tomato Early Blight,33)Tomato Late Blight,34)Tomato Leaf Mold,35)Tomato Two Spotted Spider,36)Tomato Mosaic Virus,37)Tomato Yellow Leaf Curl Virus,38)Tomato Healthy of plant leaves.
  • 9.
    DATA PREPROCESSING  ImageData Generators  What are Image Data Generators?  Image Data Generators are a feature of TensorFlow and Keras that allow for real-time data augmentation and batch processing of image data during model training.  Data Augmentation  Rescaling:  Images are rescaled by dividing each pixel value by 255, resulting in pixel values between 0 and 1. This normalizaTrain-Validation Split  Validation Split:  The dataset is split into training and validation sets using a validation split ratio of 0.2, meaning 20% of the data is reserved for validation.  The training set is used to train the model, while the validation set is used to evaluate the model's performance on unseen data and prevent overfitting.tion step standardizes the pixel values and helps improve convergence during model training.
  • 10.
     Train Generator Flow from Directory:  The flow_from_directory method is used to create a data generator for the training set.  Images are loaded from the specified directory (base_dir) and resized to the target size (img_size, img_size).  Batch size is specified to control the number of samples processed in each training iteration.  Class mode is set to 'categorical', indicating that the labels are one-hot encoded for multiclass classification.  Validation Generator  Flow from Directory:  Similarly, another data generator is created for the validation set using the flow_from_directory method.  Images from the same directory (base_dir) are loaded, resized, and batched for validation.  The subset parameter is set to 'validation' to specify that this generator will load data from the validation split.  Class mode is again set to 'categorical' for consistency with the training generator.
  • 11.
  • 12.
    CNN MODEL TRAINING Sequential Model:  Sequential model is chosen for its simplicity in defining a linear stack of layers.  Input Layer:  Conv2D Layer (32 filters, 3x3 kernel size):  Utilizes 32 filters to extract features from input images.  Rectified Linear Unit (ReLU) activation function for introducing non-linearity.  Input shape set to (img_size, img_size, 3) to accommodate image dimensions and color channels.  Pooling Layer (MaxPooling2D):  Reduces spatial dimensions through downsampling.  2x2 pooling window to retain important features while reducing computational complexity.
  • 13.
     Convolutional Layers: Conv2D Layer (64 filters, 3x3 kernel size):  Further extraction of features with 64 filters.  ReLU activation function applied.  Flattening Layer:  Converts the multidimensional feature maps into a one-dimensional array for input to fully connected layers.  Fully Connected Layers:  Dense Layer (256 neurons, ReLU activation):  256 neurons introduced to learn complex patterns in flattened feature maps.  ReLU activation function for introducing non-linearity.  Output Layer (Dense Layer, Softmax activation):  Number of neurons equals the number of classes in the dataset (train_generator.num_classes).  Softmax activation function used to obtain class probabilities.
  • 14.
    Model compilation  Whatis Model Compilation?  Model compilation is the process of configuring the learning process for a neural network model before it is trained.  Optimizer  Adam Optimizer:  The Adam optimizer is a popular optimization algorithm used for training deep learning models.  It combines the advantages of both AdaGrad and RMSProp algorithms by adapting the learning rate for each parameter individually.  Adam optimizer is well-suited for training on large-scale datasets and is known for its fast convergence and robustness.
  • 15.
     Loss Function Categorical Crossentropy Loss:  Categorical crossentropy is a common loss function used for multiclass classification problems.  It measures the dissimilarity between the true class labels and the predicted probability distributions produced by the model.  The goal during training is to minimize this loss, effectively steering the model towards making more accurate predictions.  Metrics  Accuracy:  Accuracy is a commonly used evaluation metric for classification tasks.  It measures the proportion of correctly classified samples out of the total number of samples.  While accuracy provides a straightforward measure of model performance, it may not always be the most informative metric, especially for imbalanced datasets.
  • 16.
  • 17.
  • 18.
    Model deployment process Overview  The model deployment process involves integrating the trained neural network model into a Streamlit web application to enable users to classify plant disease images interactively.  Dependencies  TensorFlow and Keras:  TensorFlow and Keras libraries are used to load the pre-trained neural network model and perform image classification.  Streamlit:  Streamlit library is utilized to create a user-friendly web interface for uploading images and displaying classification results.  Model Loading  Pre-Trained Model:  The pre-trained neural network model is loaded from the specified file path (plant_disease_predicton_model.h5).  This model was previously trained on a dataset of plant disease images to recognize and classify different types of diseases.  Class Indices:  Class indices mapping is loaded from the class_indices.json file, which associates numerical class labels with their corresponding disease names
  • 19.
     Image Preprocessing Load and Preprocess Image:  Uploaded images are loaded and preprocessed using the load_and_preprocess_image function.  The image is resized to the target size (224, 224) and scaled to values between 0 and 1.  Prediction  Image Classification:  The preprocessed image is passed through the loaded model to obtain predictions using the predict_image_class function.  The model predicts the most probable disease class for the uploaded image based on the trained classification model.  Streamlit App  User Interface:  Streamlit is used to create a simple and intuitive user interface.  Users can upload images using the file uploader widget and click the "Classify" button to trigger the classification process.  Image Display:  Uploaded images are displayed in one column, allowing users to visualize the image they want to classify.  Resized images are shown to maintain consistency and improve display performance.  Classification Result:  Upon clicking the "Classify" button, the application performs image classification using the pre-trained model and displays the predicted disease class in a success message.
  • 20.