Downloaded 158 times


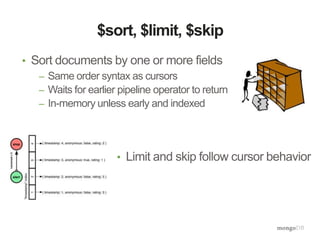
![Document Model
{ "_id" : ObjectId("54e23c7b28099359f5661525"),
"name" : "California",
"region" : "West",
"data" : [
{"totalPop" : 33871648,
"totalHouse" : 12214549,
"occHouse" : 11502870,
"year" : 2000},
{"totalPop" : 37253956,
"totalHouse" : 13680081,
"occHouse" : 12577498,
"year" : 2010},
{"totalPop" : 29760021,
"totalHouse" : 11182882,
"occHouse" : 29008161,
"year" : 1990}
],
…
}](https://image.slidesharecdn.com/aggframework-selectgroupfeb2015v2-150218124530-conversion-gate01/85/Agg-framework-selectgroup-feb2015-v2-14-320.jpg)
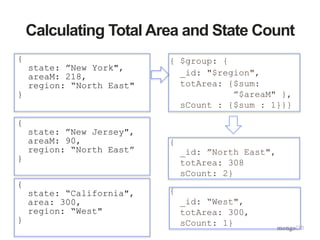
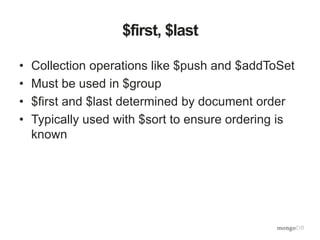
![Total US Area
db.cData.aggregate([
{"$group" : {"_id" : null,
"totalArea" : {$sum : "$areaM"},
"avgArea" : {$avg : "$areaM"}}}])](https://image.slidesharecdn.com/aggframework-selectgroupfeb2015v2-150218124530-conversion-gate01/85/Agg-framework-selectgroup-feb2015-v2-16-320.jpg)

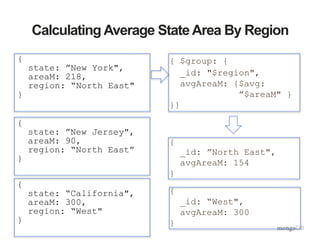
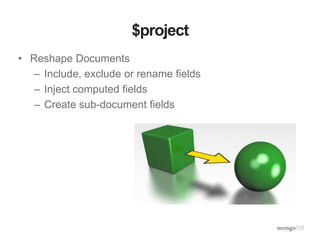
![Area By Region
db.cData.aggregate([
{"$group" : {"_id" : "$region",
"totalArea" : {$sum : "$areaM"},
"avgArea" : {$avg : "$areaM"},
"numStates" : {$sum : 1},
"states" : {$push : "$name"}}}
])](https://image.slidesharecdn.com/aggframework-selectgroupfeb2015v2-150218124530-conversion-gate01/85/Agg-framework-selectgroup-feb2015-v2-18-320.jpg)
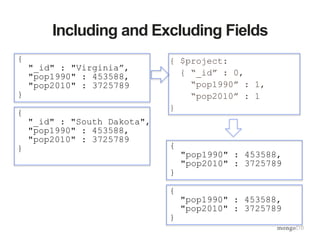
![Total US Population By Year
db.cData.aggregate(
[{$unwind : "$data"},
{$group : {"_id" : "$data.year",
"totalPop" : {$sum : "$data.totalPop"}}},
{$sort : {"totalPop" : 1}}
])](https://image.slidesharecdn.com/aggframework-selectgroupfeb2015v2-150218124530-conversion-gate01/85/Agg-framework-selectgroup-feb2015-v2-21-320.jpg)

![$unwind
{ $unwind: $census }
{ state: “New York,
census: 1990}
{
state: ”New York",
census: [1990, 2000,
2010]
}
{
state: ”New Jersey",
census: [1990, 2000]
}
{
state: “California",
census: [1980, 1990,
2000, 2010]
}
{
state: ”Delaware",
census: [1990, 2000]
}
{ state: “New York,
census: 2000}
{ state: “New York,
census: 2010}
{ state: “New Jersey,
census: 1990}
{ state: “New Jersey,
census: 2000}
…](https://image.slidesharecdn.com/aggframework-selectgroupfeb2015v2-150218124530-conversion-gate01/85/Agg-framework-selectgroup-feb2015-v2-23-320.jpg)
![Southern State Population By Year
db.cData.aggregate(
[{$match : {"region" : "South"}},
{$unwind : "$data"},
{$group : {"_id" : "$data.year",
"totalPop” : {"$sum” :
"$data.totalPop"}}}])](https://image.slidesharecdn.com/aggframework-selectgroupfeb2015v2-150218124530-conversion-gate01/85/Agg-framework-selectgroup-feb2015-v2-24-320.jpg)
![Population Delta By State from 1990 to 2010
db.cData.aggregate(
[{$unwind : "$data"},
{$sort : {"data.year" : 1}},
{$group : {"_id" : "$name",
"pop1990" : {"$first" : "$data.totalPop"},
"pop2010" : {"$last" : "$data.totalPop"}}},
{$project : {"_id" : 0,
"name" : "$_id",
"delta" : {"$subtract" :
["$pop2010", "$pop1990"]},
"pop1990" : 1,
"pop2010” : 1}
}]
)](https://image.slidesharecdn.com/aggframework-selectgroupfeb2015v2-150218124530-conversion-gate01/85/Agg-framework-selectgroup-feb2015-v2-27-320.jpg)
![Population Delta By State from 1990 to 2010
db.cData.aggregate(
[{$unwind : "$data"},
{$sort : {"data.year" : 1}},
{$group : {"_id" : "$name",
"pop1990" : {"$first" : "$data.totalPop"},
"pop2010" : {"$last" : "$data.totalPop"}}},
{$project : {"_id" : 0,
"name" : "$_id",
"delta" : {"$subtract" :
["$pop2010", "$pop1990"]},
"pop1990" : 1,
"pop2010” : 1}
}]
)](https://image.slidesharecdn.com/aggframework-selectgroupfeb2015v2-150218124530-conversion-gate01/85/Agg-framework-selectgroup-feb2015-v2-28-320.jpg)
![Population Delta By State from 1990 to 2010
db.cData.aggregate(
[{$unwind : "$data"},
{$sort : {"data.year" : 1}},
{$group : {"_id" : "$name",
"pop1990" : {"$first" : "$data.totalPop"},
"pop2010" : {"$last" : "$data.totalPop"}}},
{$project : {"_id" : 0,
"name" : "$_id",
"delta" : {"$subtract" :
["$pop2010", "$pop1990"]},
"pop1990" : 1,
"pop2010” : 1}
}]
)](https://image.slidesharecdn.com/aggframework-selectgroupfeb2015v2-150218124530-conversion-gate01/85/Agg-framework-selectgroup-feb2015-v2-30-320.jpg)
![Population Delta By State from 1990 to 2010
db.cData.aggregate(
[{$unwind : "$data"},
{$sort : {"data.year" : 1}},
{$group : {"_id" : "$name",
"pop1990" : {"$first" : "$data.totalPop"},
"pop2010" : {"$last" : "$data.totalPop"}}},
{$project : {"_id" : 0,
"name" : "$_id",
"delta" : {"$subtract" :
["$pop2010", "$pop1990"]},
"pop1990" : 1,
"pop2010” : 1}
}]
)](https://image.slidesharecdn.com/aggframework-selectgroupfeb2015v2-150218124530-conversion-gate01/85/Agg-framework-selectgroup-feb2015-v2-32-320.jpg)
![{
”name" : “South Dakota”,
”delta" : 118176
}
Renaming and Computing Fields
{ $project:
{ “_id” : 0,
“pop1990” : 0,
“pop2010” : 0,
“name” : “$_id”,
"delta" :
{"$subtract" :
["$pop2010",
"$pop1990"]}}
}
{
"_id" : "Virginia”,
"pop1990" : 6187358,
"pop2010" : 8001024
}
{
"_id" : "South Dakota",
"pop1990" : 696004,
"pop2010" : 814180
}
{
”name" : “Virginia”,
”delta" : 1813666
}](https://image.slidesharecdn.com/aggframework-selectgroupfeb2015v2-150218124530-conversion-gate01/85/Agg-framework-selectgroup-feb2015-v2-35-320.jpg)
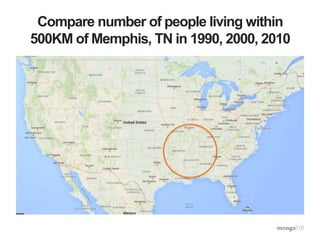
![Compare number of people living within
500KM of Memphis, TN in 1990, 2000, 2010
db.cData.aggregate([
{$geoNear : {
"near" : {"type" : "Point", "coordinates" : [90, 35]},
“distanceField” : "dist.calculated",
“maxDistance” : 500000,
“includeLocs” : "dist.location",
“spherical” : true }},
{$unwind : "$data"},
{$group : {"_id" : "$data.year",
"totalPop" : {"$sum" : "$data.totalPop"},
"states" : {"$addToSet" : "$name"}}},
{$sort : {"_id" : 1}}
])](https://image.slidesharecdn.com/aggframework-selectgroupfeb2015v2-150218124530-conversion-gate01/85/Agg-framework-selectgroup-feb2015-v2-37-320.jpg)
![{
"_id" : ”Tennessee",
"pop1990" : 4877185,
"pop2010" : 6346105,
“center” :
{“type” : “Point”,
“coordinates” :
[86.6, 37.8]}
}
{
"_id" : "Virginia”,
"pop1990" : 6187358,
"pop2010" : 8001024,
“center” :
{“type” : “Point”,
“coordinates” :
[78.6, 37.5]}
}
$geoNear
{$geoNear : {
"near”: {"type”: "Point",
"coordinates”:
[90, 35]},
maxDistance : 500000,
spherical : true }}
{
"_id" : ”Tennessee",
"pop1990" : 4877185,
"pop2010" : 6346105,
“center” :
{“type” : “Point”,
“coordinates” :
[86.6, 37.8]}
}](https://image.slidesharecdn.com/aggframework-selectgroupfeb2015v2-150218124530-conversion-gate01/85/Agg-framework-selectgroup-feb2015-v2-39-320.jpg)
![What if I want to save the results to a
collection?
db.cData.aggregate([
{$geoNear : {
"near" : {"type" : "Point", "coordinates" : [90, 35]},
“distanceField” : "dist.calculated",
“maxDistance” : 500000,
“includeLocs” : "dist.location",
“spherical” : true }},
{$unwind : "$data"},
{$group : {"_id" : "$data.year",
"totalPop" : {"$sum" : "$data.totalPop"},
"states" : {"$addToSet" : "$name"}}},
{$sort : {"_id" : 1}},
{$out : “peopleNearMemphis”}
])](https://image.slidesharecdn.com/aggframework-selectgroupfeb2015v2-150218124530-conversion-gate01/85/Agg-framework-selectgroup-feb2015-v2-40-320.jpg)
![$out
db.cData.aggregate([<pipeline stages>,
{“$out” : “resultsCollection”}])
• Save aggregation results to a new collection
• New aggregation uses:
• Transform documents - ETL](https://image.slidesharecdn.com/aggframework-selectgroupfeb2015v2-150218124530-conversion-gate01/85/Agg-framework-selectgroup-feb2015-v2-41-320.jpg)
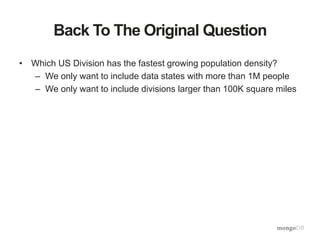
![Division with Fastest Growing Pop Density
db.cData.aggregate(
[{$match : {"data.totalPop" : {"$gt" : 1000000}}},
{$unwind : "$data"},
{$sort : {"data.year" : 1}},
{$group : {"_id" : "$name",
"pop1990" : {"$first" : "$data.totalPop"},
"pop2010" : {"$last" : "$data.totalPop"},
"areaM" : {"$first" : "$areaM"},
"division" : {"$first" : "$division"}}},
{$group : {"_id" : "$division",
"totalPop1990" : {"$sum" : "$pop1990"},
"totalPop2010" : {"$sum" : "$pop2010"},
"totalAreaM" : {"$sum" : "$areaM"}}},
{$match : {"totalAreaM" : {"$gt" : 100000}}},
{$project : {"_id" : 0,
"division" : "$_id",
"density1990" : {"$divide" : ["$totalPop1990", "$totalAreaM"]},
"density2010" : {"$divide" : ["$totalPop2010", "$totalAreaM"]},
"denDelta" : {"$subtract" : [{"$divide" : ["$totalPop2010",
"$totalAreaM"]},
{"$divide" : ["$totalPop1990”,
"$totalAreaM"]}]},
"totalAreaM" : 1,
"totalPop1990" : 1,
"totalPop2010" : 1}},
{$sort : {"denDelta" : -1}}])](https://image.slidesharecdn.com/aggframework-selectgroupfeb2015v2-150218124530-conversion-gate01/85/Agg-framework-selectgroup-feb2015-v2-43-320.jpg)

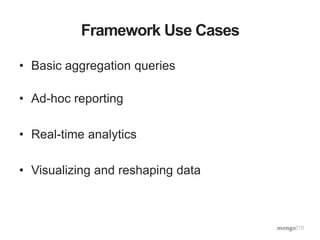
![Aggregate options
db.cData.aggregate([<pipeline stages>],
{‘explain’ : false
'allowDiskUse' : true,
'cursor' : {'batchSize' : 5}})
explain – similar to find().explain()
allowDiskUse – enable use of disk to store intermediate
results
cursor – specify the size of the initial result](https://image.slidesharecdn.com/aggframework-selectgroupfeb2015v2-150218124530-conversion-gate01/85/Agg-framework-selectgroup-feb2015-v2-45-320.jpg)


The document provides an overview of the aggregation framework in MongoDB, detailing its capabilities for data analytics such as grouping, filtering, and transforming documents through various pipeline operators. It showcases practical applications using U.S. census data, presenting examples of how to calculate population density and analyze population changes over time. Specific MongoDB commands and functionalities are highlighted, including the use of $match, $group, $unwind, and $project to manipulate and visualize data effectively.


![MongoDB .local San Francisco 2020: Powering the new age data demands [Infosys]](https://cdn.slidesharecdn.com/ss_thumbnails/315pminfosysfinalsfoversionvocalpart1-200120221508-thumbnail.jpg?width=640&height=640&fit=bounds)