Download to read offline
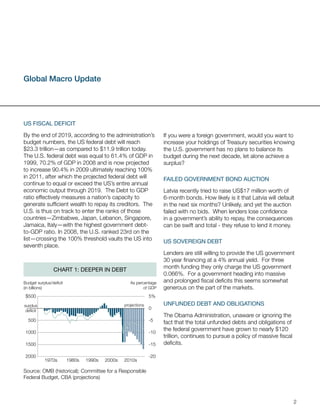
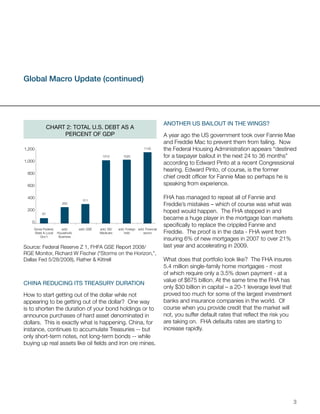


The document summarizes recent trends in the US bond and stock markets, and discusses their implications. It notes the large and growing US budget deficits and debt levels, which are projected to exceed 100% of GDP. It also discusses concerns around failed government bond auctions, China reducing its Treasury holdings, and potential problems in the US housing market that could lead to another taxpayer bailout.


