

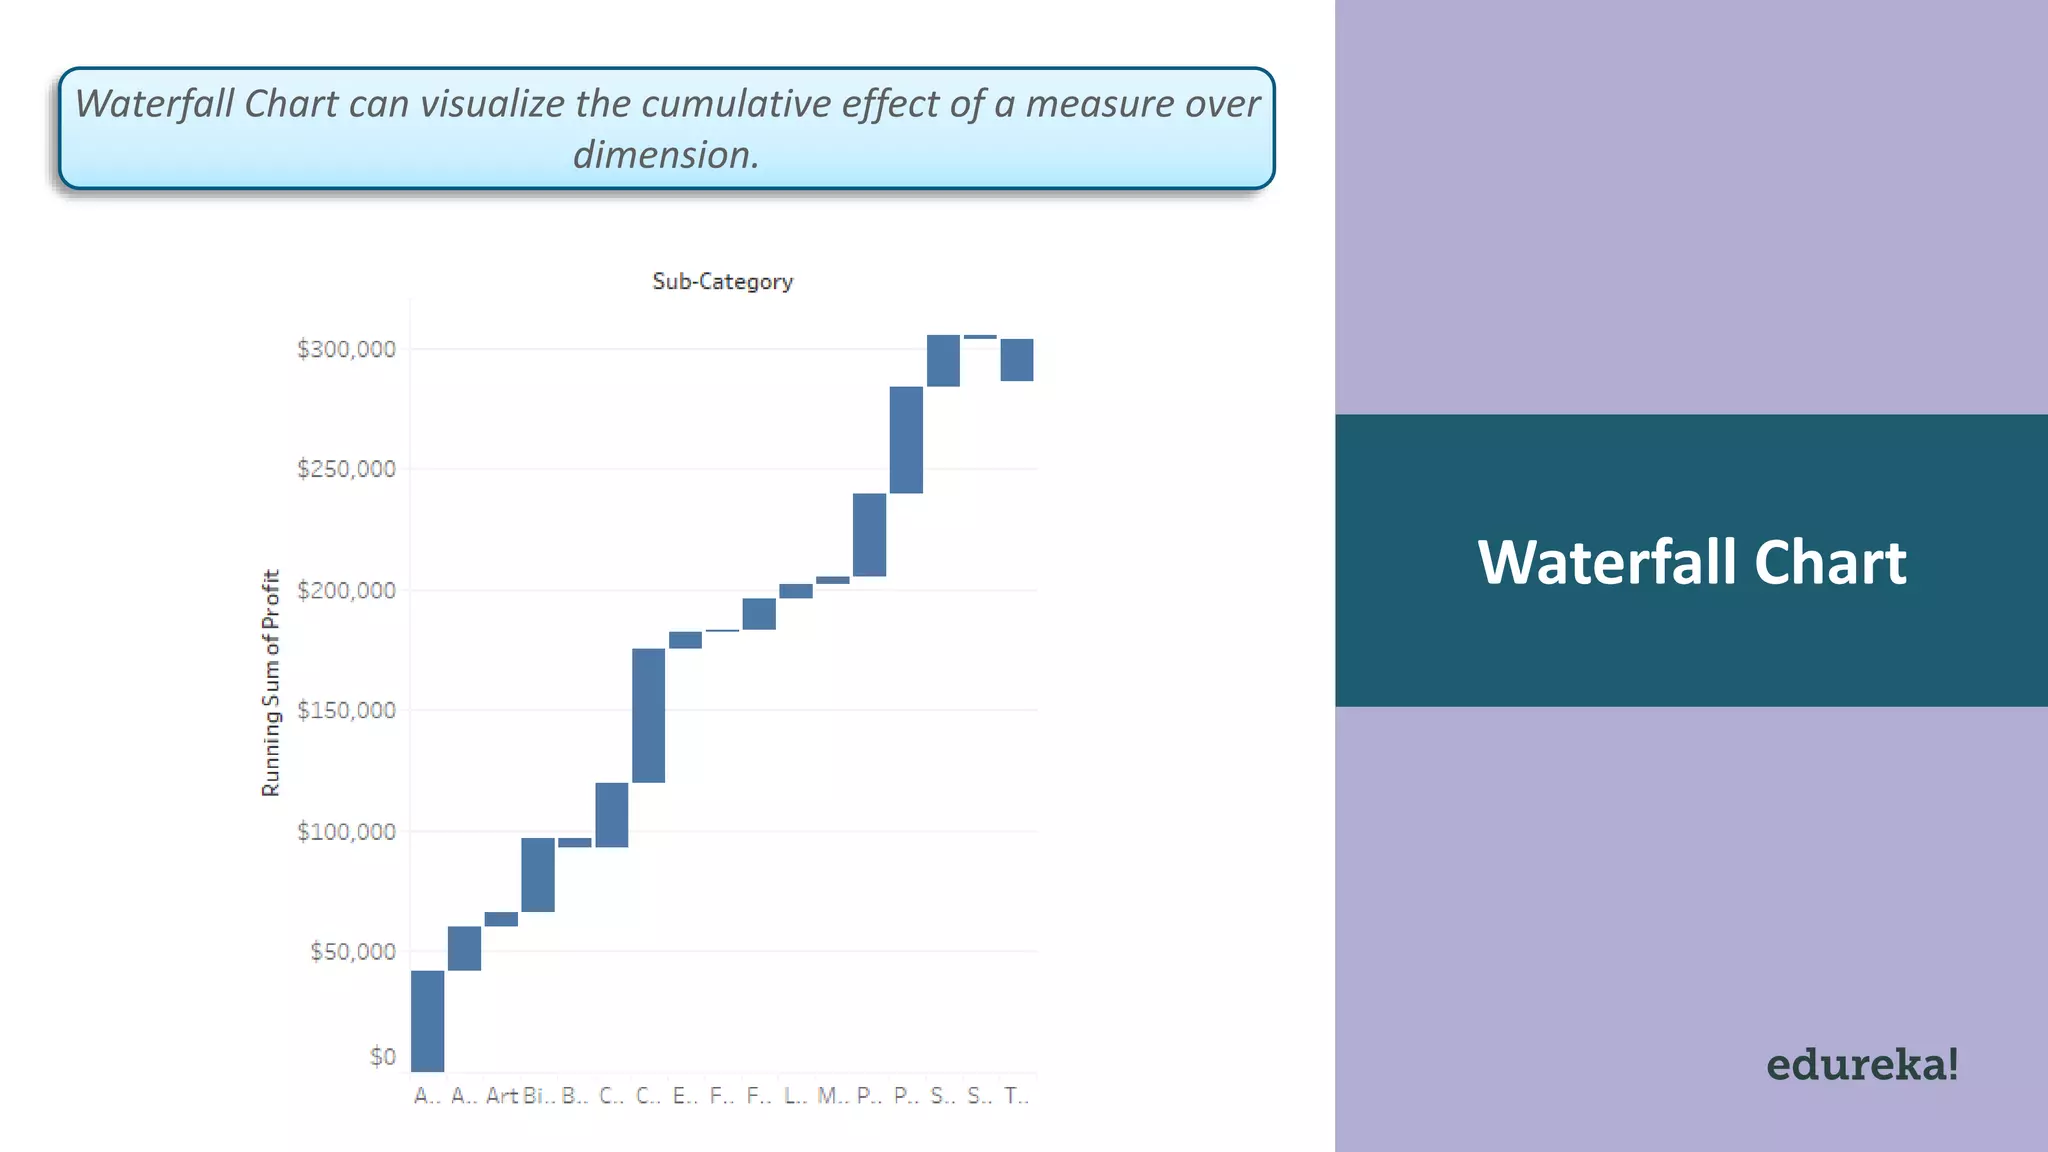
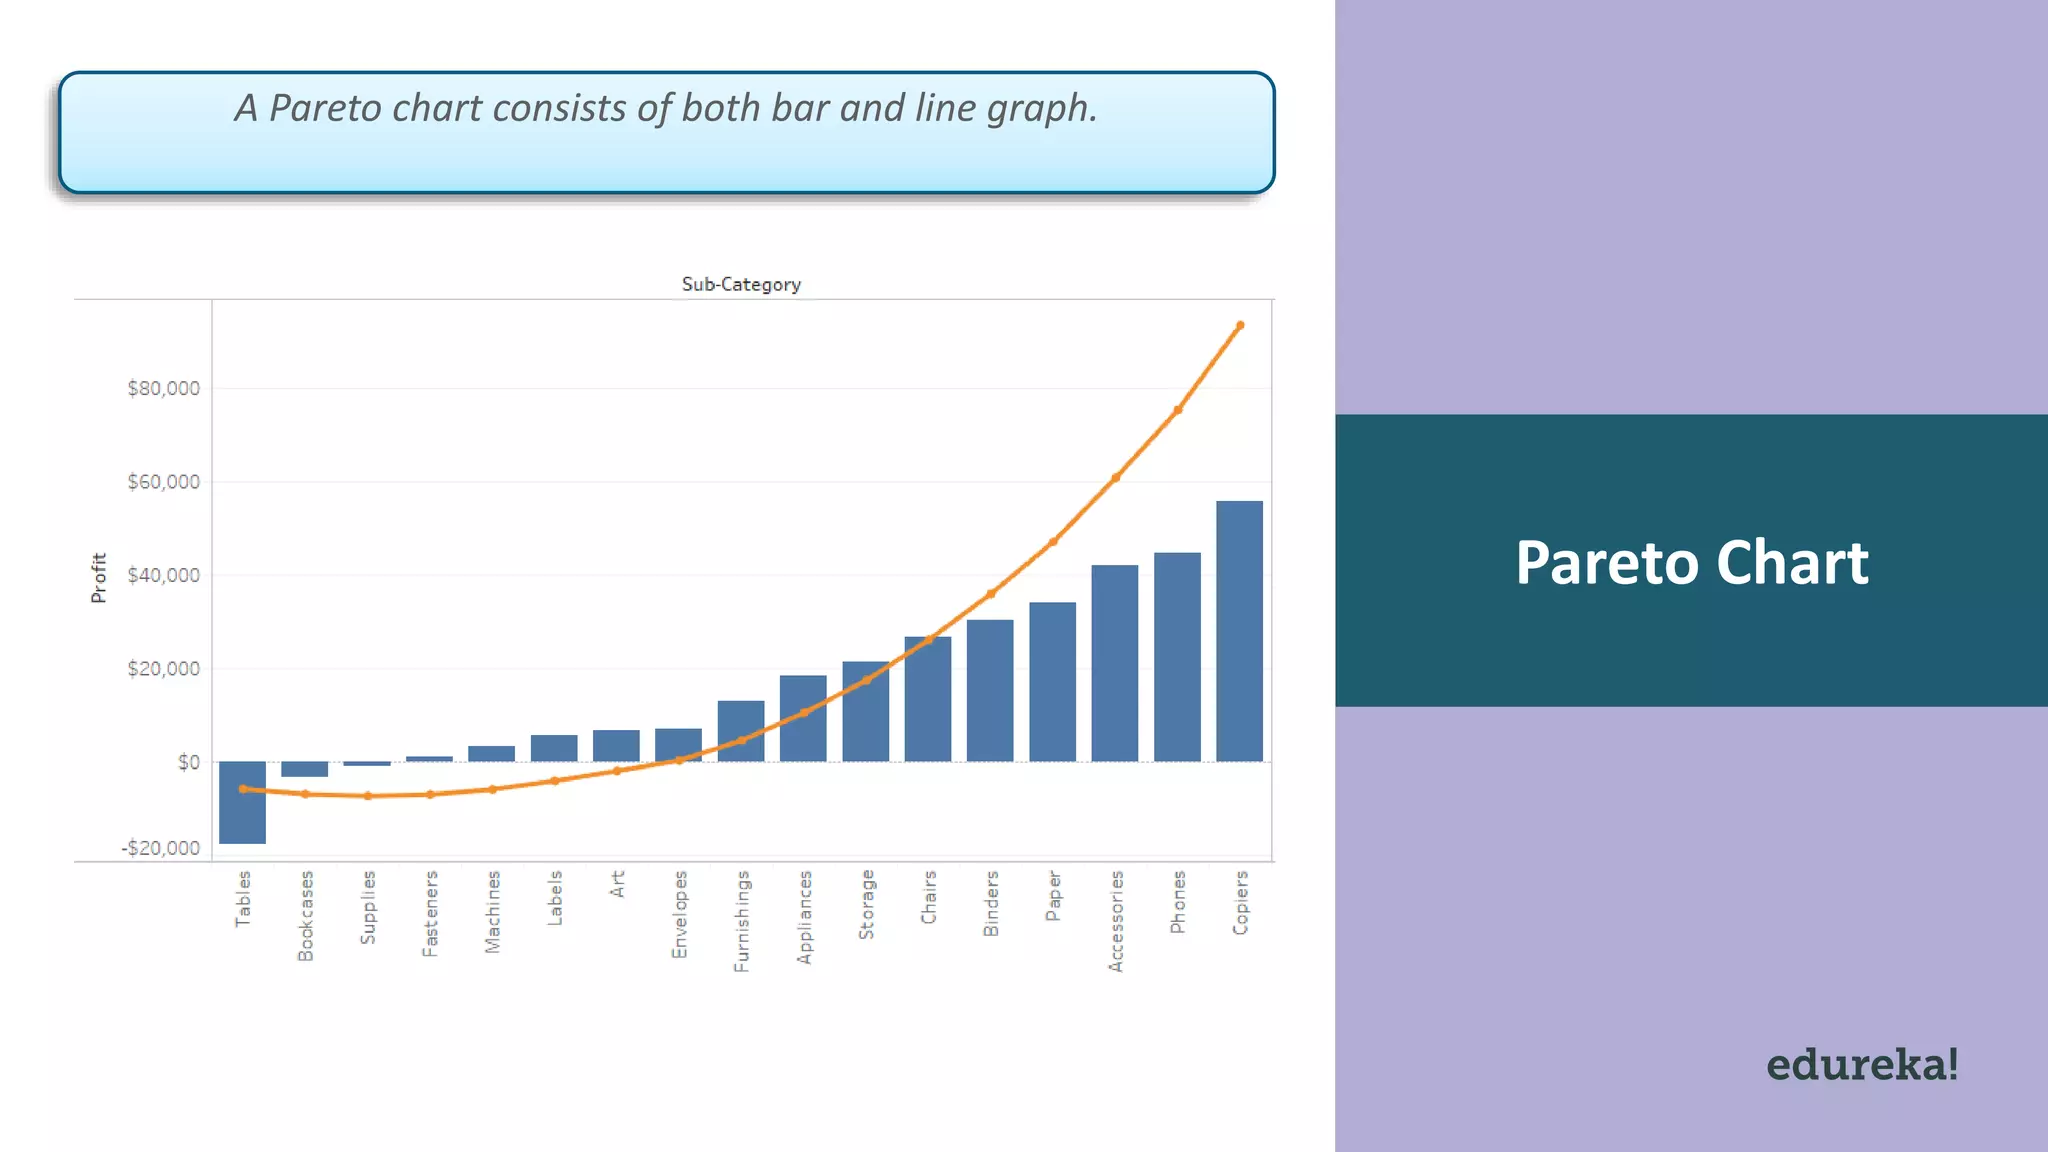
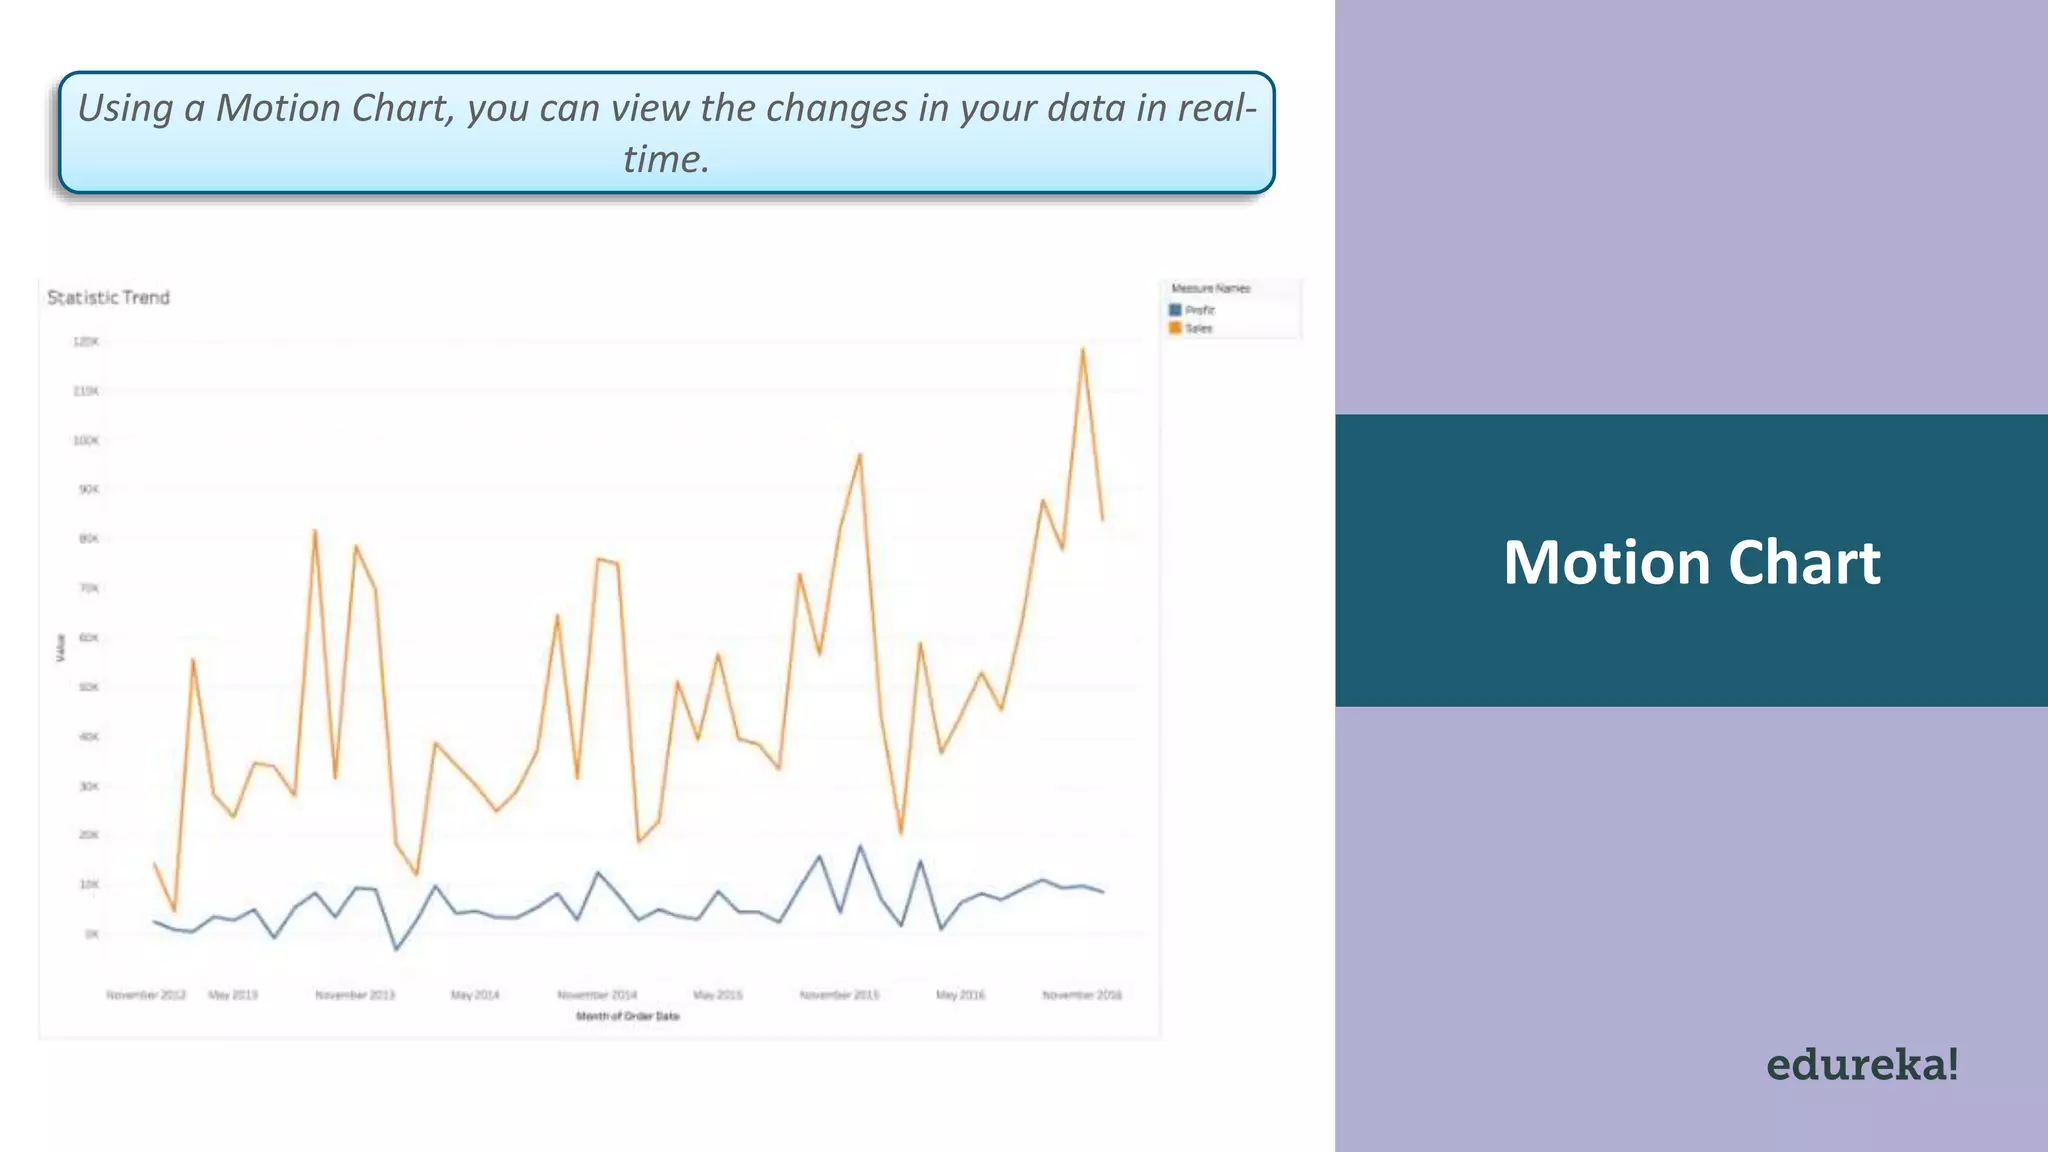
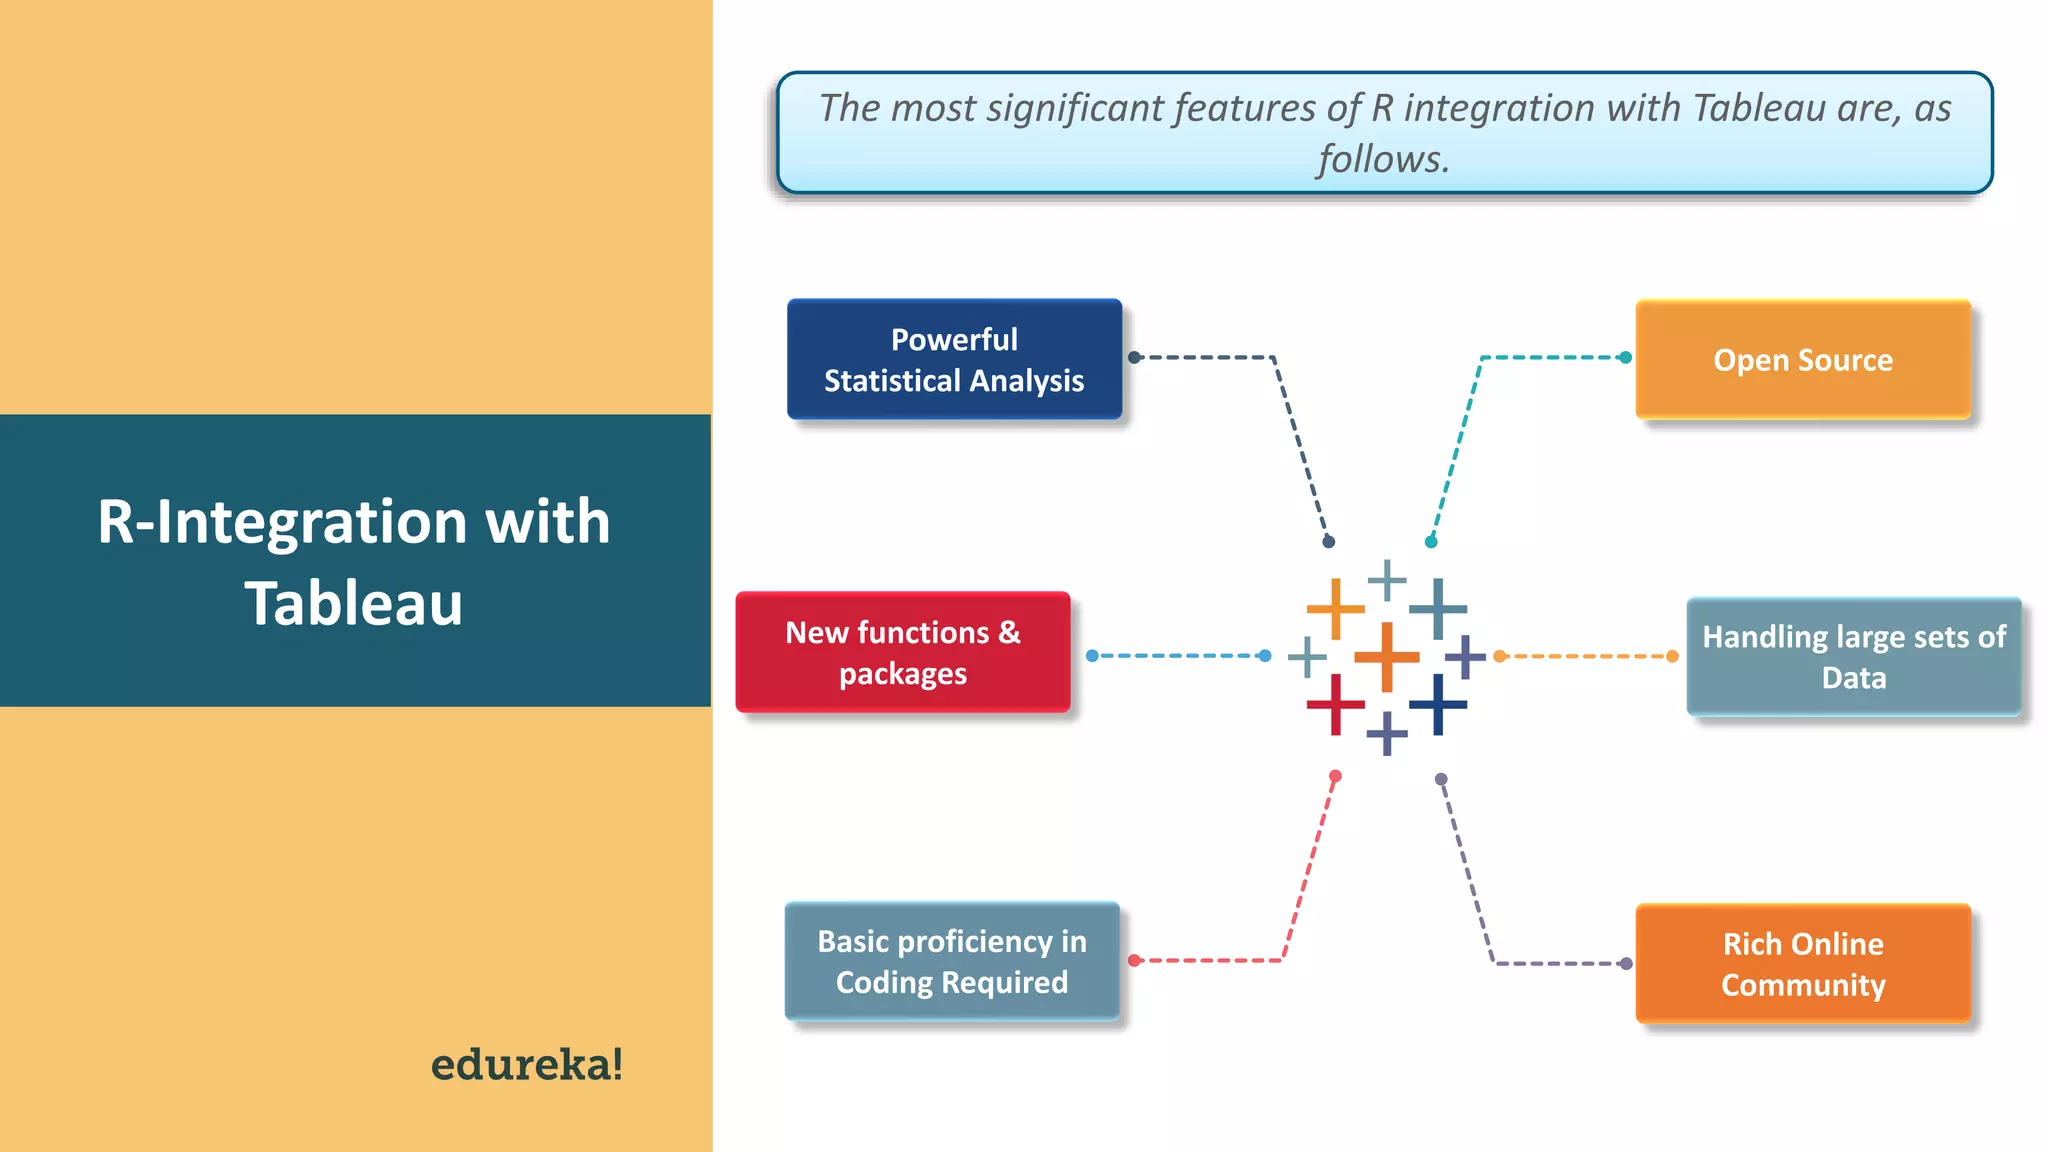

The document outlines the key features of forecasting and advanced charting in Tableau, including trend lines, waterfall charts, pareto charts, and motion charts. It highlights the integration of R with Tableau for powerful statistical analysis, requiring basic coding skills and offering rich community support. The conclusion emphasizes the significance of these advanced visualization techniques.