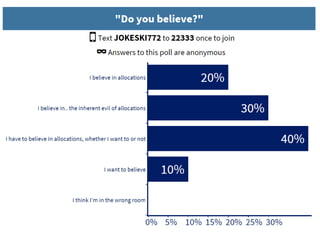
Download to read offline


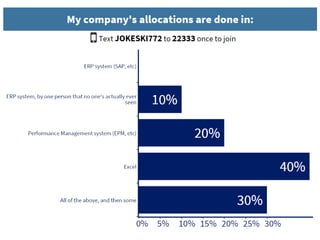


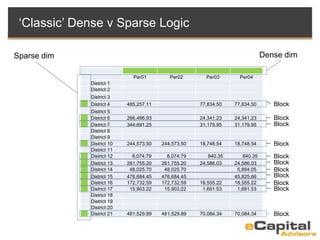
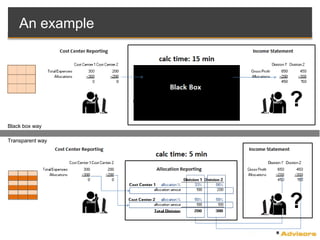

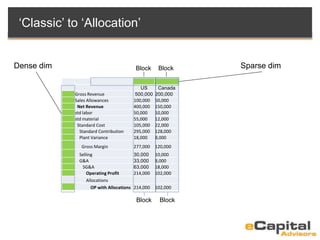


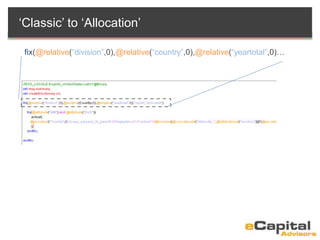
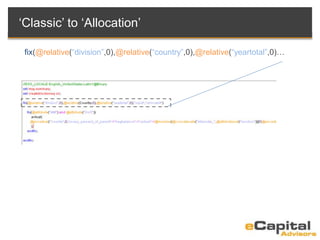
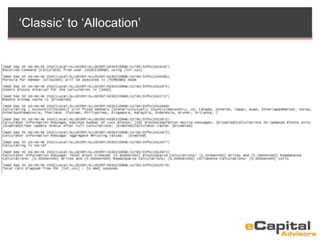
![Total Block Created: [6.0032e+006] Blocks (6 Million)
Sparse Calculations: [6.0060e+006] Writes and [2.3598e+007] Reads (30
Million)
Dense Calculations: [0.0000e+000] Writes and [0.0000e+000] Reads
Sparse Calculations: [0.0000e+000] Cells Dense Calculations: [0.0000e+000]
Cells
[2015-09-30T16:43:43.343-21:43] [ALLOC3] [CAL-579] [NOTIFICATION]
[16][] [ecid:1443630732729,0] [tid:19144] Total Calc Elapsed Time for
[alloc.csc] : [234.239] seconds
‘Classic’ to ‘Allocation’](https://image.slidesharecdn.com/ecapital-advisorshugmn2016advancedallocations-160321124119/85/Advanced-Allocations-70-320.jpg)

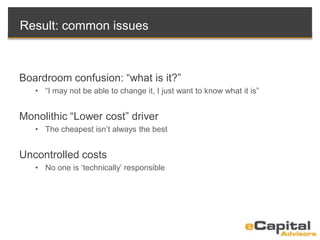
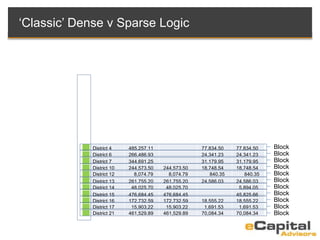
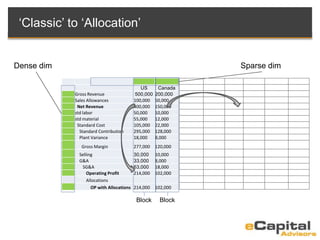
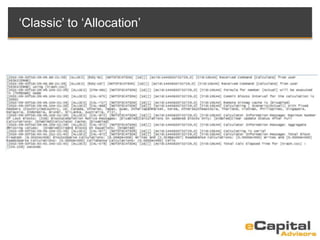
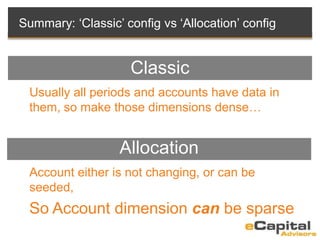
![Total Block Created: [3.6000e+001] Blocks (36)
Sparse Calculations: [1.1500e+002] Writes and [5.3900e+002] Reads (654)
Dense Calculations: [0.0000e+000] Writes and [0.0000e+000] Reads
Sparse Calculations: [0.0000e+000] Cells Dense Calculations: [0.0000e+000]
Cells
[Wed Sep 30 16:48:46 2015]Local/KESKI@AD/11760/Info(1012579)
Total Calc Elapsed Time for [alloc.csc] : [0.468] seconds
‘Classic’ to ‘Allocation’](https://image.slidesharecdn.com/ecapital-advisorshugmn2016advancedallocations-160321124119/85/Advanced-Allocations-75-320.jpg)
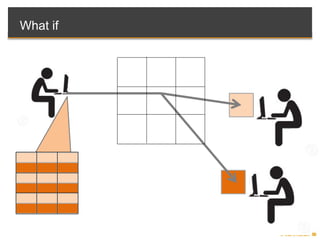
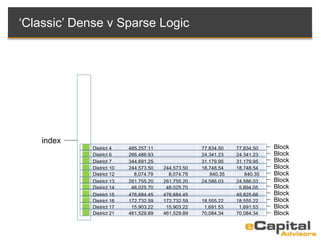
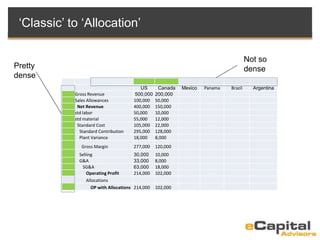
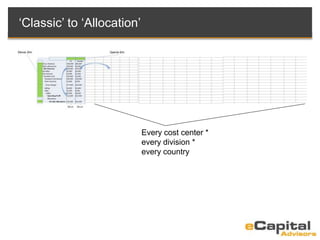
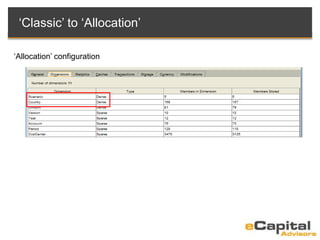
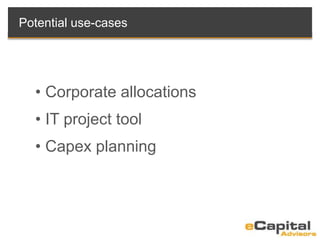
![Summary
Total Block Created: [3.6000e+001] Blocks (36)
Sparse Calculations: [1.1500e+002] Writes and [5.3900e+002] Reads (654)
Dense Calculations: [0.0000e+000] Writes and [0.0000e+000] Reads
Sparse Calculations: [0.0000e+000] Cells Dense Calculations: [0.0000e+000]
Cells
[Wed Sep 30 16:48:46 2015]Local/KESKI@AD/11760/Info(1012579)
Total Calc Elapsed Time for [alloc.csc] : [0.468] seconds
Total Block Created: [6.0032e+006] Blocks (6 Million)
Sparse Calculations: [6.0060e+006] Writes and [2.3598e+007] Reads (30
Million)
Dense Calculations: [0.0000e+000] Writes and [0.0000e+000] Reads
Sparse Calculations: [0.0000e+000] Cells Dense Calculations: [0.0000e+000]
Cells
[2015-09-30T16:43:43.343-21:43] [ALLOC3] [CAL-579] [NOTIFICATION]
[16][] [ecid:1443630732729,0] [tid:19144] Total Calc Elapsed Time for
[alloc.csc] : [234.239] seconds
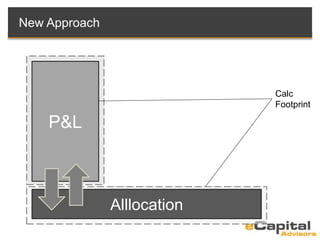
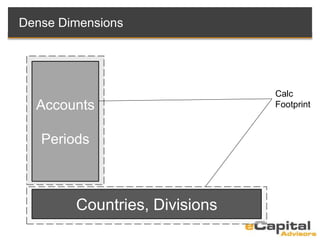
P&L
config
Allocation
config
-VS-](https://image.slidesharecdn.com/ecapital-advisorshugmn2016advancedallocations-160321124119/85/Advanced-Allocations-76-320.jpg)


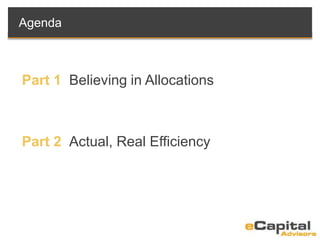
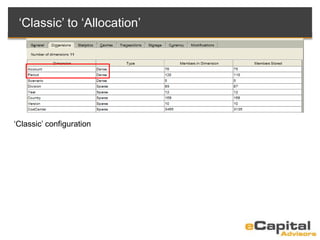
This document provides information about eCapital Advisors, a performance management and business analytics consulting firm. It discusses eCapital's founding, headquarters location, number of customers, employees, and service offerings such as strategic assessments, implementations, upgrades, training, and managed services across various industries. The document then outlines an agenda for discussing advanced allocations and actual efficiency through density and sparsity in Essbase.


