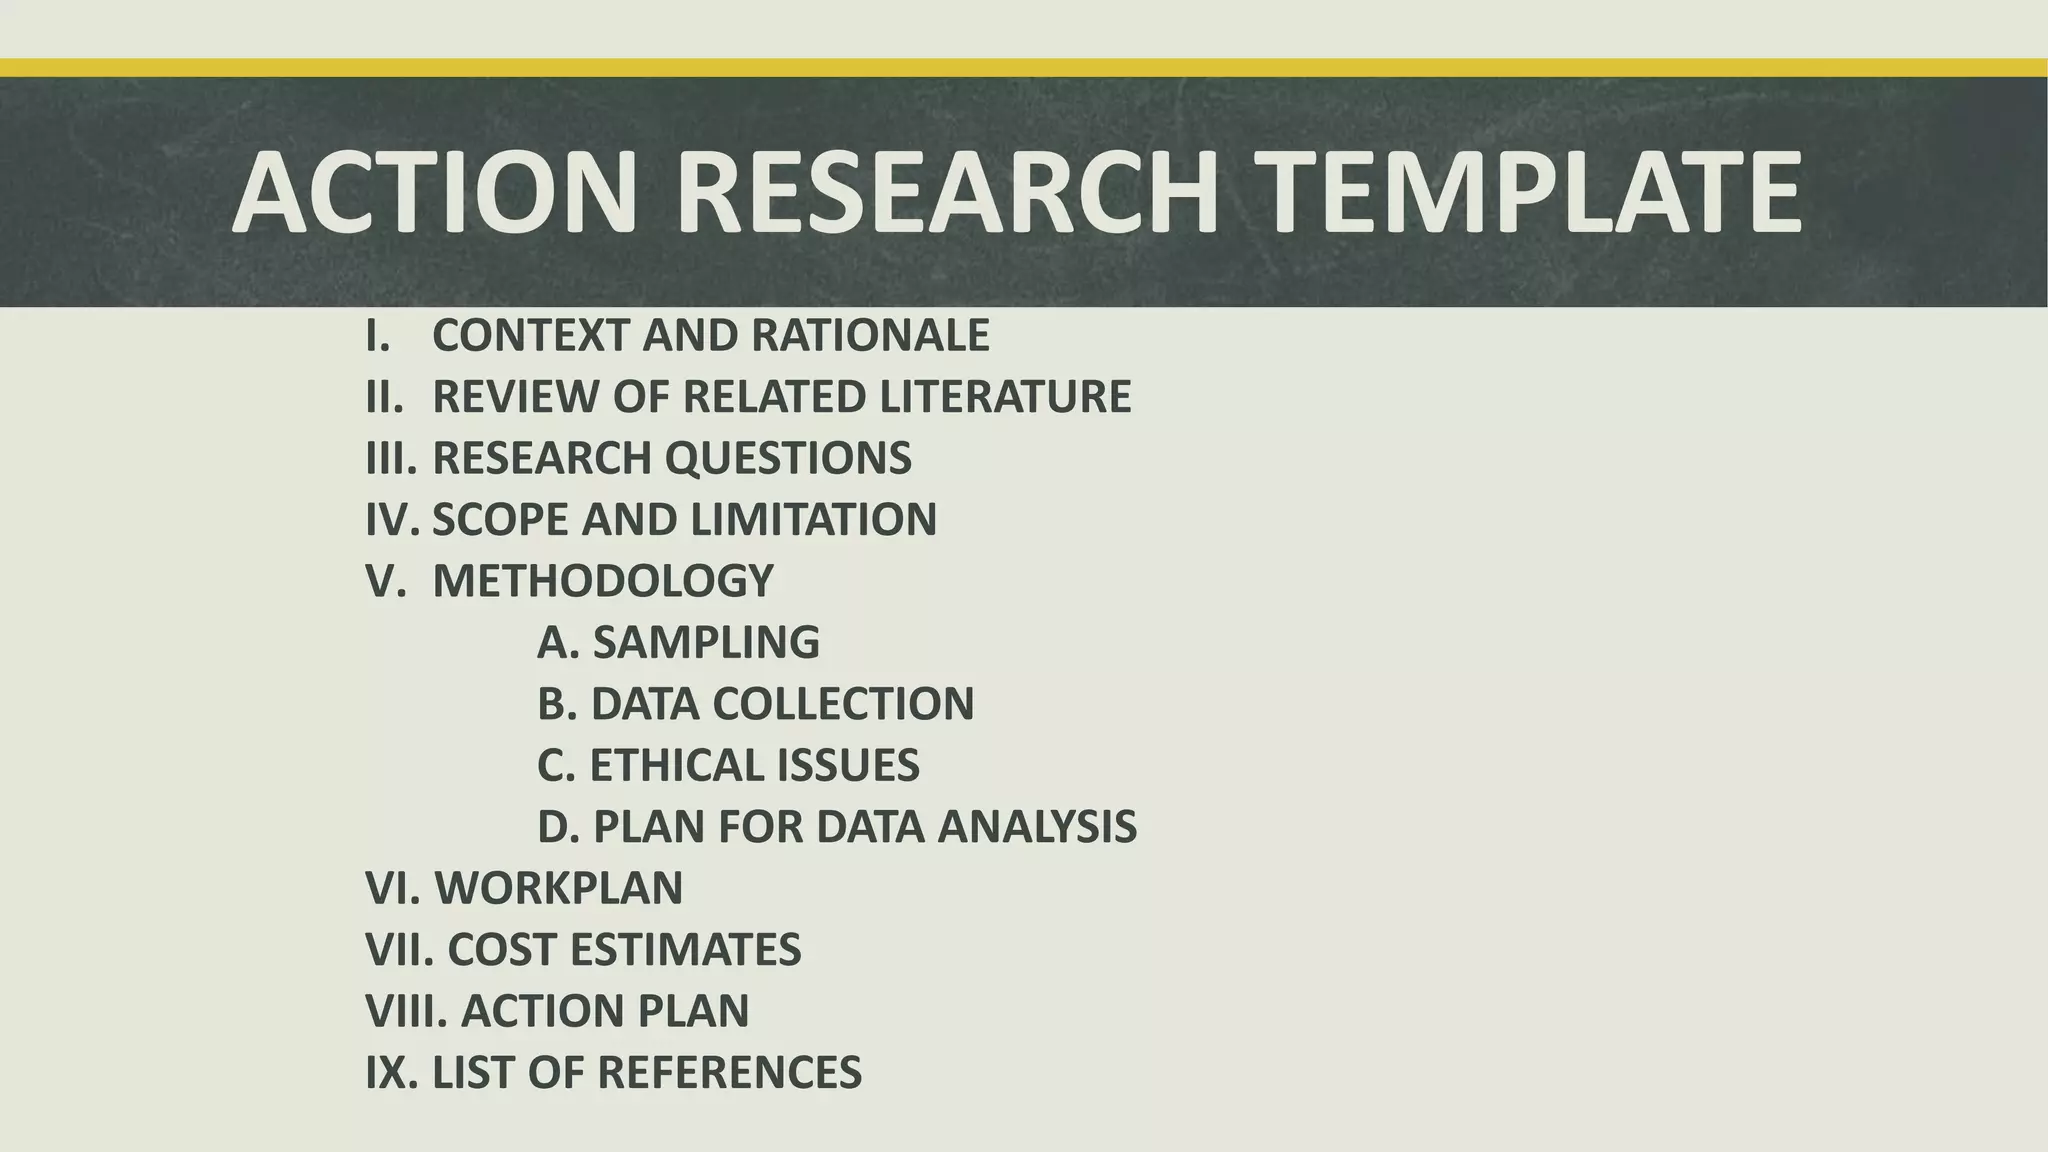
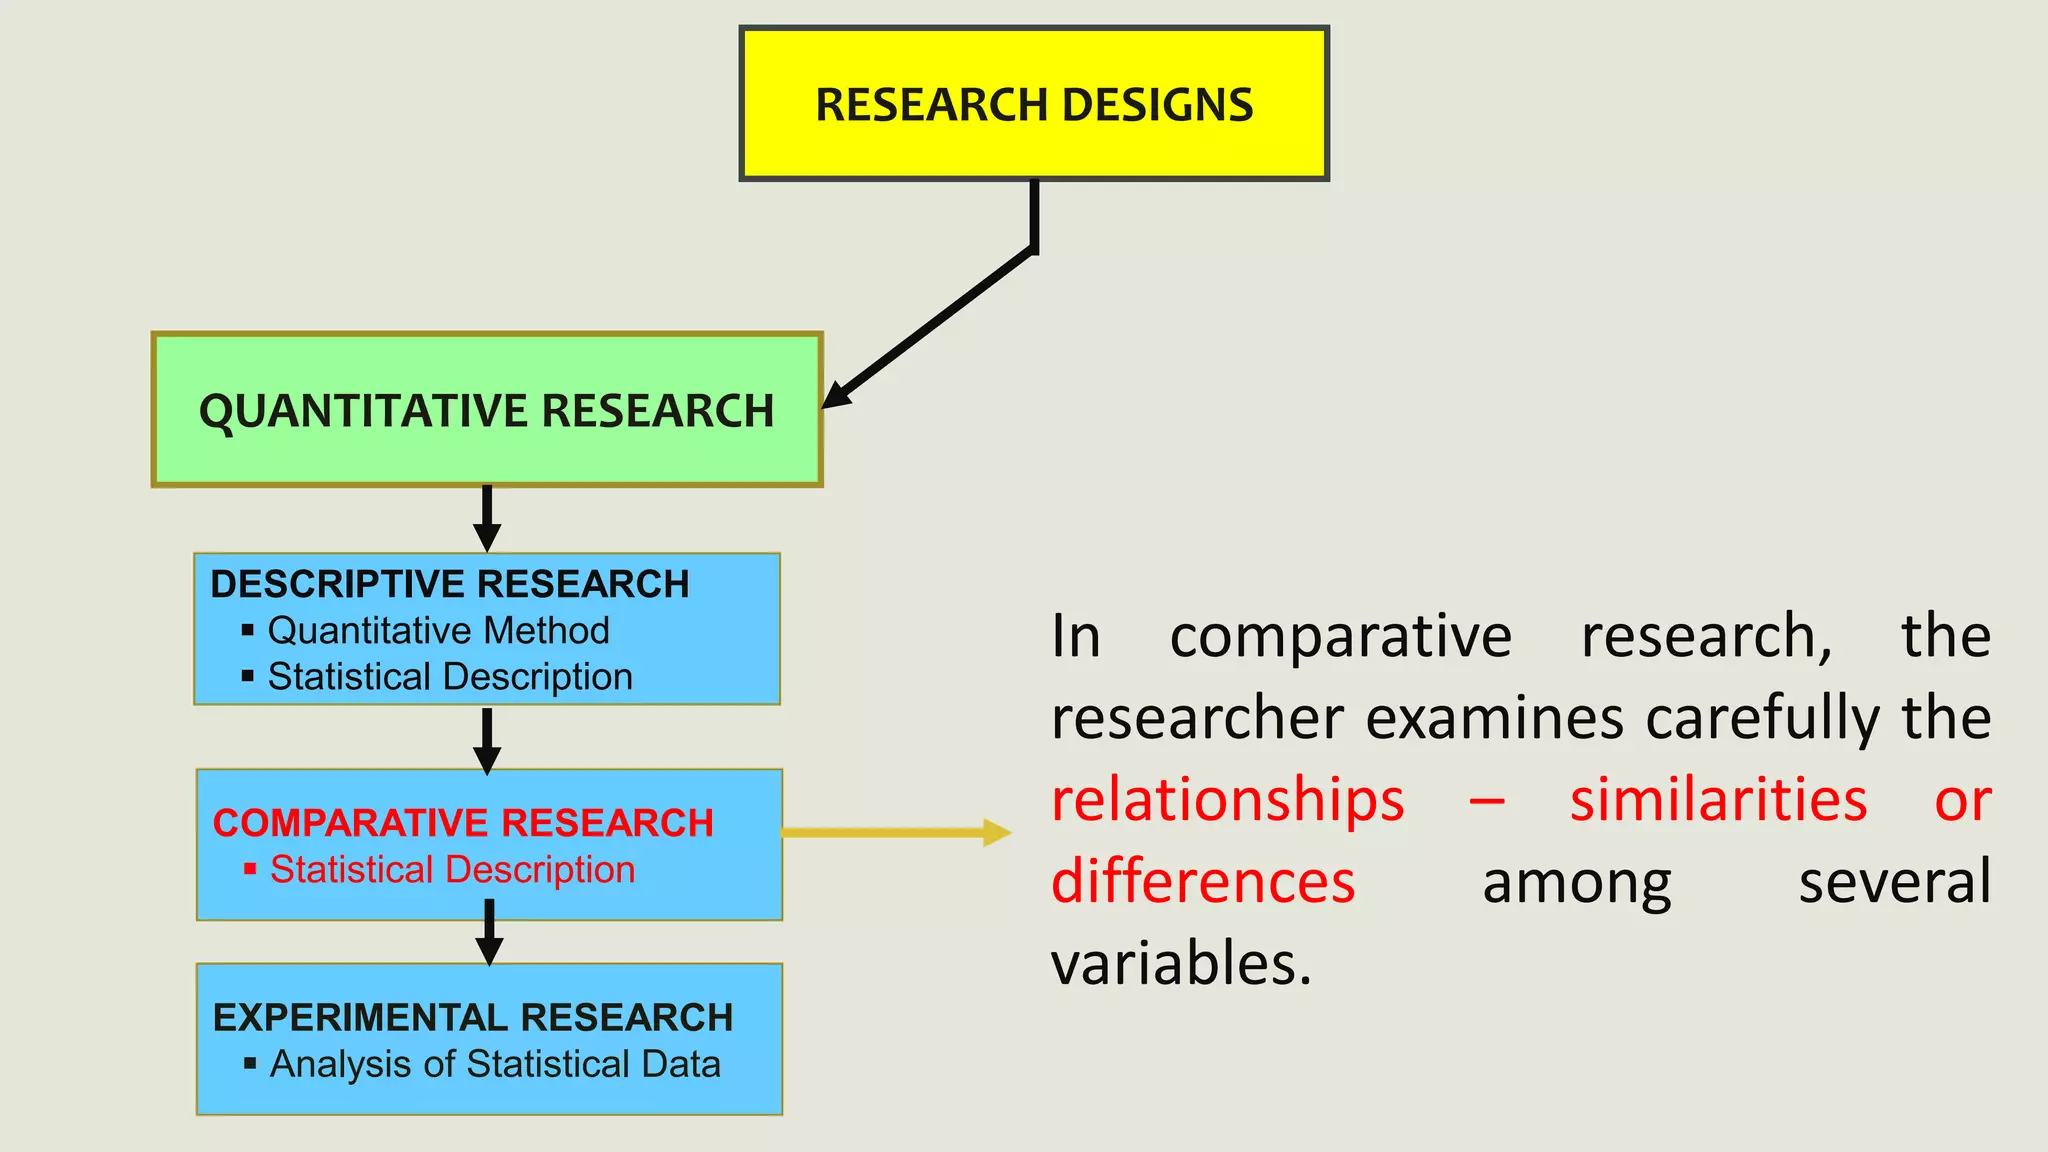
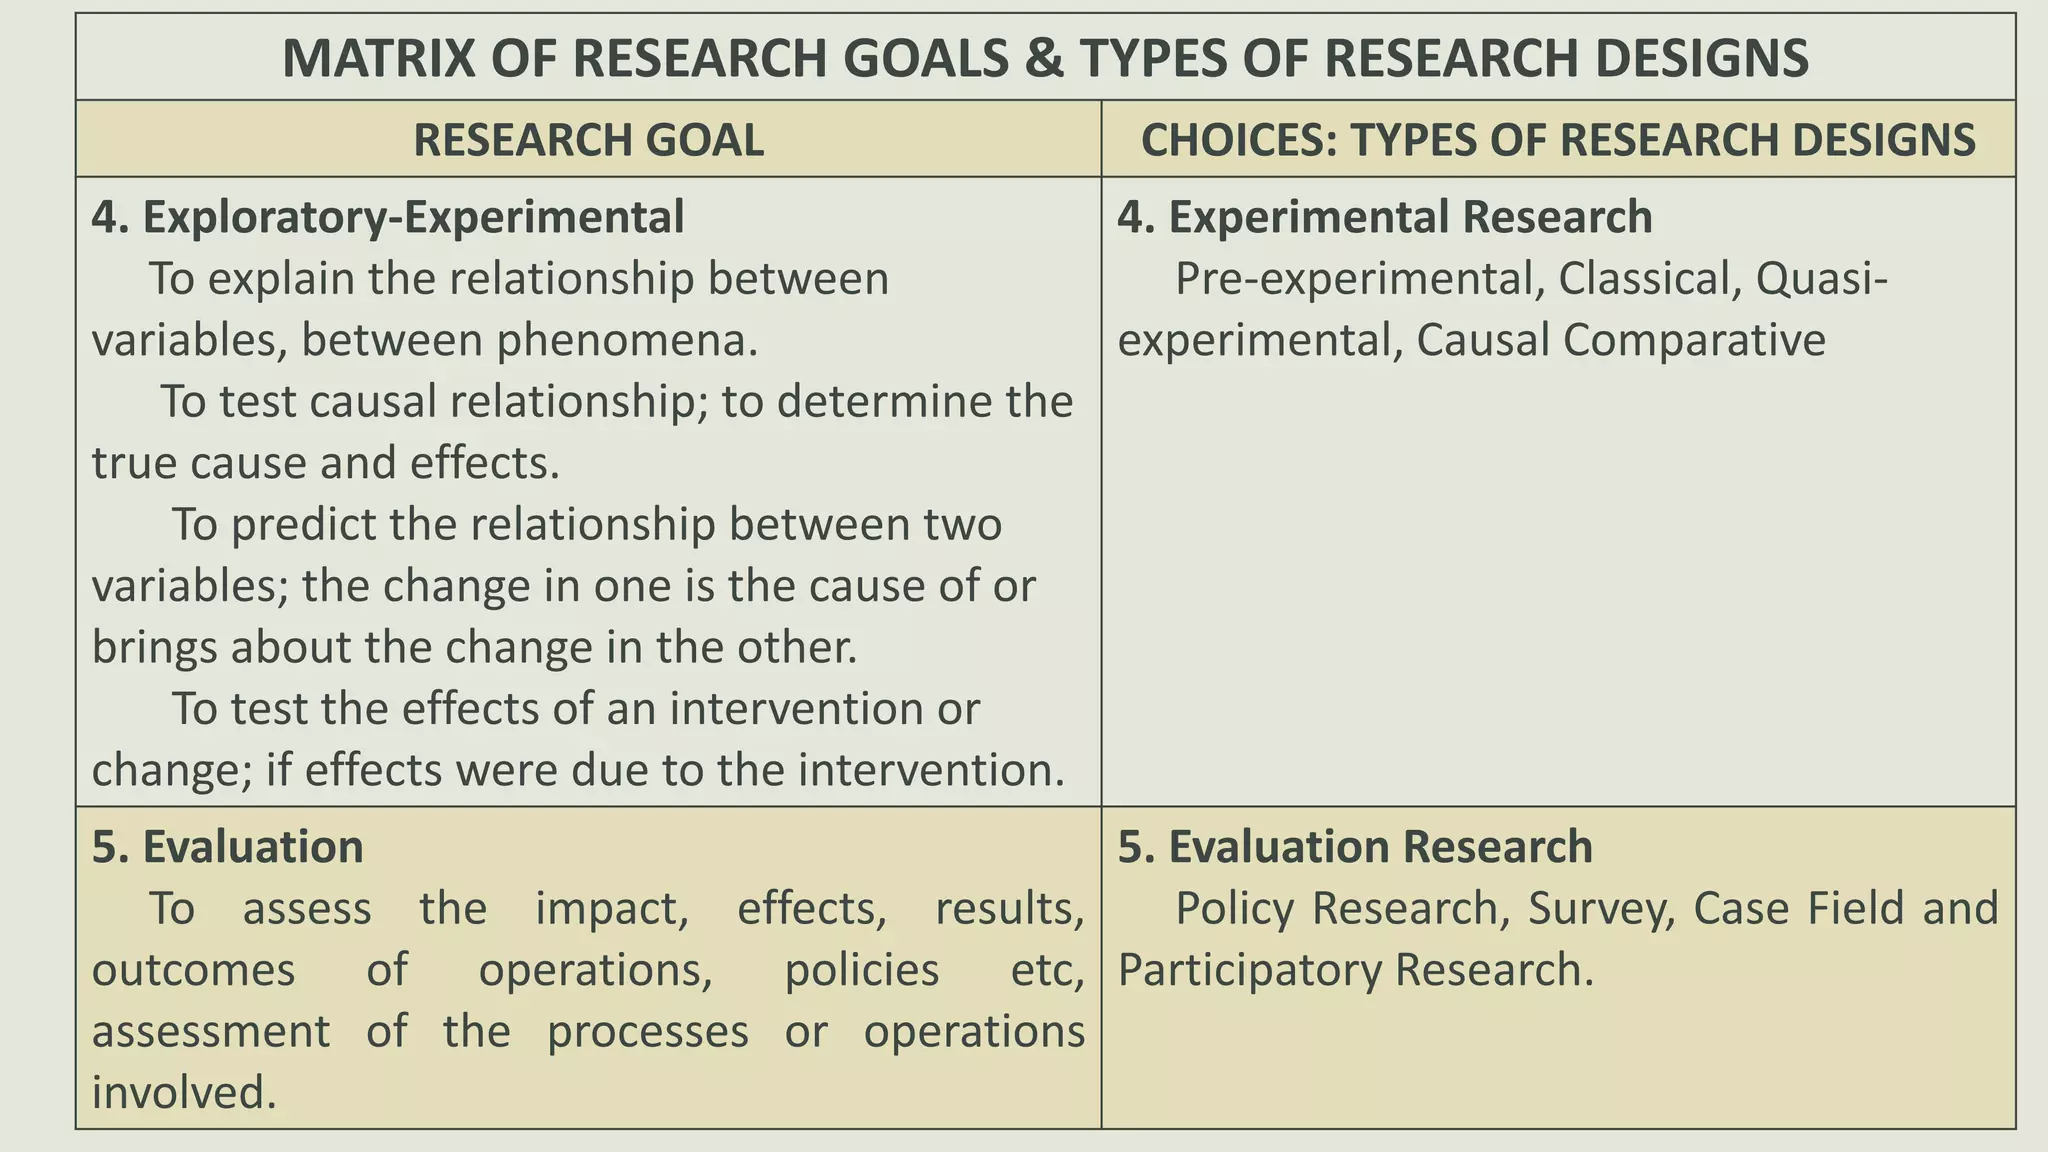
2. FORMAT/TEMPLATE FOR RESEARCH
PROPOSAL
I. INTRODUCTION
II. LITERATURE REVIEW
III. RESEEARCH QUESTION
IV. SCOPE AND LIMITATION
V. RESEARCH METHODOLOGY
A. SAMPLING
B. DATA COLLECTION
C. ETHICAL ISSUES
D. PLAN FOR THE DATA ANALYSIS
VI. TIME TABLE /GRANT CHART
VII. COST ESTIMATES
VIII. PLANS FOR DISSEMINATION AND ADVOCACY
IX. REFERENCES
3. ACTION RESEARCH TEMPLATE
I. CONTEXT AND RATIONALE
II. REVIEW OF RELATED LITERATURE
III. RESEARCH QUESTIONS
IV. SCOPE AND LIMITATION
V. METHODOLOGY
A. SAMPLING
B. DATA COLLECTION
C. ETHICAL ISSUES
D. PLAN FOR DATA ANALYSIS
VI. WORKPLAN
VII. COST ESTIMATES
VIII. ACTION PLAN
IX. LIST OF REFERENCES
4. I. CONTEXT AND RATIONALE
It includes the description and
context of the study and the
reason for conducting it; how
could be used in action planning
5. II. REVIEW OF RELATED LITERATURE
Focuses on key issues which underlie the
action research; general conclusion about
related action research papers; what
research still needs to be done; and what
knowledge gaps remain that the study will
aim to fill.
6. III. RESEARCH QUESTIONS
Identifies the problem/s which will be
addressed by the research in terms of
investigating or testing an idea; trying out
solutions to a problem; creating a new
procedure or system; explaining a
phenomenon; or combination of any of these.
7. IV. SCOPE AND LIMITATION
The coverage of the research in terms of
location, time, respondents, etc.;
inherent design or methodology
parameters that can restrict the scope
of the research findings and are outside
the control of the researcher.
8. V. METHODOLOGY
It contains details how the research will be
conducted.
a. SAMPLING – details should be provided about
who will participate in the research: number of
people and the characteristics of those who will
participate in the research; and how will the
sample be selected and recruited.
9. >
>
A sample size of at least 30 is needed for
statistical laws of probability to operate.
SAMPLE
SLOVIN FORMULA
Persons, events,
places, or things
used as sources of
data
10. 2
1
PROBABILITY
SAMPLING
Each of the units in
the target
population has the
same chance of
being included in
the sample.
SAMPLING
TECHNIQUES
NON-PROBABILITY SAMPLING
No way that each of the units in the target population
has the same chance of being included in the sample
11. PROBABILITY SAMPLING
1. Simple Random Sampling
Every unit of the population has equal chance and non-zero probability
of being included in the sample.
Ways: Lottery Method (Fish Bowl) and Table of Random Numbers
2. Systematic Sampling
This is used when there is ready list of the total universe or population.
3. Stratified Sampling
This scheme is used to ensure that different groups of a population are
adequately represented in the sample.
12. PROBABILITY SAMPLING
4. Cluster Sampling
This is used in large-scale surveys.
5. Multi-stage Sampling
This is usually used for national, provincial or country level studies.
13. NON-PROBABILITY SAMPLING
1. Accidental or Convenience Sampling
It is obtained when the researcher selects whatever sampling units are
conveniently available.
2. Purposive Sampling
The sampling units are selected subjectively by the researcher, who
attempts to obtain a sample that appears to be representative of the
population.
3. Quota Sampling
The researcher determines the sample size which should be filled up.
14. PROBABILITY SAMPLING
4. Snowball Sampling
This type of sampling that starts with the known sources of information,
who or which will in turn give other sources of information.
5. Networking Sampling
This is used to find socially devalued urban populations such as addicts,
alcoholics, child abusers and criminals, because they are usually “hidden
from outsiders.”
15. b. DATA COLLECTION
The various instruments and procedures for
data collection should be outlined and
extensively discussed.
Example. Survey questionnaire, interview,
journals etc.
16. C. ETHICAL ISSUES
Identification of ethical concerns that could possibly
emanate from the conduct of the research, and
discussion on how to prevent these from taking place.
It can include, but not limited to the following: right to
conduct a study of investigation to answer a question;
securing free prior and informed consent from
respondent and/ or parents and guardians of learners;
issues confidentiality and anonymity.
17.
18.
19.
20. d. PLAN FOR DATA ANALYSIS
Indicates how the data will be analyzed
and reported; it should specify the
qualitative and or quantitative methods
that will be used in analyzing the data
gathered for the research.
21. COMPARISON OF QUANTITATIVE and QUALITATIVE RESEARCH
QUANTITATIVE RESEARCH QUALITATIVE RESEARCH
Words used to
describe
Experimental, Hard Data,
Empirical, Positivist,
Statistical, Objective
Ethnographic, Fieldwork,
Naturalistic, Descriptive,
Participant observation, soft
data, and subjective
Key concepts
Variables, Operationalize,
Reliability, Validity, soft data,
subjective
Contextualization, Process,
Field notes, Triangulation,
Insider/outsider perspective,
Making adjustments
Design Structured, Predetermined
Evolves overtime, Flexible,
Developing Hypotheses
Data
Statistical, Operationalized
variables
Descriptive, Field notes,
Documents, Interviews
22. COMPARISON OF QUANTITATIVE and QUALITATIVE RESEARCH
QUANTITATIVE RESEARCH QUALITATIVE RESEARCH
Sample
Randomized, Control for
extraneous variables
Non-representative, Can be
small
Techniques
Experiments, Standardized
instruments, Structured
interview, structured
observation
Observation, Open-ended
interview, Review of
documents, Participants
observation
Data Analysis Deductive, Statistical Ongoing, Inductive
Problem with
approach
Control of extraneous
variables, Validity
Time consuming-data,
Reliability, Generalizability,
Non-standardized
procedures
23. VI. WORKPLAN
Contains the research timelines – when
will the project and how long will it take
for it to be completed; include time
estimates for each step in the research
process (e.g. 5 days, 2 days)
24. VII. COST ESTIMATES
Includes detailed cost, broken down
per research task, activity and/or
deliverable. It can be further grouped
by tranche for easier reference of the
evaluation committee.
26. IX. LIST OF REFERENCES
Provide in text of work and
reference list
27.
28. RESEARCH DESIGN VS METHOD
RESEARCH DESIGN RESEARCH METHOD
SPECIFIC FORMAT and PROCEDURES for
data collection and data analysis and
interpretation.
OVERALL PROCESS of formulating the
theoretical and the conceptual framework,
the operationalization of variables, methods
of data collection, and data analysis and
interpretation.
Master plan specifying the METHODS and
PROCEDURES for collecting and analyzing
the needed information.
TECHNIQUES that the researcher uses to
gather information. Interview method,
surveys, observation, are some of the most
commonly used methods in the social
sciences.
29. RESEARCH DESIGNS
QUANTITATIVE RESEARCH QUALITATIVE RESEARCH
Characterized by the use of statistical analysis.
The three basic quantitative research objectives
are to describe, to compare, and to attribute
causality.
Term used for a range of research strategies that
has root in the research of the social sciences
such as anthropology and sociology.
The method for data collection are participant
observing interviewing, scanning records and
files, using checklists and conducting case
studies.
Concerned with the process of an activity rather
than only with the outcomes of that activity.
Analyzes data rationally rather than statistically.
Premised on the assumption that variables be
mathematically measured and researchers who
adhere to this approach stress that the data should
be verified.
Its major purpose is to answer questions about
variable status by creating numerical descriptions
of the frequency with which one of the variables
occurs.
30. RESEARCH DESIGNS
QUANTITATIVE RESEARCH QUALITATIVE RESEARCH
DESCRIPTIVE RESEARCH
Quantitative Method
Statistical Description
COMPARATIVE RESEARCH
Statistical Description
EXPERIMENTAL RESEARCH
Analysis of Statistical Data
CHARACTERISTICS
31. RESEARCH DESIGNS
QUANTITATIVE RESEARCH
DESCRIPTIVE RESEARCH
Quantitative Method
Statistical Description
COMPARATIVE RESEARCH
Statistical Description
EXPERIMENTAL RESEARCH
Analysis of Statistical Data
Descriptive research seeks to
provide information about one or
more variables. It is used to
answer the question “what
exists.” This question can be
answered on one or two ways:
using quantitative methods or
qualitative methods.
32. RESEARCH DESIGNS
QUANTITATIVE RESEARCH
DESCRIPTIVE RESEARCH
Quantitative Method
Statistical Description
COMPARATIVE RESEARCH
Statistical Description
EXPERIMENTAL RESEARCH
Analysis of Statistical Data
In comparative research, the
researcher examines carefully the
relationships – similarities or
differences among several
variables.
33. RESEARCH DESIGNS
QUANTITATIVE RESEARCH
DESCRIPTIVE RESEARCH
Quantitative Method
Statistical Description
COMPARATIVE RESEARCH
Statistical Description
EXPERIMENTAL RESEARCH
Analysis of Statistical Data
Type of research that seeks to
answer questions about
causation. Researchers attribute
the change in one variable to the
effect of one or more variables.
34. MATRIX OF RESEARCH GOALS & TYPES OF RESEARCH DESIGNS
RESEARCH GOAL CHOICES: TYPES OF RESEARCH DESIGNS
1. Descriptive
To understand the nature, characteristics,
components, aspects of phenomena
1. Descriptive Research
Case Study, Survey Research, Library
Research, Field Research, Documentary
Research, Field Research, Content Analysis &
Participatory Research
2. Exploratory
To uncover data on phenomena that are
not yet fully known; to surface information
for possible formulation of hypothesis
2. Exploratory Research
Library Research, Documentary Research,
Survey Research, Case Study, Field Research
3. Pilot Study
To initiate and experiment with a new set-
up or system and determine results; this can
be replicated-repeated in other situations
3. Action Research
Experiment, Survey Research, Case Study,
Participatory Research
35. MATRIX OF RESEARCH GOALS & TYPES OF RESEARCH DESIGNS
RESEARCH GOAL CHOICES: TYPES OF RESEARCH DESIGNS
4. Exploratory-Experimental
To explain the relationship between
variables, between phenomena.
To test causal relationship; to determine the
true cause and effects.
To predict the relationship between two
variables; the change in one is the cause of or
brings about the change in the other.
To test the effects of an intervention or
change; if effects were due to the intervention.
4. Experimental Research
Pre-experimental, Classical, Quasi-
experimental, Causal Comparative
5. Evaluation
To assess the impact, effects, results,
outcomes of operations, policies etc,
assessment of the processes or operations
involved.
5. Evaluation Research
Policy Research, Survey, Case Field and
Participatory Research.
36. MATRIX OF RESEARCH GOALS & TYPES OF RESEARCH DESIGNS
RESEARCH GOAL CHOICES: TYPES OF RESEARCH DESIGNS
6. Policy Analysis
To generate information relevant to the
development and formulation of policy;
assessment of effects, outcomes, impact of
policies
6. Policy Research
Survey, Field, Library, Documentary,
Historical, Descriptive, Experiment,
Evaluation Research.
7. Feasibility
To determine the factors for success or
viability of a planned course of action
7. Feasibility Research
Survey, Library Research
8. Explanatory-non-causal
To determine the relationship or association
of variables not necessarily in terms of cause
and effect
8. Correlational Research
Case, Field Study
9. Explanatory-causal-non-experimental 9. Cross-sectional Study
Cohort study, Case Control
37. VARIABLE
Discrete variables
It is one that can take on
only a finite or potentially
countable set of values.
ContinuousVariable
It is one that can take on
an infinite set of values
between any two levels of
the variables. They are the
result of measurement.
IndependentVariable
Stimulusvariable
It is a quantity or a characteristics that has
two or more mutually exclusive values or
properties of objects or people that can be
classified, measured or labeled in different
ways.
38. VARIABLE
Dependent variable
Response variable
Moderate Variable
This is secondary or special
type of independent variable
chosen by researcher to
ascertain if it alters or
modifies the relationship.
betweenIV& DV.
Control Variable
This is a variable
controlled by the
researcher in which
the effects can be
neutralized by
eliminating or
removing the
variable.
Intervening Variable
This is a variable which
interferes with the IV & DV,
but its effects can either
strengthen or weaken the
IVs & DVs.
39. MEASUREMENT OF VARIABLES
NOMINAL MEASUREMENT
is the classification of the
measured variables into
differentcategories.
ORDINAL MEASUREMENT
is the amount of a variable
placed in the order of
magnitude along dimension.
INTERVAL MEASUREMENT
is the amount of variable
and ordered along
dimension & the
differences bet. The
assigned numbers
represent equal amounts
in the magnitude of the
variablemeasured.
RATIO MEASUREMENT
is the amount of a variable
along a dimension where the
differences bet. the assigned
numbers represent equal
amounts in the magnitude of
the variable measured.
40. Measure of Central Tendency or Average (Mean)
ARITHMETIC MEAN ( )
The mean of ungrouped data. The sum of all scores divided by the
number of cases.
WEIGHTED ARITHMETIC MEAN
This is applicable to options of different weights. This is also used
when variables being studied are abstract or continuous such that
they cannot be counted individually as adequacy, efficiency,
excellence, extent, seriousness of a problem, and the like.
X
41. STANDARD DEVIATION (SD)
The most commonly used indicator of the degree of dispersion and
the most dependable measure to estimate the variability in a total
population from which the sample came.
2
1
)
(
2
N
X
X
SD
N
N
fM
fM
N
SD
2
2
2
)
(
GROUPED
UNGROUPED
42. STATISTICAL TESTS
PARAMETRIC NON PARAMETRIC
The data must be normally
distributed.
The level of measurement
must be either interval or
ratio
Does not require normality of
the distribution.
The level of measurement
must be either nominal or
ordinal
43. t-Test
The t-test is used to compare two means, the means of two
independent samples or two independent groups and the means of
correlated samples before and after the treatment.
Variable: interval
Test of difference
t-Test for two independent samples t-Test for correlated samples
or or
t-test for independent means t-test for dependent means
44. F-Test
F-test is the analysis of variance (ANOVA). This is used in comparing
the means of two or more independent groups.
Variable: interval/ratio
One-way ANOVA Two-way ANOVA
Used when there is only one
variable involved.
Used when two variables are
involved: the column and the row
variables
45. Pearson Product Moment Coefficient of
Correlation, r
r, is an index of relationship
between two variables.
The value of r is +1, zero to -
1.
Variable: interval
Test of significant
relationship
46. SIMPLE LINEAR REGRESSION
The simple linear regression analysis
is used when there is a significant
relationship between x & y variables.
This is used in predicting the value of
y given the value of x.
Formula: y = a + bx
Variable: interval
47. MULTIPLE REGRESSION
The multiple regression analysis
is used in predictions. The
dependent variable can be
predicted given several
independent variables.
48. CHI-SQUARE TEST
This is a test of difference between the observed and expected
frequencies. The Chi-square is considered a unique test due to its 3
functions which are as follows: test of goodness-of-fit; the test of
homogeneity; the test of independence.
49. CHI-SQUARE TEST OF GOODNESS-OF-FIT
This is a test of difference
between the observed
frequencies and expected
frequencies.
50. CHI-SQUARE TEST OF HOMOGENEITY
This test is concerned with two or
more samples, with only one
criterion variable. This test is
used to determine if two or more
populations are homogeneous.
51. CHI-SQUARE TEST OF INDEPENDENCE
One sample, two criterion
variables
The one-sample test of
independence is different from
the test of homogeneity. The
sample used in this test consists
of members randomly drawn
from the same population.
52. SPEARMAN RANK CORRELATION
COEFFICIENT (, rho)
Spearman’s correlation is designed to
measure the relationship between
variables measured on an ordinal
scale of measurement.
Similar to Pearson’s Correlation,
however it uses ranks as opposed to
actual values.
53. Eta-Squared
A measure of relationship; like a correlation coefficient it tells you on a scale 0
to 1 how much of variance in DV can be account for by each IV.
Analogous to r2 and can be thought of as a % on a scale 0-100.
It is a useful addition to just being told if a relationship or difference is
significant.
Eta-squared reflects the percentage of DV variance explained by the IVs in the
sample data. As an estimate of variance explained in the population it is
upwardly biased (i.e., an overestimate). Thus, omega-squared is a
recommended alternative.
54. KUDER-RICHARDSON FORMULA 20
The Kuder and Richardson Formula 20 test checks the internal consistency of
measurements with dichotomous choices. It is equivalent to performing the
split half methodology on all combinations of questions and is applicable
when each question is either right or wrong. A correct question scores 1 and
an incorrect question scores 0. The test statistic is
Could be used to test reliability of multiple choice test, Short answer, Fill in
the blank
55. KUDER-RICHARDSON FORMULA 21
Used for dichotomously scored items that are all about the same difficulty
Formula: KR21 = [n/(n - 1)] x [1 - (M x (n - M) / (n x Var))]
56. Cronbach’s Alpha
There are several statistical indexes that may be used to measure the amount
of internal consistency for an exam and the most popular index (and the one
reported in Testing & Evaluation’s item analysis) is Cronbach’s alpha.
Cronbach’s alpha provides a measure of the extent to which the items on a
test, each of which could be thought of as a mini-test, provide consistent
information with regard to students’ mastery of the domain.
Cronbach’s alpha is often considered a measure of item homogeneity; i.e.,
large alpha values indicate that the items are tapping a common domain.
58. Cronbach’s Alpha
The widely-accepted social science cut-off is that alpha should be .70 or
higher for a set of items to be considered a scale
Rule: more items, the more reliable a scale will be (alpha increases)
Editor's Notes
Note that your research problem determines the type of design you should use, not the other way around!
Social research needs a design or a structure before data
collection or analysis can commence. A research design is not just a work
plan. A work plan details what has to be done to complete the project but
the work plan will ¯ow from the project's research design. The function of
a research design is to ensure that the evidence obtained enables us to answer the
initial question as unambiguously as possible.
Note that your research problem determines the type of design you should use, not the other way around!
Qualitative research is research dealing with phenomena that are difficult or impossible to quantify mathematically, such as beliefs, meanings, attributes, and symbols
Qualitative researchers aim to gather an in-depth understanding of human behaviour and the reasons that govern such behaviour. The qualitative method investigates the why and how of decision making, not just what, where, when.
Quantitative research refers to the systematic empirical investigation of any phenomena via statistical, mathematical or computational techniques. The objective of quantitative research is to develop and employ mathematical models, theories and/or hypotheses pertaining to phenomena
Note that your research problem determines the type of design you should use, not the other way around!