Download to read offline
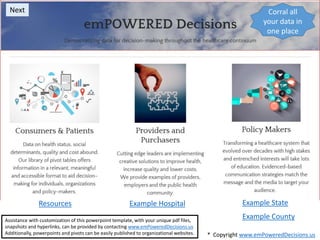

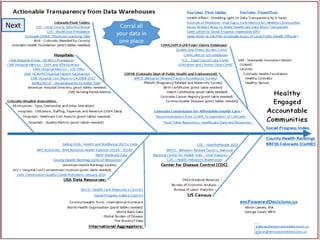


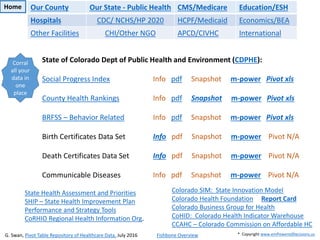

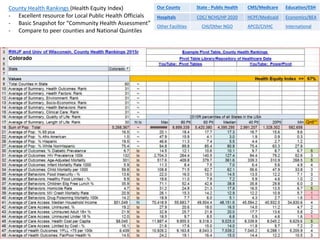


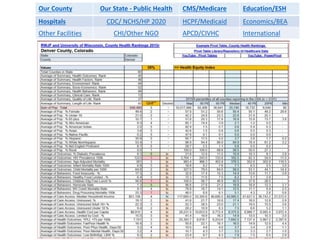


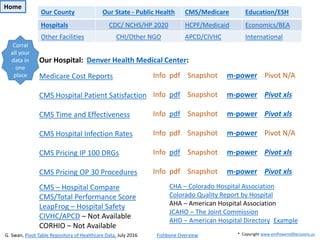

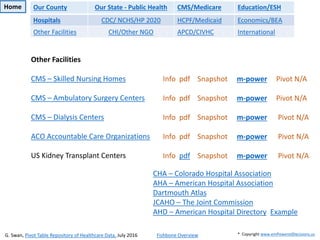

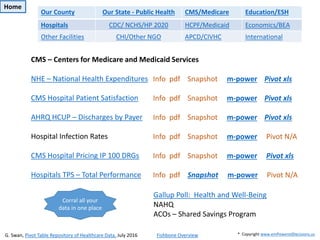
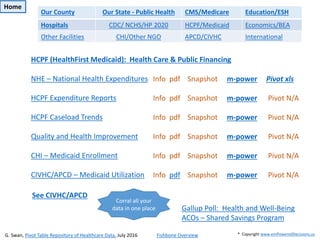
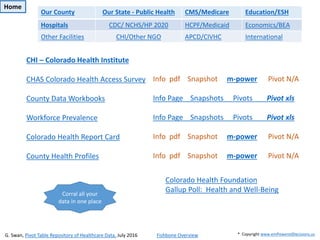
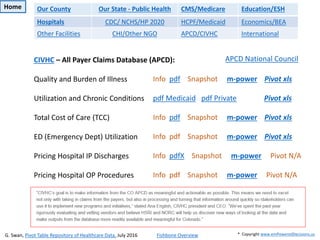


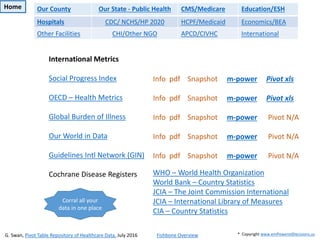

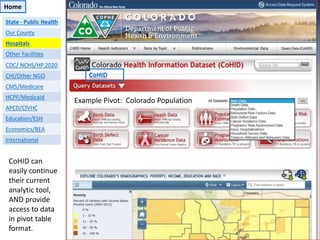
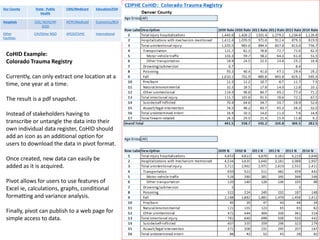

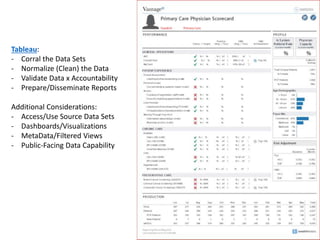
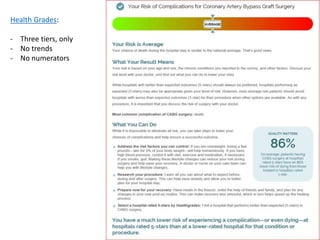

The document outlines resources for customizing healthcare-related PowerPoint templates and pivot tables to enhance data transparency and accessibility for stakeholders involved in community health. It emphasizes the importance of organizing healthcare indicators and offers detailed insights into various data sets, such as social progress indices and county health rankings, aimed at improving public health decision-making. Additionally, the document highlights the significance of real-time data access and tools like pivot tables for tracking community health and enabling effective collaboration among organizations.