1. AnewAmerica Intranet Cost Benefit Analysis Tool
SETUP
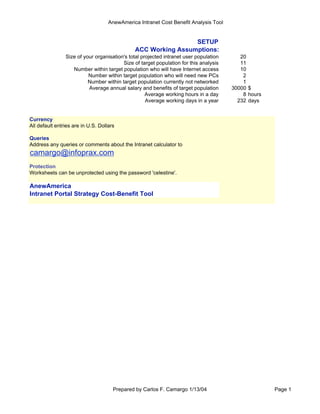
ACC Working Assumptions:
Size of your organisation's total projected intranet user population 20
Size of target population for this analysis 11
Number within target population who will have Internet access 10
Number within target population who will need new PCs 2
Number within target population currently not networked 1
Average annual salary and benefits of target population 30000 $
Average working hours in a day 8 hours
Average working days in a year 232 days
Currency
All default entries are in U.S. Dollars
Queries
Address any queries or comments about the Intranet calculator to
camargo@infoprax.com
Protection
Worksheets can be unprotected using the password 'celestine'.
AnewAmerica
Intranet Portal Strategy Cost-Benefit Tool
Prepared by Carlos F. Camargo 1/13/04 Page 1
2. Intranet Cost Benefit Analysis Tool
COSTS
Start-up capital costs
Write-off period 3 years
Cost of a new PC 1000 $
Cost of providing a network connection to a PC 300 $
Cost of web servers and server software 5000 $
Information publishing
Number of custom software applications 1
Cost per custom application 15000 $
Number of off-the-shelf software applications 0
Cost per off-the-shelf application 2000 $
Intranet e-mail
Cost for e-mail server 2000 $
Cost per e-mail client 50 $
Document management
Number of custom software applications 0
Cost per custom application 25000 $
Number of off-the-shelf software applications 1
Cost per off-the-shelf application 5000 $
Training
Number of custom software applications 1
Cost per custom application 7500 $
Number of off-the-shelf software applications 0
Cost per off-the-shelf application 1500 $
Workflow
Number of simple form-submission applications 1
Cost per form-submission application 1000 $
Number of custom, fully-integrated applications 1
Cost per custom application 15000 $
Number of off-the-shelf fully-integrated applications 1
Cost per off-the-shelf application 5000 $
Databases and other custom systems
Number of custom software applications 1
Cost per custom application 25000 $
Collaborative Communications-Discussion
Number of custom software applications 0
Cost per custom application 5000 $
Number of off-the-shelf software applications 1
Cost per off-the-shelf application 1000 $
Start-up revenue costs
Data Model (DB) & Intranet GUI Design consultancy 10000 $
Promotion 1000 $
Training cost 100 $ per user
Ongoing capital costs
Upgrades to server hardware and software (as % of start-up cost) 25 %pa
Upgrades to off-the-shelf applications (as % of start-up cost) 25 %pa
Ongoing revenue costs
Number of editorial and design personnel 1
Cost per editorial and design person 30000 $pa
Number of technical personnel 0
Cost per technical person 45000 $pa
Cost per PC of providing Internet access 50 $pa
Maintenance of custom applications (as % of development cost) 25 %pa
Ongoing consultancy (as % of start-up cost) 25 %pa
Ongoing promotion (as % of start-up cost) 10 %pa
Ongoing training (as % of start-up cost) 20 %pa
Prepared by Carlos F. Camargo 1/13/04 Page 1
3. Intranet Cost-Benefit Calculator
BENEFITS
Percentage of full year's benefit expected in year 1 50 %
Information publishing
% of target population affected by this intranet usage 90 %
Direct cost savings
1. Formal printed publications
Approx. number of pages of printed material received per person per year 500 pa
Cost in cents per page, including delivery 6 cents
Proportion of these pages that could be delivered solely on-line 100 %
2. Internal photocopied/laser printed publications
Approx. number of pages received per person per day 10 pd
Cost in cents per page, including delivery 4 cents
Proportion of these pages that could be delivered solely on-line 100 %
Labor savings
Minutes saved per person per day for each of the following:
Faster access to information 5 mins
More rapid and easy exchange of information 5 mins
Less duplication of effort - only one owner for each piece of information 2 mins
The ability to control when you access information, i.e. less interruptions 2 mins
Productivity increases
% increase in personal productivity for each of the following:
Availability of more accurate and up-to-date information 5 %
Availability of information not previously available 10 %
Intranet e-mail
% of target population affected by this intranet usage 100 %
Direct cost savings
1. 'Phone calls
Phone calls per person per day to others (incl. external) not on e-mail 2 pd
Cost in cents per call 15 cents
Proportion of these calls that could be replaced with e-mail 50 %
2. Fax
Faxes sent per person per day to others (incl. external) not on e-mail 1 pd
Cost in cents per fax 10 cents
Proportion of these faxes that could be sent as e-mails (+ attachments) 90 %
3. Memos
Memos sent per person per day to others (incl. external) not on e-mail 3 pd
Cost in cents per memo (paper & delivery) 5 p
Proportion of these memos that could be sent as e-mails 100 %
4. Letters
Letters sent per person per day to others (incl external) not on e-mail 2 pd
Cost in cents per letter (paper, envelope & postage) 30 p
Proportion of these letters that could be sent as e-mails 100 %
5. Diskettes/other digital media
Items sent per person per year to others (incl. external) not on e-mail 5 pa
Cost in cents per item (transfer, blank media, post & packaging) 200 cents
Proportion of these that could be sent as e-mail attachments 75 %
Labor savings
Prepared by Carlos F. Camargo 1/13/04 Page 1
4. Intranet Cost-Benefit Calculator
Minutes saved per person per day for each of the following:
Less time trying to get through on the 'phone 5 mins
Less time spent preparing and checking items to be sent out 5 mins
The ability to control when you access information, i.e. less interruptions 3 mins
Productivity increases
% increase in personal productivity for the following:
Faster access to information 5 %
Document management
% of target population affected by this intranet usage 90 %
Direct cost savings
1. Internal photocopied/laser printed documents
Pages received per person per day for review/editing/approval 5 pd
Cost in cents per page, including delivery 10 cents
Proportion of these that could be processed on-line 100 %
2. Diskettes/other digital media
Items sent per person per year to others not able to access on-line 5 pa
Cost in cents per item (transfer, blank media, postage & packaging) 200 cents
Proportion of these that would be accessed on-line 100 %
Labor savings
Minutes saved per person per day for each of the following:
Less time spent sending out documents for review/editing/revision 5 mins
Less time spent locating/obtaining docs for review/edit/revision 2 mins
Less duplication of effort (data/content shared between docs) 2 mins
Less errors caused by undertaking work on incorrect versions 2 mins
Productivity increases
% increase in personal productivity for the following:
Faster access to accurate & up-to-date business documents 3 %
Training
% of target population affected by this intranet usage 90 %
Direct cost savings
1. Travel and accommodation
Number of classroom courses attended per person per year 2 pa
Average cost per person per course for travel and accommodation 50 $
Proportion of these courses that could be delivered over the intranet 100 %
Prepared by Carlos F. Camargo 1/13/04 Page 2
5. Intranet Cost-Benefit Calculator
2. Course delivery costs
Average number of attendees per classroom course 10
Average length in hours of each course 7 hours
Average cost per course for trainer, room and equipment 780 $
Labor savings
Hours saved per person per year travelling to courses 4 hours
Reduction in time to complete training by using self-instructional methods 50 %
Productivity increases
% increase in personal productivity for the following:
Immediate access to required knowledge and skills 1 %
Workflow
% of target population affected by this intranet usage 90 %
Direct cost savings
Number of forms completed per person per year 100 pa
Print, paper and delivery costs per form 10 p
Proportion of these forms that would be completed & submitted on-line 100 %
Labor savings
Less time spent per person per form in obtaining up-to-date copies 2 pa
For each fully-integrated application identified under Costs above:
Number of days saved overall in admin time per year 100 days
Productivity increases
% increase in personal productivity for the following:
Faster and more reliable admin processes 1 %
Databases/custom systems
% of target population affected by this intranet usage 90 %
Labor savings
Minutes saved per person per day for the following:
Less time required to learn applications 2 mins
Less time required to use applications 5 mins
Productivity increases
% increase in personal productivity for the following:
The availability of information not previously available 1 %
Discussion
% of target population affected by this intranet usage 0 %
Direct cost savings
Number of meetings attended per person per year 200 pa
Approximate cost of travel and accommodation per meeting 20 $
% of these that could be effectively conducted using the intranet 100 %
Labor savings
Minutes saved per person per day for the following:
Less time spent travelling to meetings 5 mins
Less time spent in meetings 5 mins
Productivity increases
% increase in personal productivity for each of the following:
Faster resolution of issues/concerns 1 %
Resolution of issues/concerns that would not otherwise be possible 1 %
Prepared by Carlos F. Camargo 1/13/04 Page 3
6. Results Confidential Page 1
Organization Area
analyzed
Start-up capital costs
New PCs 2000
Networking 300
Server hardware & software 5000 2750
Applications:
Information publishing 15000 8250
E-mail (server) 2000 1100
E-mail (clients) 550
Document management 5000 2750
Training 7500 4125
Workflow 21000 11550
Databases/custom systems 25000 13750
Discussion 1000 550
Total 47675
Start-up revenue costs
Design consultancy 10000
Promotion 1000
Training 1100
Total 12100
On-going capital costs
Server upgrades 1250 687.5
Applications upgrades 3250 1925
Total 2612.5
Ongoing revenue costs
Editorial/design personnel 30000
Technical personnel 0 0
Internet access 500
Maintenance of custom apps 15875 8731.25
Design consultancy 2500
Promotion 100
Training 220
Total 42051.25
Summary of costs
Prepared by Carlos F. Camargo 1/13/04 Page 1
7. Results Confidential Page 2
Direct cost labor Productivity Total
savings savings benefits benefits
Information publishing 1216 8663 38739 48617
E-mail 2609 8938 15714 27261
Document management 1247 6806 8650 16704
Training 2534 1760 2941 7235
Workflow 99 26395 2941 29435
Databases/custom systems 0 4331 2941 7272
Discussion 0 0 0 0
Total 7706 56893 71926 136524
Summary of benefits
Prepared by Carlos F. Camargo 1/13/04 Page 2
8. Results Confidential Page 3
Year 1 Year 2 Year 3 Year 4
Benefits
Information publishing 24309 48617 48617 48617
E-mail 13630 27261 27261 27261
Document management 8352 16704 16704 16704
Training 3618 7235 7235 7235
Workflow 14718 29435 29435 29435
Databases/custom systems 3636 7272 7272 7272
Discussion 0 0 0 0
68262 136524 136524 136524
Depreciation of capital costs
New PCs 667 667 667 0
Networking 100 100 100 0
Server h'ware & s'ware 917 1146 1375 688
Applications 14208 14850 15492 1925
15892 16763 17633 2613
Revenue costs
Editorial/design personnel 30000 30000 30000 30000
Technical personnel 0 0 0 0
Internet access 500 500 500 500
Maintenance of custom apps 0 8731 8731 8731
Design consultancy 10000 2500 2500 2500
Promotion 1000 100 100 100
Training 1100 220 220 220
42600 42051 42051 42051
Total costs 58492 58814 59685 44664
Profit or loss 9771 77711 76840 91861
Accumulated profit or loss 9771 87481 164321 256182
Profit & loss by year
Prepared by Carlos F. Camargo 1/13/04 Page 3
9. Results Confidential Page 4
Start-up
Capital costs 47675
Revenue costs 12100
Total investment 59775
Year 1 Year 2 Year 3 Year 4
Benefits 68262 136524 136524 136524
Ongoing capital costs 0 2613 2613 2613
Ongoing revenue costs 30500 42051 42051 42051
Net return 37762 91861 91861 91861
Return on investment (%) 63 154 154 154
Accumulated ROI (%) 63 217 371 524
Payback period (months) 15
Return on investment by year
Prepared by Carlos F. Camargo 1/13/04 Page 4
10. Results Confidential Page 7
Year 5
48617
27261
16704
7235
29435
7272
0
136524
0
0
688
1925
2613
30000
0
500
8731
2500
100
220
42051
44664
91861
348042
Prepared by Carlos F. Camargo 1/13/04 Page 7
11. Results Confidential Page 8
Year 5
136524
2613
42051
91861
154
678
Prepared by Carlos F. Camargo 1/13/04 Page 8
12. Graphs Confidential Page 1
Summary of costs I
0
10
20
30
40
50
PCs Networking Server Apps
Start-up capital costs
0
2
4
6
8
10
Design Promotion Training
Start-up revenue costs
0
500
1000
1500
2000
Server upgrades App upgrades
Ongoing capital costs
Intranet Cost Benefit Analysis Tool
13. Graphs Confidential Page 2
Summary of costs II
0
5
10
15
20
25
30
Edit WWW Design Tng
Ongoing revenue costs
0
10
20
30
40
50
Up cap Up rev On cap On rev
Summary of costs
Intranet Cost Benefit Analysis Tool
14. Graphs Confidential Page 3
Summary of benefits
0
10
20
30
40
50
publ mail docs trng work data disc
Benefits by type and intranet use
Productivity benefits
Labour savings
Direct cost savings
Benefits by type
publishing
e-mail
doc.mgt
training
workflow
databases
discussion
Intranet Cost Benefit Analysis Tool
15. Graphs Confidential Page 4
Profit & loss by year
Benefits & costs by year
0
50
100
150
Year 1 Year 2 Year 3 Year 4 Year 5
Benefits
Costs
0
20
40
60
80
100
Year 1 Year 2 Year 3 Year 4 Year 5
Profit & loss by year
Intranet Cost Benefit Analysis Tool
16. Graphs Confidential Page 5
Return on investment by year
0
50
100
150
200
%
Year 1 Year 2 Year 3 Year 4 Year 5
Return on investment by year
0
200
400
600
800
%
Year 1 Year 2 Year 3 Year 4 Year 5
Accumulated ROI by year
Intranet Cost Benefit Analysis Tool