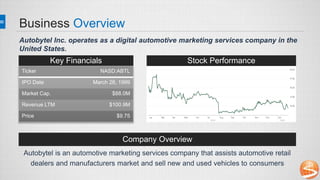
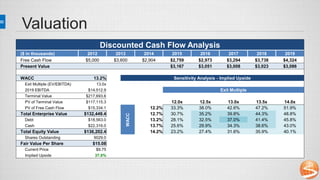
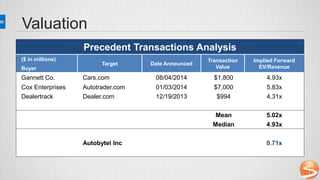
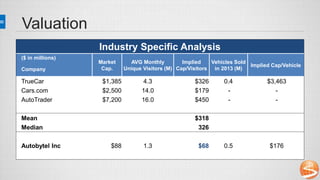
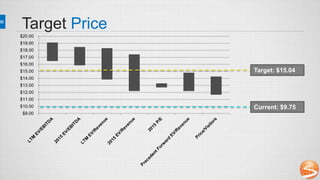
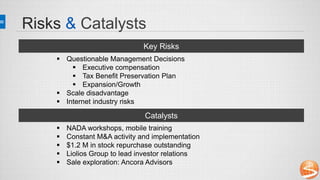
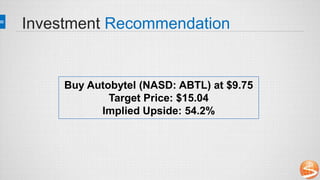
ALICIA HAYRE & NATHAN LI
February 1st, 2015
Autobytel Inc
Business Overview
Key Financials
Autobytel Inc. operates as a digital automotive marketing services company in the
United States.
Stock Performance
Company Overview
Autobytel is an automotive marketing services company that assists automotive retail
dealers and manufacturers market and sell new and used vehicles to consumers
Ticker NASD:ABTL
IPO Date March 26, 1999
Market Cap. $88.0M
Revenue LTM $100.9M
Price $9.75
Business Overview
Advertising
Lead Fees
Other
Company Description
Headquartered in Irvine, California – Founded by Pete Ellis in 1995
New Vehicle Lead Program, Used Vehicle Lead Program, Finance Lead Program
Dealer marketing products and services, and consumer-facing websites
Supplementary Products & Services Revenue Breakdown
Consumer Autobytel Dealer
Investment Thesis
 Strong competitive advantages and healthy financial position
 Growth through acquisitions and service expansion
 Overreaction from revision of AutoUSA acquisition
 Undervalued from valuations
Internal Analysis
25%
21%
12%
5%
13%
7%
Lead Conversion  Competitive Advantages
 Internally Generated High-Quality Leads
 Search Engine Optimization/Marketing
 Partnering with other websites
 Exclusive Systems/Relationships
 Technology patents
 SaleMove technology
 Wide range of services
 Mobile
 Web
 Email
Internal Analysis
 Revenue growth at CAGR of 11% over past 4 years
 Gross Margin consistently ~40%
 EBITDA from -$8.8M to $4.0M over past 4 years
 ROA ~50%
 ROE ~78%
 ROI ~63%
 Debt to Capital of 21%
 Current Ratio of 2.0x
 $35M tax benefit
Internal Analysis
Recent Management Changes
 New Senior Vice President, Chief Financial Officer: Kimberly Boren
 Kimberly has been with Autobytel since 2007 and has received a series of promotions
Current Management
 President & CEO: Jeffrey Coats
 President & CEO since 2008
 Board Member since 1996
 Has held executive positions at five other companies
 M.B.A in International Management
 Recently purchased 16,000 shares at $10-11
Internal Analysis
Strategic Acquisitons & Investments
2010 - Received MyGarage
technology – provides free
mechanic advice, diagnostic
tools, and access to ratings &
reviews of service facilities
2013 - Received 8,000
preferred shares, as well as the
Autoweb.com domain and two
registered trademarks.
2013 - Received exclusivity
rights to be the only provider of
SaleMove’s patented online-
shopping technology in the
automotive industry.
2013 - Received customer
contracts, technology license
and domain rights, and short
codes used for SMS texting.
2014 - Received 1400 new net
dealers, scale, and better inventory.
2010 – Major source of new
purchase requests & search
engine optimization techniques
Internal Analysis
Overall Performance
AutoUSA
Revision Analyst updates and
changes in short interest
 27% drop  $27M  $10-14M less Revenue
Purchased
AutoUSA
External Analysis
 JD Power estimates 1% growth for 2015 domestic light vehicle retail sales
 Dealers will look for high return-on-spending
 Increased mobile and Internet usage
 Drive further demand for Autobytel’s services from dealers
 Small scale compared to industry and with greater use of its limited assets
 Spends significantly lower percentage of revenue on marketing/advertising
Sales & Marketing Expense Analysis (Fiscal 2013)
($ in millions)
EV Revenue
Sales & Marketing
Expense
Sales & Marketing Expense
% of RevenueCompany
TrueCar $1,477 $134 $75 56%
Autobytel $80 $78 $10 13%
External Analysis - TrueCar
 Closest public competitor
 Displays recent purchases
 $113M cash on hand
 High cost for dealers
 $300/new sold
 $400/used sold
 Aggressive top-line at the
cost of bottom-line
-60
-40
-20
0
20
40
60
80
100
120
140
2009 2010 2011 2012 2013
Revenue and EBITDA Growth ($M)
TRUE Revenue
TRUE EBITDA
ABTL Revenue
ABTL EBITDA
External Analysis - TrueCar
Weighted Average Conversion Rate Calculation
Internal Leads to Total Leads 69.0%
Conversion Rate 21.0%
14.5%
External Leads to Total Leads 31.0%
Conversion Rate 12.0%
3.7%
WACR 18.2%
$400
$367
$300
$275
$220
$122
$88
Effective Cost per Sale
Valuation
Comparable Companies Analysis
($ in millions)
Sector Price
Market
Cap.
Revenue
Enterprise
Value
EV/EBITDA EV/REVENUE P/E
Company LTM 2015E LTM 2015E LTM 2015E
TrueCar Inc Car $17.58 $1,385 $191 $1,283 (37.5) (25.5) 6.7 4.6 (30.0) 146.5
Everyday Health Inc Health 13.88 428 174 410 32.0 24.5 2.4 1.8 (96.2) 18.5
TechTarget Inc Corporate IT 11.05 357 99 335 32.2 26.5 3.4 2.8 150.3 27.6
Care.com Inc Family Care 7.97 251 106 168 (4.2) (2.6) 1.6 1.0 (5.8) (10.8)
Angie's List Inc Diversified 4.59 269 302 266 (13.4) (11.2) 0.9 0.7 (10.9) (459.0)
Constant Contact Inc Diversified 37.82 1,199 319 1097 27.5 22.6 3.4 2.8 99.1 28.9
Mean $568 $185 $520 30.6x 24.5x 2.4x 1.8x NM 25.0x
Median 357 174 335 32.0x 24.5x 2.3x 1.8x NM 27.6x
Autobytel Inc Car $9.75 $88 $101 $84 16.0x 13.7x 0.8x 0.7x 26.3x 21.2x
Valuation
Discounted Cash Flow Analysis
($ in thousands) 2012 2013 2014 2015 2016 2017 2018 2019
Free Cash Flow $5,000 $3,600 $2,904 $2,759 $2,973 $3,294 $3,738 $4,324
Present Value $3,167 $3,051 $3,008 $3,023 $3,086
WACC 13.2% Sensitivity Analysis - Implied Upside
Exit Multiple (EV/EBITDA) 13.0x
2019 EBITDA $14,512.9 Exit Multiple
Terminal Value $217,693.6
PV of Terminal Value $117,115.3 12.0x 12.5x 13.0x 13.5x 14.0x
PV of Free Cash Flow $15,334.1
WACC
12.2% 33.3% 38.0% 42.6% 47.2% 51.9%
Total Enterprise Value $132,449.4 12.7% 30.7% 35.2% 39.8% 44.3% 48.8%
Debt $18,563.0 13.2% 28.1% 32.5% 37.0% 41.4% 45.8%
Cash $22,316.0 13.7% 25.6% 29.9% 34.3% 38.6% 43.0%
Total Equity Value $136,202.4 14.2% 23.2% 27.4% 31.6% 35.9% 40.1%
Shares Outstanding 9029.0
Fair Value Per Share $15.08
Current Price $9.75
Implied Upside 37.0%
Valuation
Precedent Transactions Analysis
($ in millions)
Target Date Announced
Transaction
Value
Implied Forward
EV/RevenueBuyer
Gannett Co. Cars.com 08/04/2014 $1,800 4.93x
Cox Enterprises Autotrader.com 01/03/2014 $7,000 5.83x
Dealertrack Dealer.com 12/19/2013 $994 4.31x
Mean 5.02x
Median 4.93x
Autobytel Inc 0.71x
Valuation
Industry Specific Analysis
($ in millions)
Market
Cap.
AVG Monthly
Unique Visitors (M)
Implied
Cap/Visitors
Vehicles Sold
in 2013 (M)
Implied Cap/Vehicle
Company
TrueCar $1,385 4.3 $326 0.4 $3,463
Cars.com $2,500 14.0 $179 - -
AutoTrader $7,200 16.0 $450 - -
Mean $318
Median 326
Autobytel Inc $88 1.3 $68 0.5 $176
Target Price
Target: $15.04
Current: $9.75
$9.00
$10.00
$11.00
$12.00
$13.00
$14.00
$15.00
$16.00
$17.00
$18.00
$19.00
$20.00
Risks & Catalysts
Key Risks
Catalysts
 Questionable Management Decisions
 Executive compensation
 Tax Benefit Preservation Plan
 Expansion/Growth
 Scale disadvantage
 Internet industry risks
 NADA workshops, mobile training
 Constant M&A activity and implementation
 $1.2 M in stock repurchase outstanding
 Liolios Group to lead investor relations
 Sale exploration: Ancora Advisors
Investment Recommendation
Buy Autobytel (NASD: ABTL) at $9.75
Target Price: $15.04
Implied Upside: 54.2%

ABTL

  • 1.
    ALICIA HAYRE &NATHAN LI February 1st, 2015 Autobytel Inc
  • 2.
    Business Overview Key Financials AutobytelInc. operates as a digital automotive marketing services company in the United States. Stock Performance Company Overview Autobytel is an automotive marketing services company that assists automotive retail dealers and manufacturers market and sell new and used vehicles to consumers Ticker NASD:ABTL IPO Date March 26, 1999 Market Cap. $88.0M Revenue LTM $100.9M Price $9.75
  • 3.
    Business Overview Advertising Lead Fees Other CompanyDescription Headquartered in Irvine, California – Founded by Pete Ellis in 1995 New Vehicle Lead Program, Used Vehicle Lead Program, Finance Lead Program Dealer marketing products and services, and consumer-facing websites Supplementary Products & Services Revenue Breakdown Consumer Autobytel Dealer
  • 4.
    Investment Thesis  Strongcompetitive advantages and healthy financial position  Growth through acquisitions and service expansion  Overreaction from revision of AutoUSA acquisition  Undervalued from valuations
  • 5.
    Internal Analysis 25% 21% 12% 5% 13% 7% Lead Conversion Competitive Advantages  Internally Generated High-Quality Leads  Search Engine Optimization/Marketing  Partnering with other websites  Exclusive Systems/Relationships  Technology patents  SaleMove technology  Wide range of services  Mobile  Web  Email
  • 6.
    Internal Analysis  Revenuegrowth at CAGR of 11% over past 4 years  Gross Margin consistently ~40%  EBITDA from -$8.8M to $4.0M over past 4 years  ROA ~50%  ROE ~78%  ROI ~63%  Debt to Capital of 21%  Current Ratio of 2.0x  $35M tax benefit
  • 7.
    Internal Analysis Recent ManagementChanges  New Senior Vice President, Chief Financial Officer: Kimberly Boren  Kimberly has been with Autobytel since 2007 and has received a series of promotions Current Management  President & CEO: Jeffrey Coats  President & CEO since 2008  Board Member since 1996  Has held executive positions at five other companies  M.B.A in International Management  Recently purchased 16,000 shares at $10-11
  • 8.
    Internal Analysis Strategic Acquisitons& Investments 2010 - Received MyGarage technology – provides free mechanic advice, diagnostic tools, and access to ratings & reviews of service facilities 2013 - Received 8,000 preferred shares, as well as the Autoweb.com domain and two registered trademarks. 2013 - Received exclusivity rights to be the only provider of SaleMove’s patented online- shopping technology in the automotive industry. 2013 - Received customer contracts, technology license and domain rights, and short codes used for SMS texting. 2014 - Received 1400 new net dealers, scale, and better inventory. 2010 – Major source of new purchase requests & search engine optimization techniques
  • 9.
    Internal Analysis Overall Performance AutoUSA RevisionAnalyst updates and changes in short interest  27% drop  $27M  $10-14M less Revenue Purchased AutoUSA
  • 10.
    External Analysis  JDPower estimates 1% growth for 2015 domestic light vehicle retail sales  Dealers will look for high return-on-spending  Increased mobile and Internet usage  Drive further demand for Autobytel’s services from dealers  Small scale compared to industry and with greater use of its limited assets  Spends significantly lower percentage of revenue on marketing/advertising Sales & Marketing Expense Analysis (Fiscal 2013) ($ in millions) EV Revenue Sales & Marketing Expense Sales & Marketing Expense % of RevenueCompany TrueCar $1,477 $134 $75 56% Autobytel $80 $78 $10 13%
  • 11.
    External Analysis -TrueCar  Closest public competitor  Displays recent purchases  $113M cash on hand  High cost for dealers  $300/new sold  $400/used sold  Aggressive top-line at the cost of bottom-line -60 -40 -20 0 20 40 60 80 100 120 140 2009 2010 2011 2012 2013 Revenue and EBITDA Growth ($M) TRUE Revenue TRUE EBITDA ABTL Revenue ABTL EBITDA
  • 12.
    External Analysis -TrueCar Weighted Average Conversion Rate Calculation Internal Leads to Total Leads 69.0% Conversion Rate 21.0% 14.5% External Leads to Total Leads 31.0% Conversion Rate 12.0% 3.7% WACR 18.2% $400 $367 $300 $275 $220 $122 $88 Effective Cost per Sale
  • 13.
    Valuation Comparable Companies Analysis ($in millions) Sector Price Market Cap. Revenue Enterprise Value EV/EBITDA EV/REVENUE P/E Company LTM 2015E LTM 2015E LTM 2015E TrueCar Inc Car $17.58 $1,385 $191 $1,283 (37.5) (25.5) 6.7 4.6 (30.0) 146.5 Everyday Health Inc Health 13.88 428 174 410 32.0 24.5 2.4 1.8 (96.2) 18.5 TechTarget Inc Corporate IT 11.05 357 99 335 32.2 26.5 3.4 2.8 150.3 27.6 Care.com Inc Family Care 7.97 251 106 168 (4.2) (2.6) 1.6 1.0 (5.8) (10.8) Angie's List Inc Diversified 4.59 269 302 266 (13.4) (11.2) 0.9 0.7 (10.9) (459.0) Constant Contact Inc Diversified 37.82 1,199 319 1097 27.5 22.6 3.4 2.8 99.1 28.9 Mean $568 $185 $520 30.6x 24.5x 2.4x 1.8x NM 25.0x Median 357 174 335 32.0x 24.5x 2.3x 1.8x NM 27.6x Autobytel Inc Car $9.75 $88 $101 $84 16.0x 13.7x 0.8x 0.7x 26.3x 21.2x
  • 14.
    Valuation Discounted Cash FlowAnalysis ($ in thousands) 2012 2013 2014 2015 2016 2017 2018 2019 Free Cash Flow $5,000 $3,600 $2,904 $2,759 $2,973 $3,294 $3,738 $4,324 Present Value $3,167 $3,051 $3,008 $3,023 $3,086 WACC 13.2% Sensitivity Analysis - Implied Upside Exit Multiple (EV/EBITDA) 13.0x 2019 EBITDA $14,512.9 Exit Multiple Terminal Value $217,693.6 PV of Terminal Value $117,115.3 12.0x 12.5x 13.0x 13.5x 14.0x PV of Free Cash Flow $15,334.1 WACC 12.2% 33.3% 38.0% 42.6% 47.2% 51.9% Total Enterprise Value $132,449.4 12.7% 30.7% 35.2% 39.8% 44.3% 48.8% Debt $18,563.0 13.2% 28.1% 32.5% 37.0% 41.4% 45.8% Cash $22,316.0 13.7% 25.6% 29.9% 34.3% 38.6% 43.0% Total Equity Value $136,202.4 14.2% 23.2% 27.4% 31.6% 35.9% 40.1% Shares Outstanding 9029.0 Fair Value Per Share $15.08 Current Price $9.75 Implied Upside 37.0%
  • 15.
    Valuation Precedent Transactions Analysis ($in millions) Target Date Announced Transaction Value Implied Forward EV/RevenueBuyer Gannett Co. Cars.com 08/04/2014 $1,800 4.93x Cox Enterprises Autotrader.com 01/03/2014 $7,000 5.83x Dealertrack Dealer.com 12/19/2013 $994 4.31x Mean 5.02x Median 4.93x Autobytel Inc 0.71x
  • 16.
    Valuation Industry Specific Analysis ($in millions) Market Cap. AVG Monthly Unique Visitors (M) Implied Cap/Visitors Vehicles Sold in 2013 (M) Implied Cap/Vehicle Company TrueCar $1,385 4.3 $326 0.4 $3,463 Cars.com $2,500 14.0 $179 - - AutoTrader $7,200 16.0 $450 - - Mean $318 Median 326 Autobytel Inc $88 1.3 $68 0.5 $176
  • 17.
    Target Price Target: $15.04 Current:$9.75 $9.00 $10.00 $11.00 $12.00 $13.00 $14.00 $15.00 $16.00 $17.00 $18.00 $19.00 $20.00
  • 18.
    Risks & Catalysts KeyRisks Catalysts  Questionable Management Decisions  Executive compensation  Tax Benefit Preservation Plan  Expansion/Growth  Scale disadvantage  Internet industry risks  NADA workshops, mobile training  Constant M&A activity and implementation  $1.2 M in stock repurchase outstanding  Liolios Group to lead investor relations  Sale exploration: Ancora Advisors
  • 19.
    Investment Recommendation Buy Autobytel(NASD: ABTL) at $9.75 Target Price: $15.04 Implied Upside: 54.2%