Download to read offline


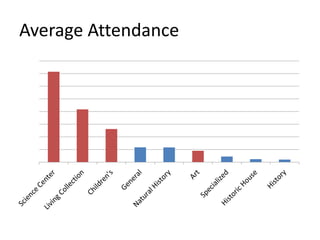
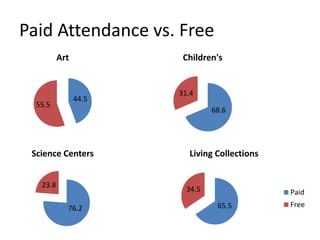
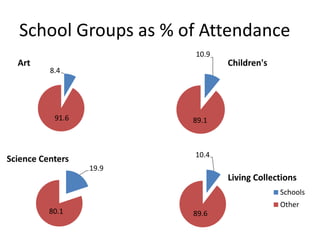
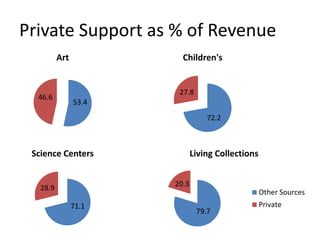
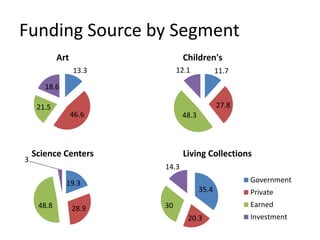
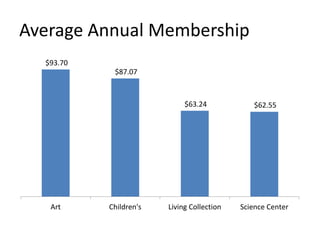
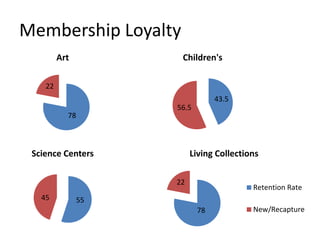
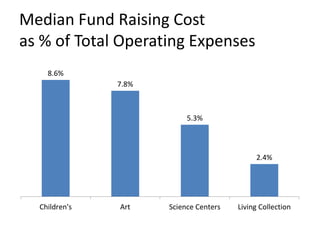
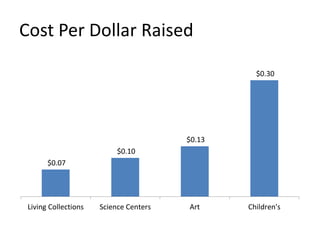
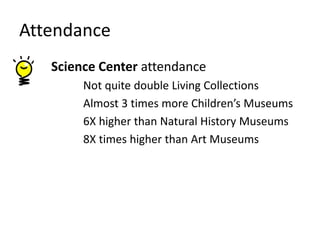
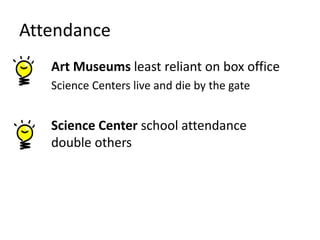


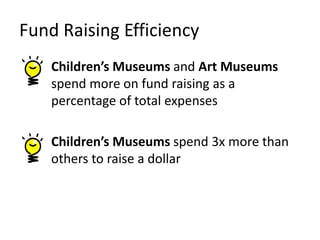

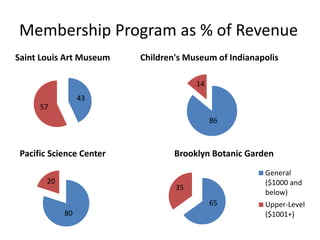
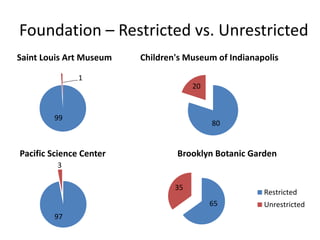


The document presents an analysis of attendance and revenue sources across various types of museums, including art, children's, science centers, and living collections. It highlights differences in membership, fundraising efficiency, and reliance on private and annual support for each category. Key findings indicate that children's museums experience the highest membership turnover and fundraising costs, while art museums are the least reliant on box office revenue.


![[MOSUT20150131] Linux Runs on SoCKit Board with the GPGPU](https://cdn.slidesharecdn.com/ss_thumbnails/linuxrunsonsockitboardwiththegpgpu-150127112230-conversion-gate02-thumbnail.jpg?width=640&height=640&fit=bounds)


![New Media + Didattica Museale [Part 1]](https://cdn.slidesharecdn.com/ss_thumbnails/nmmuseums1-181113124013-thumbnail.jpg?width=640&height=640&fit=bounds)


