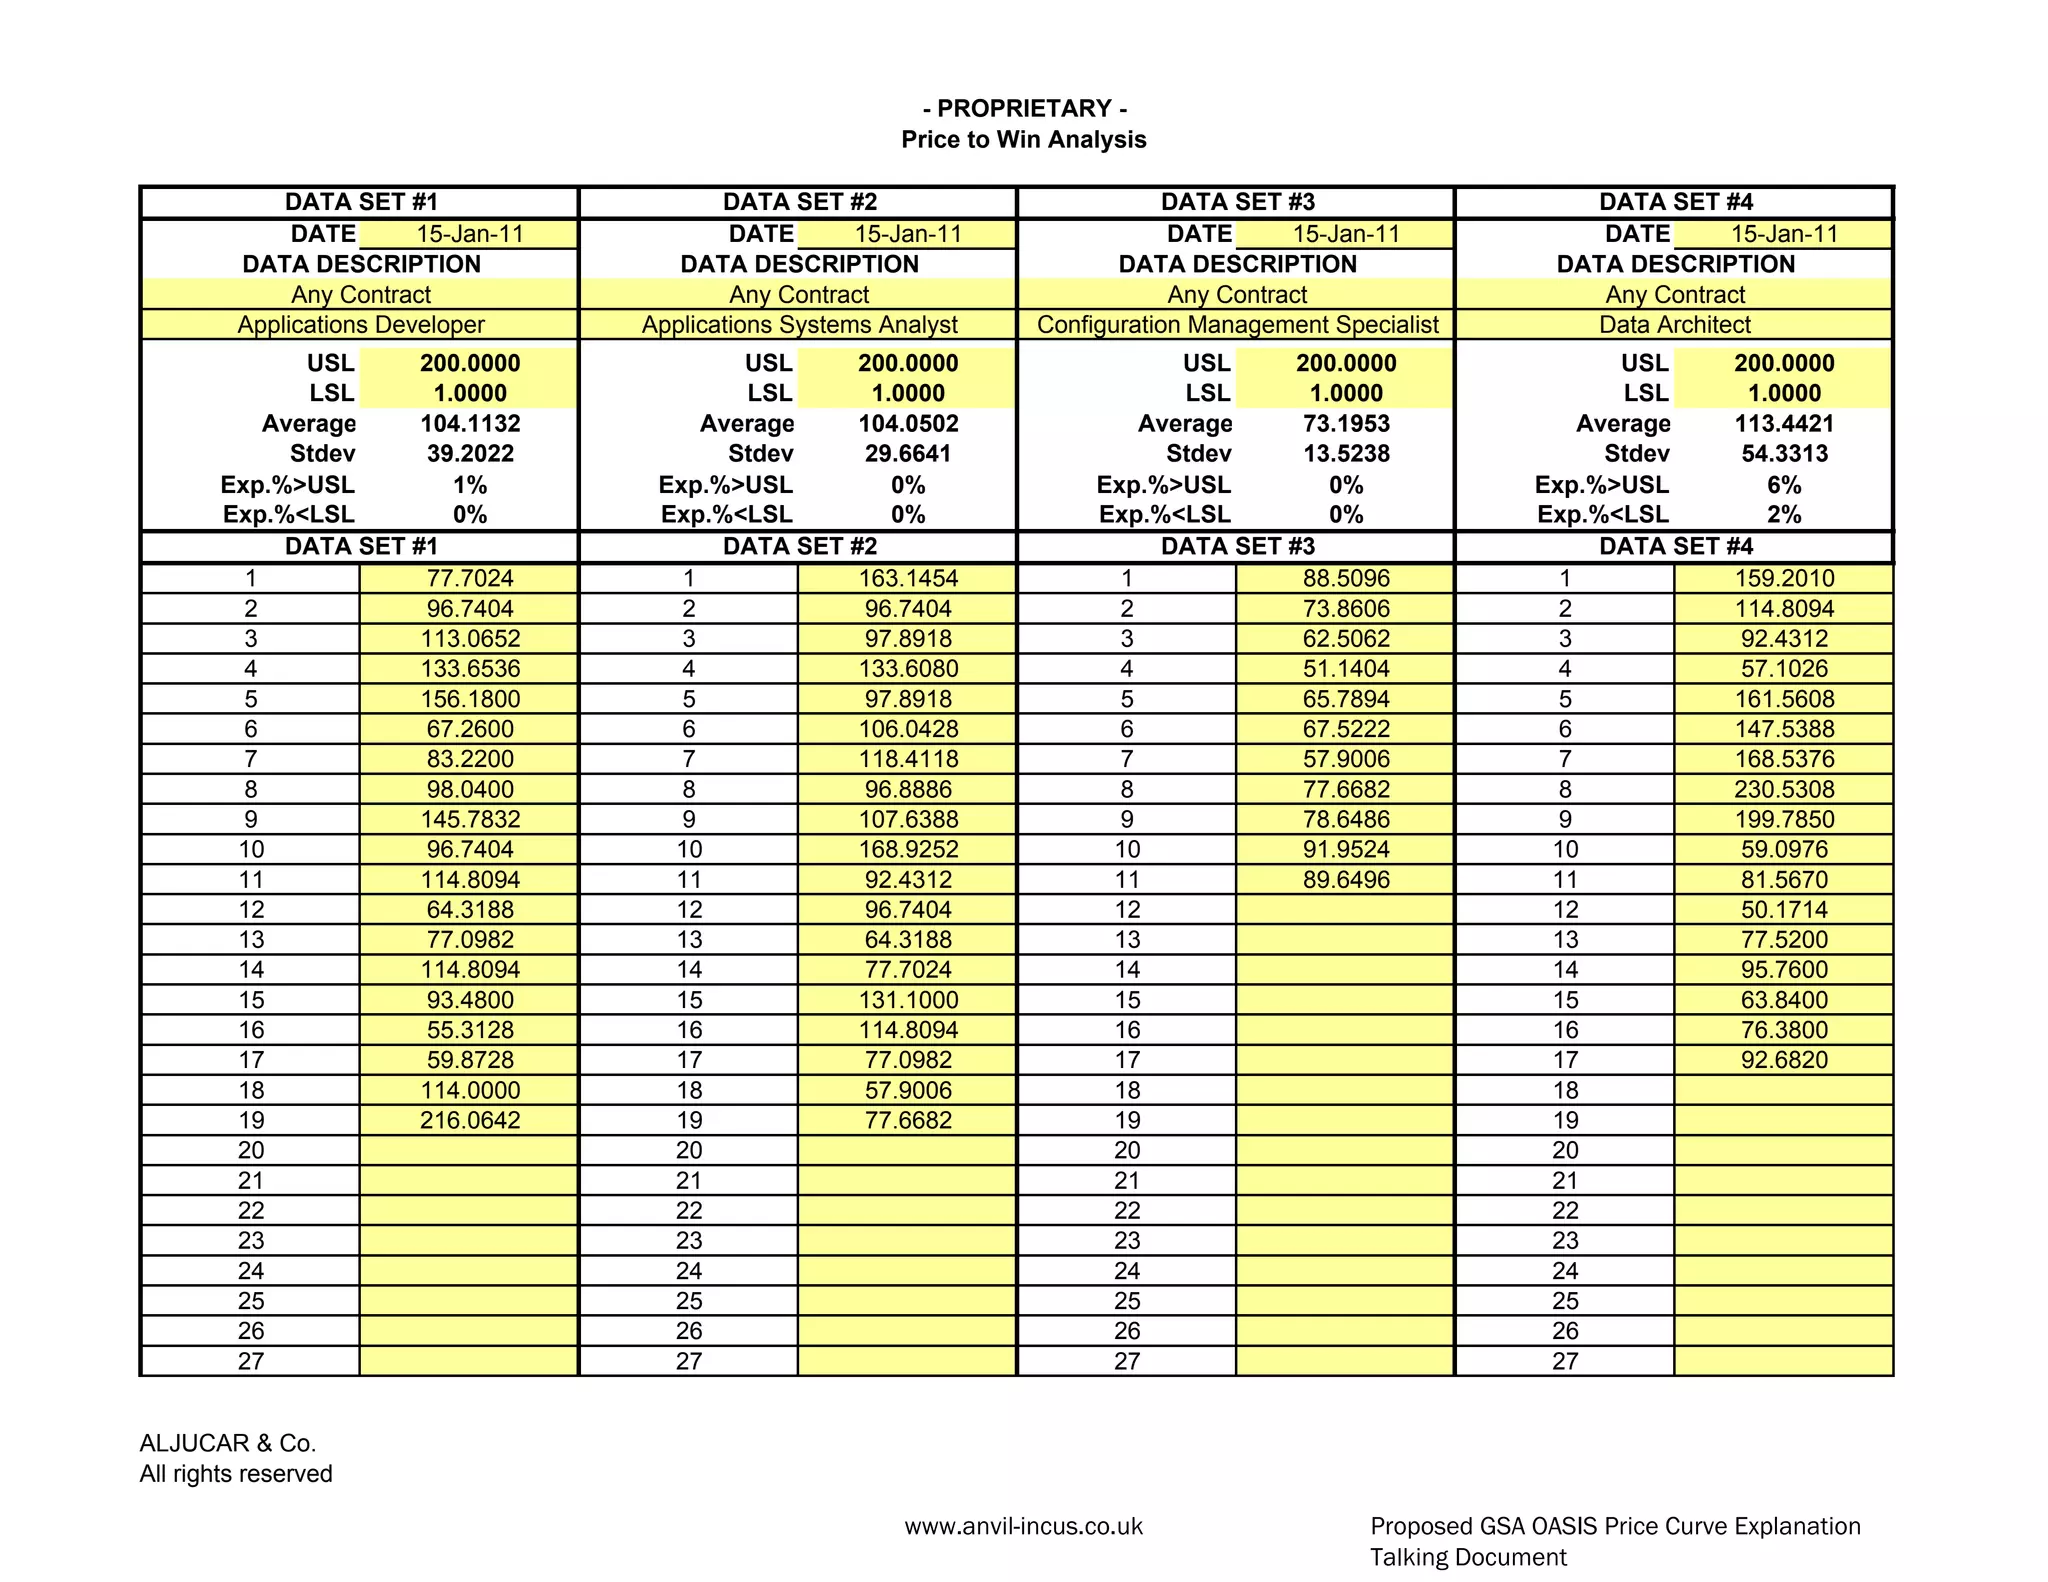
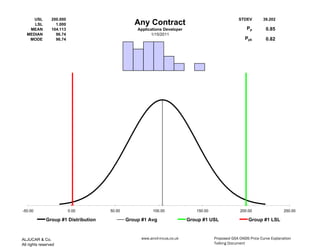
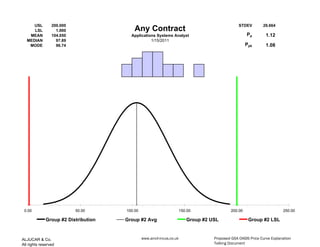
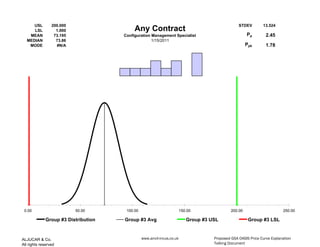
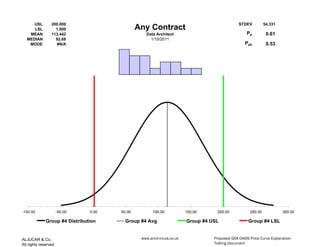
This is a very simple depiction of what Jim Ghiloni, the program executive officer for OASIS during the panel discussion Jan. 31, 2013 at the Strategic Sourcing Forum. I am not a fan of the PowerPoint brigade, but boy this was a good time for it. Anyway, this is a simple framework we shared with Jim and his team (after the event, sorry Jim) to assist with the explanation - and YES! our OASIS Teaming Exchange strategy includes this and many more models that simulate reality vs. theory for our Venturers.
The document contains two tables. The first table provides the compound interest factors (1 + i)^n for interest rates ranging from 1-10% and time periods of 1-20 years. The second table provides the present value and future value factors for a uniform series for interest rates of 1-10% and time periods of 1-20 years.
The document appears to contain numeric data organized into tables with 30 columns and 3 rows. The numbers range from approximately 50 to 150 with some values extending above and below that range. It is unclear what the numeric values represent or what the overall context is for the data presented.
The document appears to contain numeric data organized into 3 tables of 30 columns and 11 rows. It likely contains measurement or other quantitative data but does not provide enough context to determine what specifically is being measured.
This document contains a table of values for the standard normal cumulative distribution function φ(z) for z-values ranging from -3 to 2.7 in increments of 0.1. For each z-value, it provides the corresponding φ(z) value which represents the probability that a random variable from the standard normal distribution will be less than or equal to that z-value.
The document provides a market summary for the day including:
- Index levels for Sensex and Nifty which opened flat but closed marginally higher
- Top 5 gainers and losers by percentage
- Sectoral performance for the day
- Pivot levels for various stocks
- A technical analysis indicating the indices may test resistance levels if they trade above certain thresholds, and support levels if they fall
This document contains the test scores of 31 third grade students from SD Merak in three subjects: science, social studies, and math. Based on an ANOVA analysis, there were no statistically significant differences in average scores between the three subjects. Post hoc tests confirmed that all subject pairs were homogeneous subsets.
The market indices closed in positive territory led by gains in BPCL, STER, and GAIL. Most sectors also closed higher led by Consumer Durables. Technical indicators show the indices confirming a flag pattern breakout if levels of 17710/5320 are sustained. The document provides the day's key stock market levels and movements.
The technical report provides a daily market summary for the Indian markets. It shows that the key indices, Nifty and Sensex, closed slightly higher by 0.49% and 0.46% respectively. Top gainers were led by AMBUJACEM up 7.51% while top losers were led by RANBAXY down 2.78%. Sectoral performance was mixed with CG and IT sectors gaining while Realty sector lost 1.04%. The report provides support and resistance levels for the key indices and suggests they may test higher levels if trading remains above recent highs. Pivot point analysis is also included for various stocks.
The document provides a market summary for the day, including key indices levels, top gainers and losers, sectoral performance, and a technical analysis. Some key points:
- The Nifty and Sensex indices opened higher but gave up some gains to close slightly up.
- Metal and capital goods sectors performed best, while FMCG declined.
- Technically, the indices formed a "Shooting star" pattern, suggesting markets may correct if support levels are broken. Upside is limited unless resistance levels are crossed convincingly.
- Specific stocks are highlighted as having positive or negative bias over the next 2-3 days.
This document contains a table of cumulative probabilities for the standard normal distribution. It shows the probability that a random variable from the standard normal distribution will be less than or equal to different z-values. The table lists z-values from 0 to 5 in increments of 0.1 and the corresponding cumulative probabilities ranging from 0.5 to nearly 1. The table can be used to determine the probability that a standard normal random variable will be below a given z-value.
The document provides a technical market summary for 19/10/2010 including key indices levels, sector performances, top gainers and losers for the day. It notes that the indices opened marginally lower but buying emerged at lower levels, leading to a close in positive territory. IT sector and Reliance Industries led the bounce. The daily chart shows a bullish hammer candlestick pattern, suggesting the possibility of sideways movement if indices hold above support at 20 days EMA. Upside breakout of resistance levels could lead to further gains in coming sessions. Pivot points are also provided for various stocks.
The market summary provides an overview of the daily performance of key indices and sectors in the market. The Nifty and Sensex opened higher due to positive global cues and closed in the green. Top gainers were led by TATAMOTOR, M&M, and DLF, while top losers included TATASTEEL, WIPRO, and RELIANCE. Sectoral performance was mixed with realty and auto gaining while metal lost. The report also lists potential positive and negative stocks over the next 2-3 days and provides technical analysis suggesting the market may see upside if indices close above key resistance levels.
The technical report provides a daily market summary for the Indian market indices and sectors. It notes that the Nifty and Sensex indices opened higher and closed up over 1% for the day. Top gainers included Idea at 13.2% while top losers were Ambuja Cements down 1.55%. Most sectors were up over 1% with the exception of metals up 1.55%. The report concludes that the indices are poised to reach new 52-week highs if they can cross resistance levels of 18047/5400 and forecasts targets of 18500-18700/5500-5570. Pivot levels are provided for various stocks.
The technical report provides a summary of the Indian stock market indices and sector performances on September 13, 2010. It notes that the Nifty closed at 5640 and Sensex closed at 18800, up 0.57% and 0.71% respectively. Top gainers included M&M, HDFCBank, and SBIN, while top losers were POWERGRID, TATAMOTORS, and RELINFRA. The banking sector had gains of 2.19% while oil and gas saw losses of 0.27%. For the coming week, the report expects the indices to test resistance levels of 18900-19050 and 5700-5750. Key support levels are identified as 18440-18321 and
The markets opened on a positive note but closed lower as indices faced resistance at key levels. The Nifty closed down 0.80% at 6027 and Sensex closed down 0.92% at 19983. Among sectoral indices, IT and Realty declined the most while Healthcare rose. Cipla, Hero Honda, and BPCL gained the most while InfoSys, DLF, and Hindalco lost the most. The technical outlook is bearish if indices breach key support levels, while upside is limited by resistance levels. Pivot points are provided for 50 stocks.
The document provides a technical market summary for July 26, 2010. It includes key indices levels, top gainers and losers for the day, sectoral performance, a chart analysis indicating an expectation of further upside momentum, and pivot point levels for various stocks. Traders are advised to trail stop losses and maintain a positive bias as long as support levels hold.
The document describes using INDEX and MATCH formulas to retrieve data from a pivot table and populate it into a flat table. INDEX returns a value from a reference table using row and column numbers. MATCH returns the position of a value within a range which can then be used as the row or column number in INDEX. This allows data to be pulled from the pivot table into the flat table dynamically.
Analysis of the Drivers of Landcover and Landuse Change in Western Kenya over...World Agroforestry (ICRAF)
This document discusses analyzing the drivers of landcover and landuse change in western Kenya over the last 30 years. The objectives are to develop robust measures of landuse/landcover change and identify potential drivers. Quickbird imagery is being used to inventory agroforestry components and efficiently select sentinel landscapes and sites. Georeferenced 1983 aerial photos are being used along with recent climate data to quantify system dynamics over time for future monitoring. Challenges include estimating locations of ungeoreferenced samples and comparing remote sensing platforms. Preliminary results will be reported along with requirements for further study of the entire area.
The key points from the technical report are:
1. Indian stock indices closed lower, with the Sensex falling 1.11% and the Nifty down 1.07%, amid profit booking in the final hour of trade.
2. On daily charts, the high of 20,707/6,222 for the Sensex/Nifty respectively is acting as strong resistance, with support seen at 20,290-20,189/6,094-6,063.
3. The real estate, metal and information technology sectors underperformed, falling 2.8%, 1.7% and 1.3% respectively.
The key points from the market summary document are:
- Indian stock indices Sensex and Nifty closed higher on the day, up 0.88% and 0.79% respectively, led by gains in sectors like oil & gas and auto.
- Top gainers during the day were LT, JPAssociate and Tata Motors, while top losers were Hero Honda, Hindustan Unilever and PNB.
- The markets opened flat but saw a minor correction and regained momentum in the second half of the session to close at higher levels.
- Traders are advised to book partial profits near key resistance levels of 17650-17826 for Sensex and 5300-53
SPICE MODEL of LR6AG_RL=10(Ohm) in SPICE PARK. English Version is http://www.spicepark.net. Japanese Version is http://www.spicepark.com by Bee Technologies.
The document provides a summary of the Indian stock market indices and sector performances on 07/09/2010. It notes that both the Nifty and Sensex opened with an upside gap and reached new 52-week highs, led by gains in Reliance Industries, metal and banking stocks. The top gainers were TATASTEEL, HINDALCO, and STER, while the top losers were HEROHONDA, BPCL, and HINDUNILVR. The metal, banking, and oil & gas sectors saw gains over 1%, while IT saw gains of 1.88%. Pivot levels and positive/negative biased stocks are also listed.
The document provides a technical market summary for 13 July 2010. It includes key indices levels, top gainers and losers, sectoral performance, and a outlook. The Nifty and Sensex opened at 5352 and 17876 respectively and rose to highs of 5403 and 18010 during the day. The report expects the indices to test higher levels of 5450-5475 and 18120-18200 if they close convincingly above 5400 and 18000. Key stocks trends and pivot levels are also included.
The summary provides an overview of the key information from the technical report on the stock market:
- The indices closed lower, with the Nifty down 0.91% and Sensex down 0.92%, after opening higher but being unable to sustain gains. Support levels of 20400-20250 and 6150-6100 and resistance at 20855 and 6284 are identified.
- SESAGOA gained the most at 4.15% while BPCL lost the most at 5.19%. The top sector gainers were CG and OIL&GAS, while the top losers were POWER and PSU.
- Pivot points are provided for the key indices and stocks to identify support and
The market indices closed slightly higher, with the Nifty up 1.07% and Sensex up 0.95%. IDFC and Idea were the top gainers, rising over 4% each, while Bharti Airtel and Gail declined over 1% each. Most sectors closed in positive territory, with FMCG and oil & gas rising around 2% and 1.6% respectively. The document provides analysis of index movements and support levels, lists the day's top gainers and losers, and gives sector performance and pivot table values for various stocks.
The document provides financial information for a proposed toll road project including:
- The net present value (NPV) is ($456.70) and internal rate of return (IRR) is 10.38%
- Construction costs are estimated at Rs. 960 crore for 80% of the initial Rs. 1200 crore budget and land acquisition costs are Rs. 240 crore
- Annual maintenance costs are estimated at 0.9% of the total construction cost of Rs. 1500 crore
- Toll revenue is projected to grow at 7% annually reaching over Rs. 1400 crore by 2026
The document appears to be an annual report that provides financial and operational data for a gold mining company over multiple years. It includes statistics on production volumes, revenue, costs, assets, investments, and performance across different mining sites. Key figures presented include total revenue, assets, production volumes, costs, profits, and performance metrics for different periods.
The document contains statistical data such as sums, averages, and variances for a dataset of numbers. It also includes a loan amortization schedule showing the breakdown of principal, interest, and payment amounts over time. Finally, it lists notes and grades for students in a course.
This document provides the rates for various mail classes including First-Class Mail, Express Mail, Periodicals, and Standard Mail effective June 30, 2002. The rates are broken down by mail format, weight, and level of presorting/automation. First-Class Mail rates range from $0.37 to $3.13 depending on weight and level of presorting. Express Mail rates are listed by weight in 1-pound increments up to 70 pounds. Periodicals rates include pound rates and piece rates that vary by zone and level of presorting. Standard Mail rates are provided for regular and carrier route mail by presort level and automation discounts.
The document describes a linear function with an equation of y=2x+20. It provides x and y value pairs that define the linear relationship. It also includes the constants for the equation: slope (K) of 2, y-intercept (D) of 0, and constants (E) of 20, (F) of -10, and (G) of -4. It then generates y values for a range of x values from -4 to 4 using the linear equation.
This document contains tables and information about quantitative techniques including:
1) An area under the normal curve table that provides the proportion of the normal curve between values of z.
2) A binomial coefficients table that lists coefficients for values up to 20.
3) A table of values of the Poisson probability function for values of m from 0 to 9.
The document lists standard resistor and capacitor values. For resistors, it provides 1%, 5%, and 10% tolerance values ranging from 10 ohms to 2.2 megohms. For capacitors, it lists values from 1 picofarad to 9100 microfarads. Both components have decade increments, with resistors having more options in the megohm range and capacitors having picofarad, nanofarad, microfarad, and millifarad values.
The document contains the key answers to questions from competitive examinations for a lecturer position in pre-university education. It lists the application number, name, and date of birth of the candidate, along with the question booklet numbers and key answers for questions across 5 subjects - Commerce Papers I and II, Compulsory Kannada, and two other subjects. The key includes the question numbers and correct answer for each of the 150 questions in each subject.
The market summary provides an overview of the day's trading activity in the Indian stock market. Key indices like Nifty and Sensex opened flat but declined through the day, closing down 0.69% and 0.71% respectively. Top gainers were BPCL, Ranbaxy, and ITC, while top losers were HCLTech, ACC, and JPAssociates. Most sectors closed in the red, with metals and IT among the biggest decliners. The report analyzes technical indicators and concludes the market may see further consolidation or minor corrections if key support levels are broken, while upside potential remains if resistance levels are crossed.
The market summary provides an overview of the day's trading activity in the Indian stock market. Key indices like Nifty and Sensex opened flat but declined through the day, closing down 0.69% and 0.71% respectively. Top gainers were led by BPCL at 4.73% gain, while top losers were led by HCLTECH at 2.72% loss. Metals and IT sectors underperformed, falling 1.9% and 1.24% respectively. The report analyzes technical indicators and suggests the market may see further consolidation or minor correction if key support levels are broken.
1.2 motor trouble shooting slideshare uploadGan Saik Ngai
This document provides performance data and specifications for 3-phase induction motors from TECO Motors ranging from 1/4 HP to 250 HP. It includes tables showing efficiency, power factor, speed, torque, and current draw ratings. It also covers standards, protection classes, insulation classes, duty cycles, output power corrections based on ambient temperature and altitude, voltage, mounting types, bearing types, terminal boxes, housing materials, fans, and optional features like overtemperature protection and anti-condensation heaters.
- The key Indian stock market indices, Nifty and Sensex, saw minor declines of 0.23% and 0.26% respectively at market close. The top gainers were IDFC, HINDUNILVR, and HEROHONDA, while the top losers were RELCAPITAL, RPOWER, and RCOM. Most sectors saw declines with the exception of the consumer goods sector, which saw a gain of 0.62%.
- In the coming week, markets are expected to see volatility due to upcoming derivative contract expiries. Technical indicators suggest the possibility of a minor pullback after recent gains. Support levels for the indices are seen at 17,278-17,141 for Sensex and 5
The document provides a market summary for May 7, 2010 including:
1) Key indices like Nifty and Sensex opened lower but closed slightly down.
2) Top gainers and losers among stocks.
3) Sectoral performances with CG and Metal losing the most.
4) A view is provided that indices may trade in a range of 17000-17920/5100-5366 in the coming week.
The market indices opened on a positive note but traded in a narrow range and closed with marginal gains. Top gainers were M&M, TATAMOTOR, RELCAPITAL, STER and HDFC, while top losers were SAIL, AXISBANK, RPOWER, ACC and IDFC. Auto and IT sectors saw gains while metal and banking sectors saw losses. Momentum was seen on the upside once key resistance levels were crossed, while support levels were identified for downside movement. Specific stocks were highlighted as positive and negative biased over the next 2-3 days.
The document provides a market summary for March 26, 2010 including:
1) Key indices like Nifty and Sensex opened subdued but gained momentum to close near daily highs.
2) Top gainers and losers among stocks, with sectors like capital goods and healthcare gaining and PSU losing.
3) Analysis that the coming session is likely to see positive trading if indices sustain above key levels, and identifies potential support levels.
The market indices closed near their daily highs, with the Nifty up 1.22% and Sensex up 1.14%. The top gainers were RCOM (+4.65%), RELINFRA (+4.47%), and TATAPOWER (+3.75%), while the top losers were GAIL (-2.52%), ITC (-1.36%), and ABB (-1.30%). Most sectors closed in positive territory, led by the consumer discretionary sector (+2.83%). The technical analysis indicates the markets may test higher resistance levels of 17920-18040/5370-5400 if gains continue above 17800/5340 support levels.
The key points from the market summary document are:
- Indian stock indices (Nifty and Sensex) opened on a positive note but failed to sustain gains, closing near the day's low levels.
- Real estate was the top performing sector, up 1.59%, while oil & gas saw the largest losses of 1.83%.
- JP Power, Dr. Reddy's, and Titan were the top gaining stocks, while LIC Housing Fin, Rolta, and Essar Oil lost the most value.
- The coming trading sessions are expected to see the markets trade in a narrow range, and any dip below 5250 could signal the start of a downtrend in weekly charts.
The market indices opened marginally lower but closed higher. Top gainers were Maruti, Unitech and Sun Pharma, while top losers were LT, HCL Tech and Sterlite. The realty and healthcare sectors saw gains while capital goods saw losses. Stocks like Maruti and Essar Oil are positively biased for the next 2-3 days, while technical indicators suggest the market may consolidate at current levels or see a slight decline. Pivot points are provided for various stocks.
The document shows charts tracking the growth of e-commerce sales in China from 1997 to 2009, with sales increasing from 1.2 billion RMB in 1997 to over 9,000 billion RMB in 2009. A second chart shows the transaction value of China's B2C e-commerce growing from 1.52 billion RMB in 2006 to 2.46 billion RMB in 2010. A third chart breaks down China's e-commerce market by business model in 2010, with B2B accounting for 32% and B2C making up 47.5%.
1) The document discusses the introduction and spread of Spartina alterniflora, a cordgrass species native to eastern North America, in China between 1979 and 1999.
2) It notes that S. alterniflora was first introduced to China in 1979 and had spread to cover over 70,000 hectares by 1999 across different coastal provinces.
3) Data shows that the rate of spread increased significantly in the early 1990s, with over 300,000 hectares covered by 1992, and discusses the ecological impacts and control measures implemented.
Similar to AA-I & Co. | Simple labor-category Price Curve Model (20)
SATTA MATKA SATTA FAST RESULT KALYAN TOP MATKA RESULT KALYAN SATTA MATKA FAST RESULT MILAN RATAN RAJDHANI MAIN BAZAR MATKA FAST TIPS RESULT MATKA CHART JODI CHART PANEL CHART FREE FIX GAME SATTAMATKA ! MATKA MOBI SATTA 143 spboss.in TOP NO1 RESULT FULL RATE MATKA ONLINE GAME PLAY BY APP SPBOSS
The Genesis of BriansClub.cm Famous Dark WEb PlatformSabaaSudozai
BriansClub.cm, a famous platform on the dark web, has become one of the most infamous carding marketplaces, specializing in the sale of stolen credit card data.
Storytelling is an incredibly valuable tool to share data and information. To get the most impact from stories there are a number of key ingredients. These are based on science and human nature. Using these elements in a story you can deliver information impactfully, ensure action and drive change.
[To download this presentation, visit:
https://www.oeconsulting.com.sg/training-presentations]
This PowerPoint compilation offers a comprehensive overview of 20 leading innovation management frameworks and methodologies, selected for their broad applicability across various industries and organizational contexts. These frameworks are valuable resources for a wide range of users, including business professionals, educators, and consultants.
Each framework is presented with visually engaging diagrams and templates, ensuring the content is both informative and appealing. While this compilation is thorough, please note that the slides are intended as supplementary resources and may not be sufficient for standalone instructional purposes.
This compilation is ideal for anyone looking to enhance their understanding of innovation management and drive meaningful change within their organization. Whether you aim to improve product development processes, enhance customer experiences, or drive digital transformation, these frameworks offer valuable insights and tools to help you achieve your goals.
INCLUDED FRAMEWORKS/MODELS:
1. Stanford’s Design Thinking
2. IDEO’s Human-Centered Design
3. Strategyzer’s Business Model Innovation
4. Lean Startup Methodology
5. Agile Innovation Framework
6. Doblin’s Ten Types of Innovation
7. McKinsey’s Three Horizons of Growth
8. Customer Journey Map
9. Christensen’s Disruptive Innovation Theory
10. Blue Ocean Strategy
11. Strategyn’s Jobs-To-Be-Done (JTBD) Framework with Job Map
12. Design Sprint Framework
13. The Double Diamond
14. Lean Six Sigma DMAIC
15. TRIZ Problem-Solving Framework
16. Edward de Bono’s Six Thinking Hats
17. Stage-Gate Model
18. Toyota’s Six Steps of Kaizen
19. Microsoft’s Digital Transformation Framework
20. Design for Six Sigma (DFSS)
To download this presentation, visit:
https://www.oeconsulting.com.sg/training-presentations
How are Lilac French Bulldogs Beauty Charming the World and Capturing Hearts....Lacey Max
“After being the most listed dog breed in the United States for 31
years in a row, the Labrador Retriever has dropped to second place
in the American Kennel Club's annual survey of the country's most
popular canines. The French Bulldog is the new top dog in the
United States as of 2022. The stylish puppy has ascended the
rankings in rapid time despite having health concerns and limited
color choices.”
Brian Fitzsimmons on the Business Strategy and Content Flywheel of Barstool S...Neil Horowitz
On episode 272 of the Digital and Social Media Sports Podcast, Neil chatted with Brian Fitzsimmons, Director of Licensing and Business Development for Barstool Sports.
What follows is a collection of snippets from the podcast. To hear the full interview and more, check out the podcast on all podcast platforms and at www.dsmsports.net
Unveiling the Dynamic Personalities, Key Dates, and Horoscope Insights: Gemin...my Pandit
Explore the fascinating world of the Gemini Zodiac Sign. Discover the unique personality traits, key dates, and horoscope insights of Gemini individuals. Learn how their sociable, communicative nature and boundless curiosity make them the dynamic explorers of the zodiac. Dive into the duality of the Gemini sign and understand their intellectual and adventurous spirit.
HOW TO START UP A COMPANY A STEP-BY-STEP GUIDE.pdf46adnanshahzad
How to Start Up a Company: A Step-by-Step Guide Starting a company is an exciting adventure that combines creativity, strategy, and hard work. It can seem overwhelming at first, but with the right guidance, anyone can transform a great idea into a successful business. Let's dive into how to start up a company, from the initial spark of an idea to securing funding and launching your startup.
Introduction
Have you ever dreamed of turning your innovative idea into a thriving business? Starting a company involves numerous steps and decisions, but don't worry—we're here to help. Whether you're exploring how to start a startup company or wondering how to start up a small business, this guide will walk you through the process, step by step.
Building Your Employer Brand with Social MediaLuanWise
Presented at The Global HR Summit, 6th June 2024
In this keynote, Luan Wise will provide invaluable insights to elevate your employer brand on social media platforms including LinkedIn, Facebook, Instagram, X (formerly Twitter) and TikTok. You'll learn how compelling content can authentically showcase your company culture, values, and employee experiences to support your talent acquisition and retention objectives. Additionally, you'll understand the power of employee advocacy to amplify reach and engagement – helping to position your organization as an employer of choice in today's competitive talent landscape.
Top mailing list providers in the USA.pptxJeremyPeirce1
Discover the top mailing list providers in the USA, offering targeted lists, segmentation, and analytics to optimize your marketing campaigns and drive engagement.
How to Implement a Strategy: Transform Your Strategy with BSC Designer's Comp...Aleksey Savkin
The Strategy Implementation System offers a structured approach to translating stakeholder needs into actionable strategies using high-level and low-level scorecards. It involves stakeholder analysis, strategy decomposition, adoption of strategic frameworks like Balanced Scorecard or OKR, and alignment of goals, initiatives, and KPIs.
Key Components:
- Stakeholder Analysis
- Strategy Decomposition
- Adoption of Business Frameworks
- Goal Setting
- Initiatives and Action Plans
- KPIs and Performance Metrics
- Learning and Adaptation
- Alignment and Cascading of Scorecards
Benefits:
- Systematic strategy formulation and execution.
- Framework flexibility and automation.
- Enhanced alignment and strategic focus across the organization.
B2B payments are rapidly changing. Find out the 5 key questions you need to be asking yourself to be sure you are mastering B2B payments today. Learn more at www.BlueSnap.com.
Digital Marketing with a Focus on Sustainabilitysssourabhsharma
Digital Marketing best practices including influencer marketing, content creators, and omnichannel marketing for Sustainable Brands at the Sustainable Cosmetics Summit 2024 in New York