This document presents a deep learning approach for brain tumor detection using Magnetic Resonance Imaging (MRI), employing a modified Convolutional Neural Network (CNN) architecture with high accuracy rates of 98.6% and a precision score of 97.8%. The proposed model outperforms existing methods through automatic feature extraction and enhanced image processing techniques, addressing the challenges of manual diagnosis and segmentation. The study emphasizes the importance of accurate early detection in improving patient survival rates and details the methodologies for training and validating the model.
![International Journal of Electrical and Computer Engineering (IJECE)
Vol. 13, No. 1, February 2023, pp. 1039~1047
ISSN: 2088-8708, DOI: 10.11591/ijece.v13i1.pp1039-1047 1039
Journal homepage: http://ijece.iaescore.com
A deep learning approach for brain tumor detection using
magnetic resonance imaging
Al-Akhir Nayan1
, Ahamad Nokib Mozumder2
, Md. Rakibul Haque2
, Fahim Hossain Sifat3
,
Khan Raqib Mahmud3
, Abul Kalam Al Azad3
, Muhammad Golam Kibria3
1
Department of Computer Engineering, Faculty of Engineering, Chulalongkorn University, Bangkok, Thailand
2
Department of Computer Science and Engineering, Faculty of Sciences and Engineering, European University of Bangladesh,
Dhaka, Bangladesh
3
Department of Computer Science and Engineering, School of Science and Engineering, University of Liberal Arts Bangladesh,
Dhaka, Bangladesh
Article Info ABSTRACT
Article history:
Received Feb 7, 2022
Revised Jul 14, 2022
Accepted Aug 10, 2022
The growth of abnormal cells in the brain’s tissue causes brain tumors. Brain
tumors are considered one of the most dangerous disorders in children and
adults. It develops quickly, and the patient’s survival prospects are slim if
not appropriately treated. Proper treatment planning and precise diagnoses
are essential to improving a patient’s life expectancy. Brain tumors are
mainly diagnosed using magnetic resonance imaging (MRI). As part of a
convolution neural network (CNN)-based illustration, an architecture
containing five convolution layers, five max-pooling layers, a Flatten layer,
and two dense layers has been proposed for detecting brain tumors from
MRI images. The proposed model includes an automatic feature extractor,
modified hidden layer architecture, and activation function. Several test cases
were performed, and the proposed model achieved 98.6% accuracy and
97.8% precision score with a low cross-entropy rate. Compared with other
approaches such as adjacent feature propagation network (AFPNet), mask
region-based CNN (mask RCNN), YOLOv5, and Fourier CNN (FCNN), the
proposed model has performed better in detecting brain tumors.
Keywords:
Brain tumor
Tumor detection
Tumor segmentation
Deep learning
Magnetic resonance imaging
This is an open access article under the CC BY-SA license.
Corresponding Author:
Al-Akhir Nayan
Department of Computer Engineering, Faculty of Engineering, Chulalongkorn University
Bangkok, Thailand
Email: asquiren@gmail.com
1. INTRODUCTION
The human body is made of millions of cells, and the brain is an essential part of the human body. A
brain tumor is caused by abnormal cells in the brain’s tissue. It is considered one of the world’s deadliest
diseases [1], [2] due to its escalating impact and fatality rate in all age categories. It is India’s second-leading
cause of cancer [3]. According to the American Cancer Society’s most recent report, around 24,000 people in
the United States were infected with brain tumors in 2020, with an estimated 19,000 deaths due to the
increased use of technology such as cell phones and tablets [4], [5]. Approximately 120 varieties of tumors
have been discovered too far, and they all arise in various shapes and sizes, making diagnosis more
challenging [6]–[8]. Medical imaging modalities like positron emission tomography (PET), computed
tomography (CT), magnetic resonance imaging (MRI), and magnetoencephalography (MEG) have been
utilized to diagnose brain irregularities for a long time [9], [10]. The MRI multimodality imaging technique is
the most common and efficient technology routinely used to diagnose brain tumors because of its capacity to
distinguish between structure and tissue based on contrast levels [11], [12]. MRI anomaly detection is now](https://image.slidesharecdn.com/v9927388lemr14jul227feb22nn-221124062035-c2071421/75/A-deep-learning-approach-for-brain-tumor-detection-using-magnetic-resonance-imaging-1-2048.jpg)
![ ISSN: 2088-8708
Int J Elec & Comp Eng, Vol. 13, No. 1, February 2023: 1039-1047
1040
primarily manual, and doctors must spend significant time discovering and segmenting the tumor for therapy
and surgery [13], [14]. This manual procedure is also prone to errors and can endanger one’s life.
Researchers have begun to examine various machine learning and deep learning techniques for computer-
based tumor diagnosis and segmentation to address these challenges.
Deep learning is a machine learning subfield widely used to develop a semi-automatic, automatic, or
hybrid model to detect and segment tumors in less time [15]. Radiologists can make a more accurate
prognosis and increase the odds of long-term survival if a brain tumor is discovered early [10]. The tumor’s
shifting appearance, position, form, and size [16] remains a complex process. There has already been a lot of
work done to assist doctors, patients, and researchers. Many computers aided diagnostic (CAD) systems have
been created to detect and classify brain anomalies [17] automatically, but they still perform with poor
accuracy [18]. Several articles have been published without highlighting the flaws in previous work or
providing any significant insight into future directions. Interoperability is lacking in most hybrid models,
while gradient vanishing is a concern in deep learning models. Similarly, there is a lack of uniformity in data
preprocessing.
This article aims to process the images from MRI and detect tumors in the brain by solving previous
issues. Image enhancement, rebuilding, and estimation extraction techniques have been applied to enhance
image quality while preparing the dataset. The image digitization process and picture upgrade techniques
handle defective images. A modified CNN has been applied to take an MRI scan image of the brain as input,
detect the tumor, and give the result as output. The network contains five convolution layers, five
max-pooling layers, a Flatten layer, multiple hidden layers, and two dense layers. A modified recto-triangular
architecture has been utilized in the hidden layer that enhances the probability distribution. The model’s
accuracy has been evaluated and compared with state-of-the-art techniques. The model has performed better
than other approaches in detecting brain tumors from MRI images.
2. RELATED WORKS
Image detection plays a crucial role in analyzing brain tumors using MRI images. Many methods for
detecting brain tumors from MRI images have been proposed. In the method presented by Kumar et al. [19],
brain tumors were predicted using a fully convolutional neural network (FCN) from MRI images.
Derikvand et al. [20] presented an approach based on neural convolution. The method used glioma
brain tumor detection networks in MR imaging. The proposed process was a hybrid, multiple CNN
architectures using local and global brain tissue knowledge to predict each pixel’s label, improving results.
CNN was used for image segmentation and detection by Hemanth et al. [21]. It explicitly pulled
features from images with the least amount of preprocessing. LinkNet was employed. The architecture of a
neural network was designed to conduct semantic segmentation and detection. The LinkNet network blocks
of encoders and decoders were responsible for breaking and rebuilding the image until it was routed through
a few final levels of convolution. root mean square error (RMSE), recall, sensitivity, precision, F-score
specificity, and percentage mean error (PME) evaluated the suggested CNN’s performance.
Hossain’s methodology [22] began with the input image’s skull striping, which removed the skull
part from the MRI images. The fuzzy C-means clustering algorithm was used to detect the filtered image.
Texture-based and statistical-based features were extracted from the images. The extracted features were fed
into a CNN model. The model’s accuracy for brain tumor prediction was high, but the computational time
was much longer than other models.
Minz et al. [23] proposed one method that extracted characteristics using the gray level co-occurrence
matrix methodology. An image’s texture was defined by calculating specified spatial relationships that
appeared in an image. Gray level co-occurrence matrix was built, and this matrix extracted statistical
measurements. The classification was done with the AdaBoost classifier, and the proposed system attained an
accuracy of 89.90%.
Gurbin et al. [24] proposed a method using discrete wavelet transform levels (DWT) and continuous
wavelet transform levels (CWT). Support vector machines (SVM) were utilized to identify benign,
malignant, or healthy brains. The research suggested that CWT performs better than DWT in computation.
Chander et al. [25] proposed a strategy to detect afflicted brain tissues using the grade 4 gradient
boosting machine (GBM). The retrieved properties of Bayesian naive were used to classify them. This
method yielded an accuracy of 83.33%. The MRI image was initially fed into the algorithm, which filtered it
to smooth it out and remove noise. The next step was to mask the filtered image to remove brain tissues from
the skull. Finally, the acquired features were sent into an SVM classifier, which determined whether the
image was malignant or not.
After examining many algorithms for detecting brain tumors, we found that most algorithms
required a long computational time, while cheap computational time methods could not provide greater](https://image.slidesharecdn.com/v9927388lemr14jul227feb22nn-221124062035-c2071421/75/A-deep-learning-approach-for-brain-tumor-detection-using-magnetic-resonance-imaging-2-2048.jpg)
![Int J Elec & Comp Eng ISSN: 2088-8708
A deep learning approach for brain tumor detection using magnetic resonance imaging (Al-Akhir Nayan)
1041
accuracy. Every classifier requires rectifying the predecessor’s flaws, and boosting is sensitive to outliers. As
a result, the technique is overly reliant on outliers. Another downside is that scaling up the process is nearly
impossible because each estimator is based on the accuracy of preceding predictors. As a result, we intended
to propose an approach that could provide excellent accuracy.
3. BRAIN TUMOR DETECTION PROCESS
3.1. Data collection
A dataset containing 30,000 images was collected to train the deep learning model. The dataset
contained two classes: fresh MRI images of the brain and the images with a brain tumor. The collected data
contains 15,000 images of healthy brains and 15,000 images of brain tumors. For testing the dataset, related
images were collected from Google. There are 4,400 brain images that were taken without a tumor, and
3,200 images were taken with a tumor. A small part of the collected images is shown in Figure 1. For
comparison purpose, the BRATS datasets [26] (BRATS_2018, BRATS_2019, BRATS_2020) were utilized.
Figure 1. A part of collected images
3.2. Data preprocessing
The preprocessing step aims to increase picture quality, data cleansing, and contrast-enhancing. The
median filter filters out the noise and retrieves valuable data. Median filtering is a nonlinear approach used to
retain sharp features in MRI images. In this work, an MRI image was preprocessed by converting the picture
to greyscale and using a 33 median filter to eliminate noise, which enhanced image quality using (1).
𝑓(𝑥, 𝑦) = 𝑚𝑒𝑑𝑖𝑎𝑛(𝑠,𝑡)𝑒𝑆𝑥𝑦{𝑔(𝑠, 𝑡)} (1)
A high pass filter was used to locate edges in the acquired MRI image. The edge-identified MRI
image was combined with the original image to obtain the enhanced image. The dataset was enlarged using
the data augmentation process to keep a strategic distance from overfitting. The dataset was augmented using
four distinct tactics: rotate left -90 degrees, rotate left -180 degrees, rotate left -270 degree, and flip every
image once.
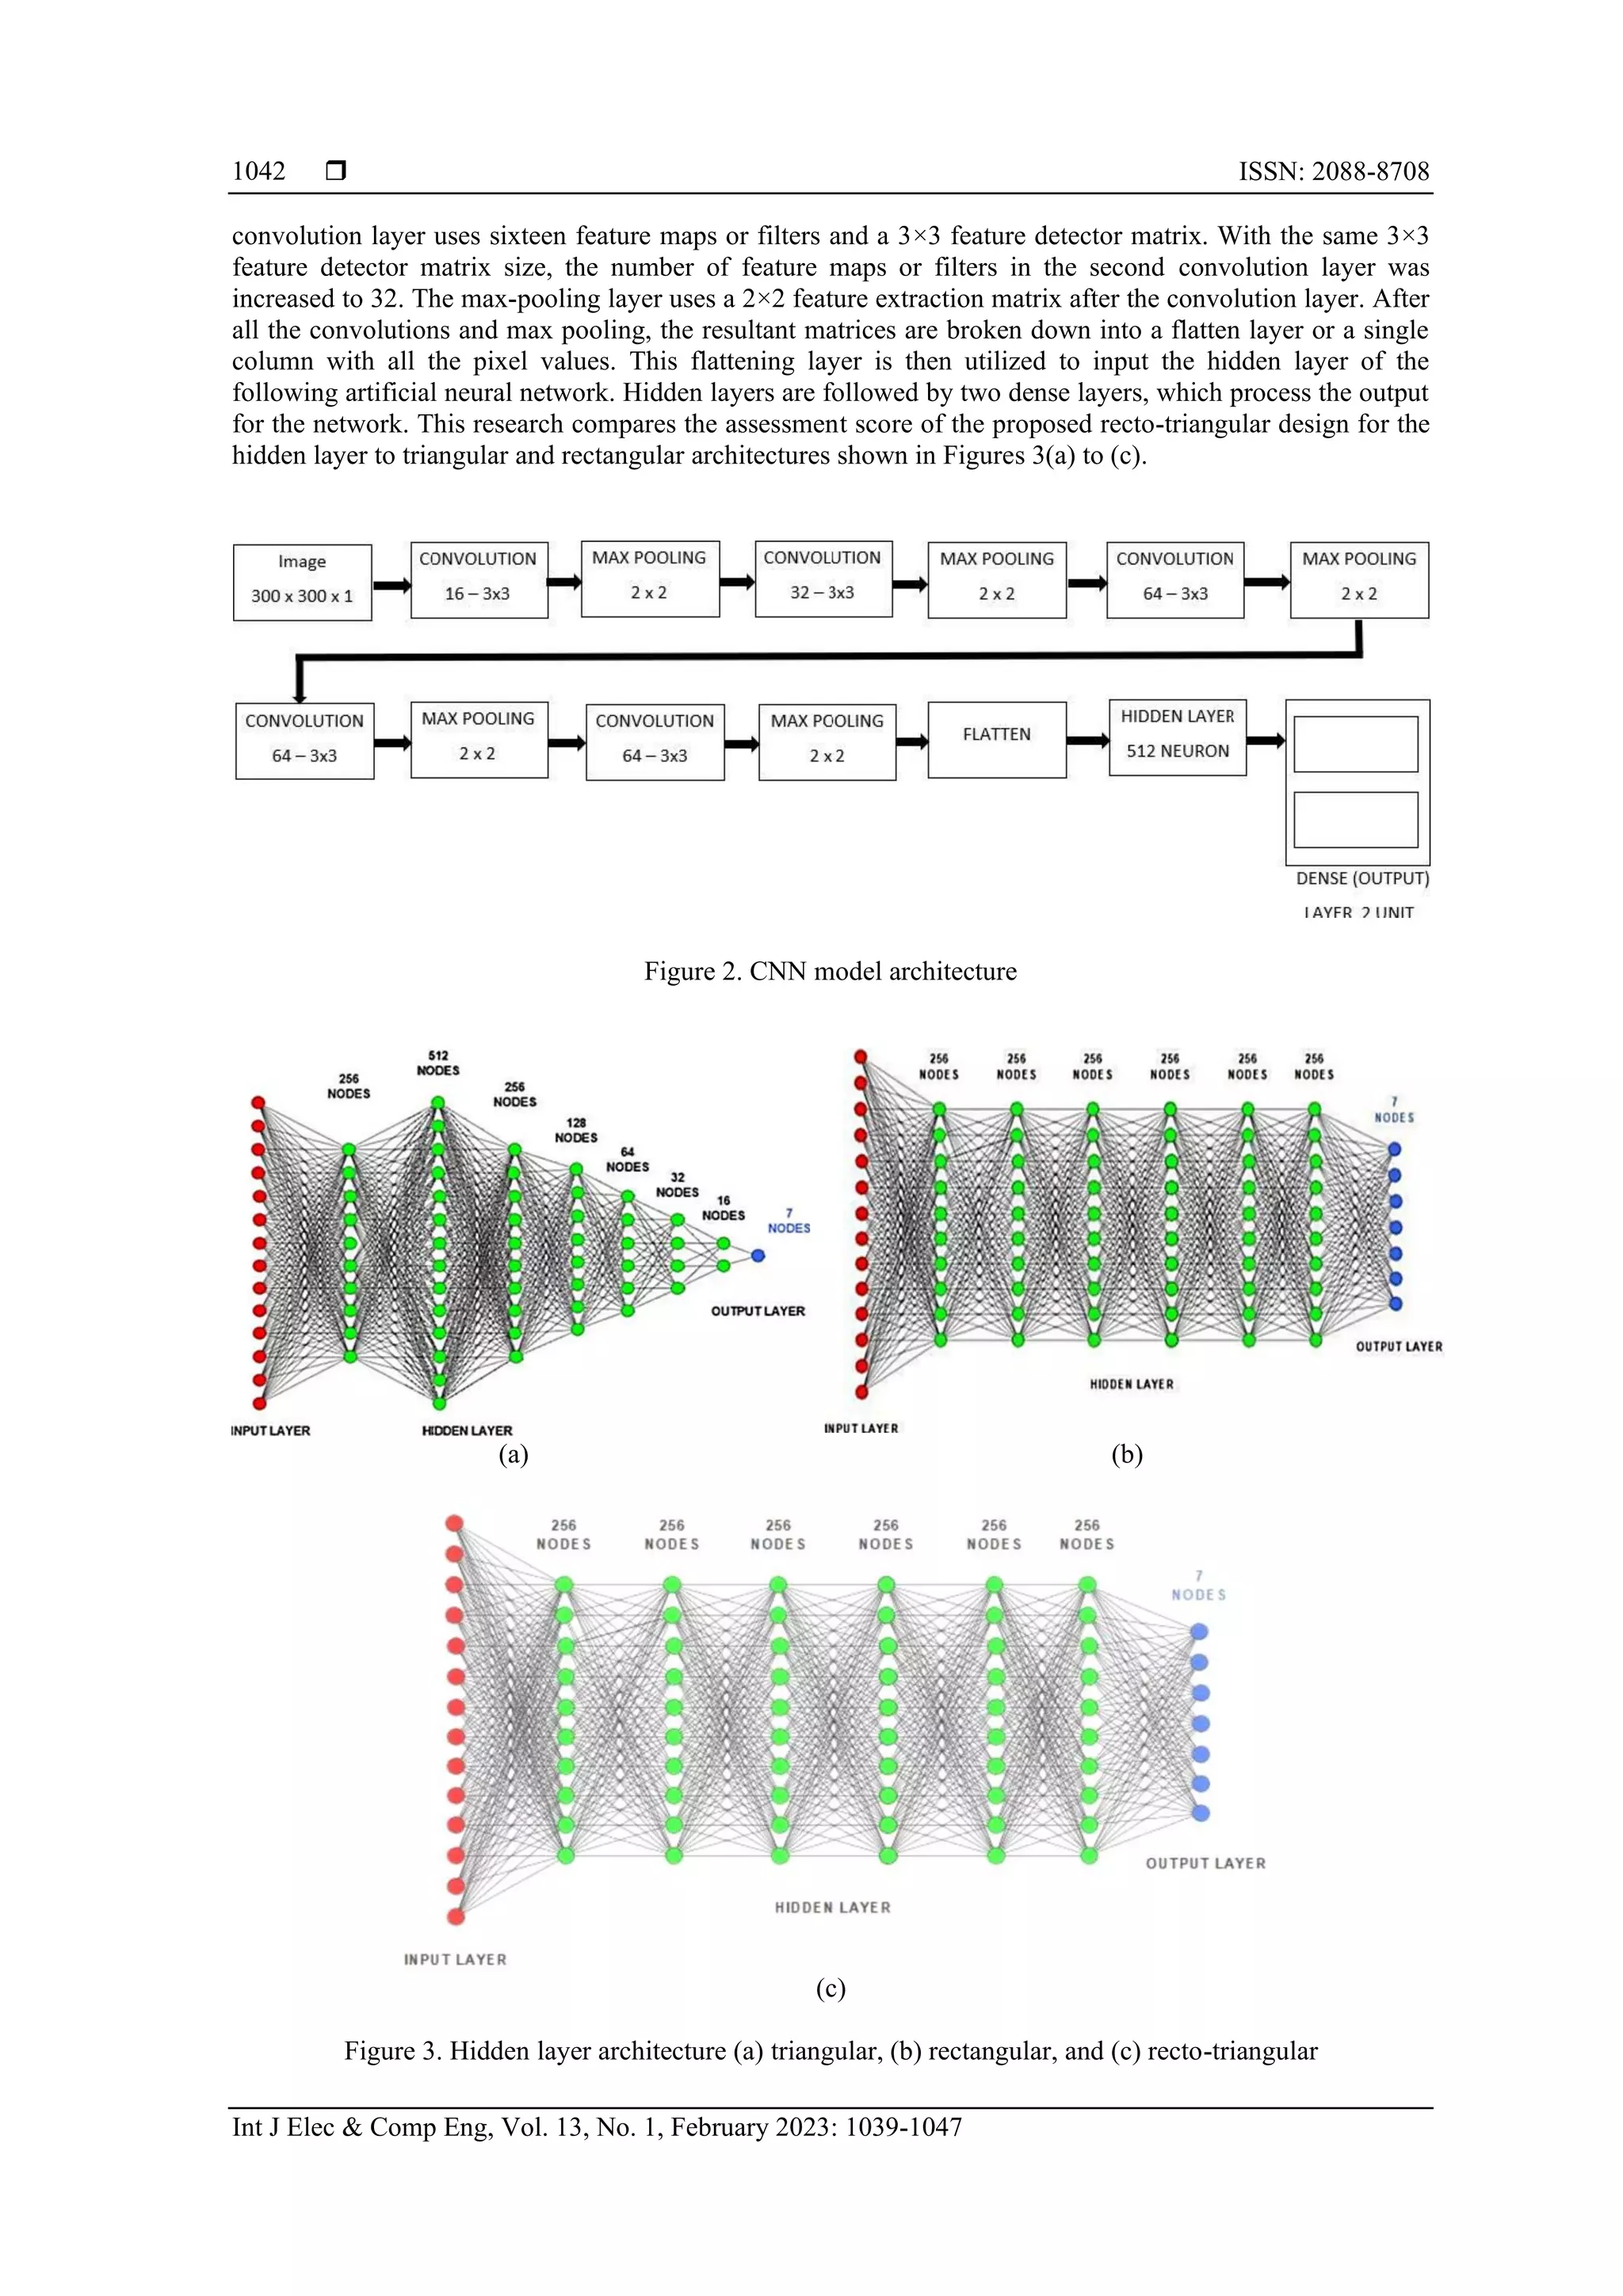
3.3. CNN model architecture
CNN was utilized to detect brain cancers using MR images in this study. CNN is an artificial neural
network (ANN) designed to analyze image pixels and extract meaningful images. CNNs are used in image and
video recognition [27]–[29], natural language processing, and artificial intelligence. In this study, the proposed
architecture contains an input layer, five convolutions, five max pooling, one flattens, fully connected, or
concealed, and two dense layers. The basic architecture of the proposed CNN is depicted in Figure 2.
The input layer is usually a pixel-filled image, and to construct a convolution layer, a feature map is
built and slid over these pixels. The pooling stage minimizes the number of features and increases the
correlation between proximity pixels. The suggested method uses the max-pooling methodology to
downsample images and extract essential features, such as edges. In this article, a max-pooling approach is
applied after each convolution layer. In the convolution 2D layer, the input images are scaled to 300*300
pixels. The rectified linear unit (ReLU) activation function is used in each convolution layer. The first](https://image.slidesharecdn.com/v9927388lemr14jul227feb22nn-221124062035-c2071421/75/A-deep-learning-approach-for-brain-tumor-detection-using-magnetic-resonance-imaging-3-2048.jpg)
![Int J Elec & Comp Eng ISSN: 2088-8708
A deep learning approach for brain tumor detection using magnetic resonance imaging (Al-Akhir Nayan)
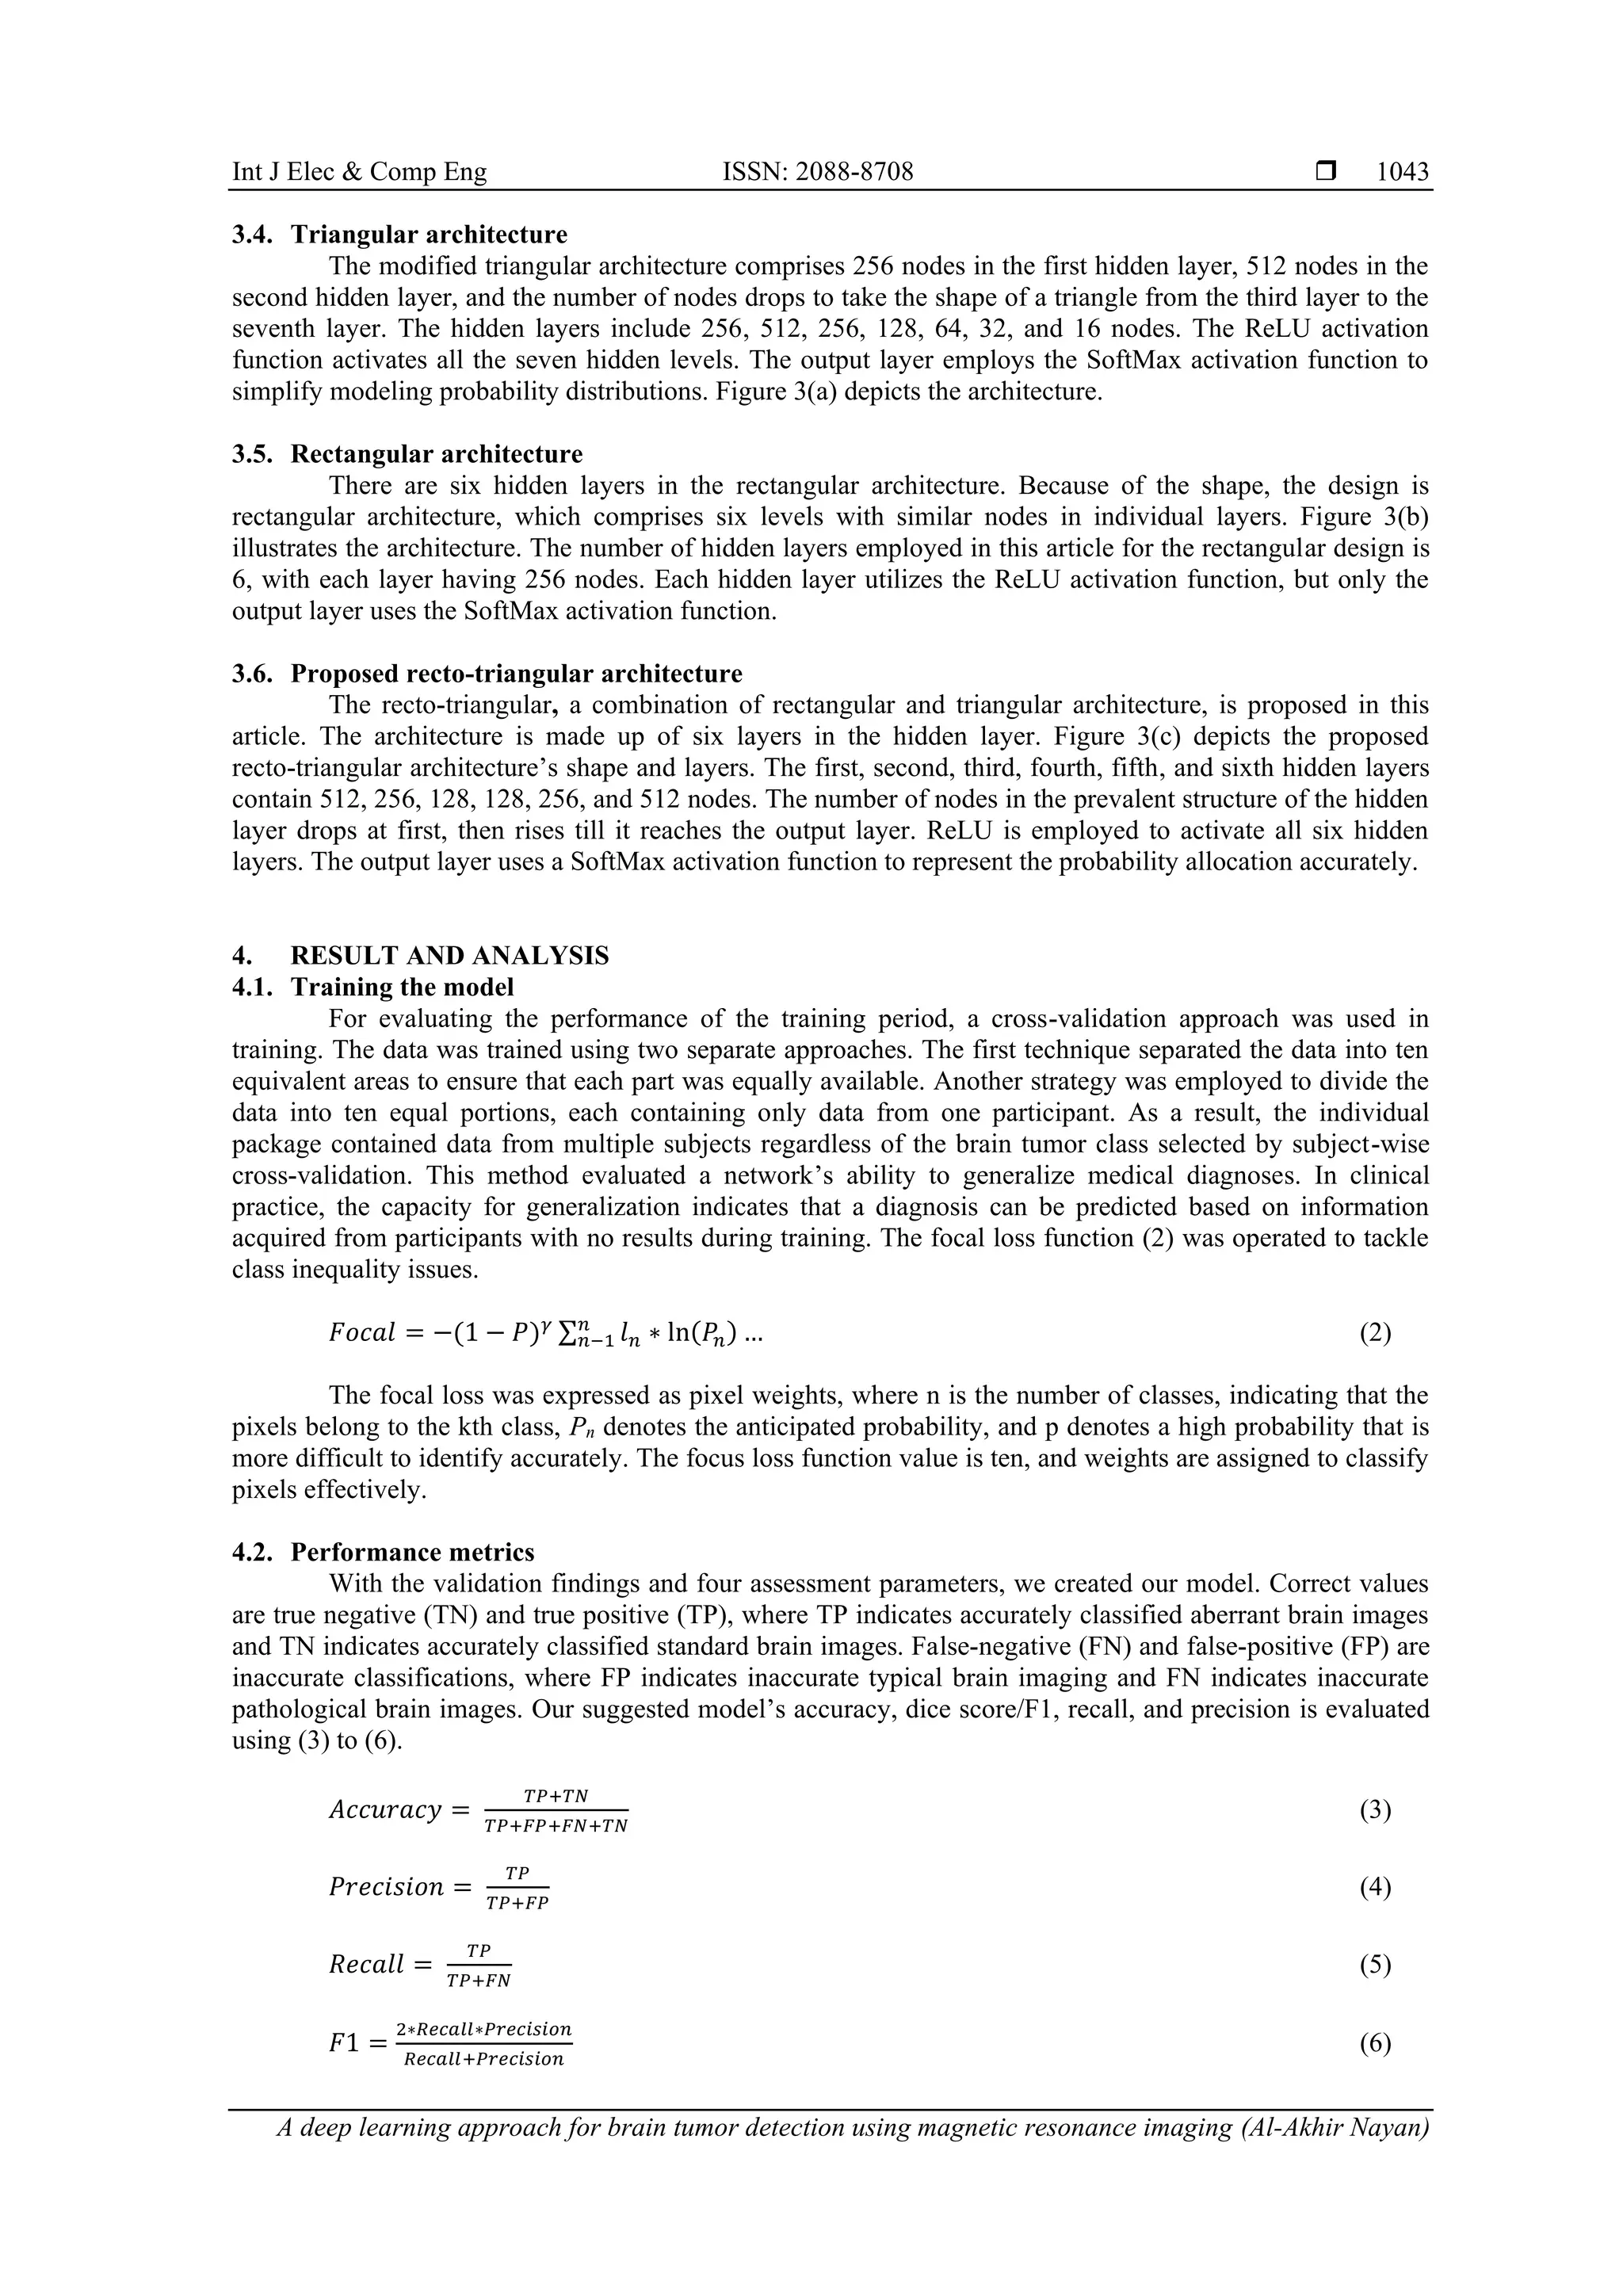
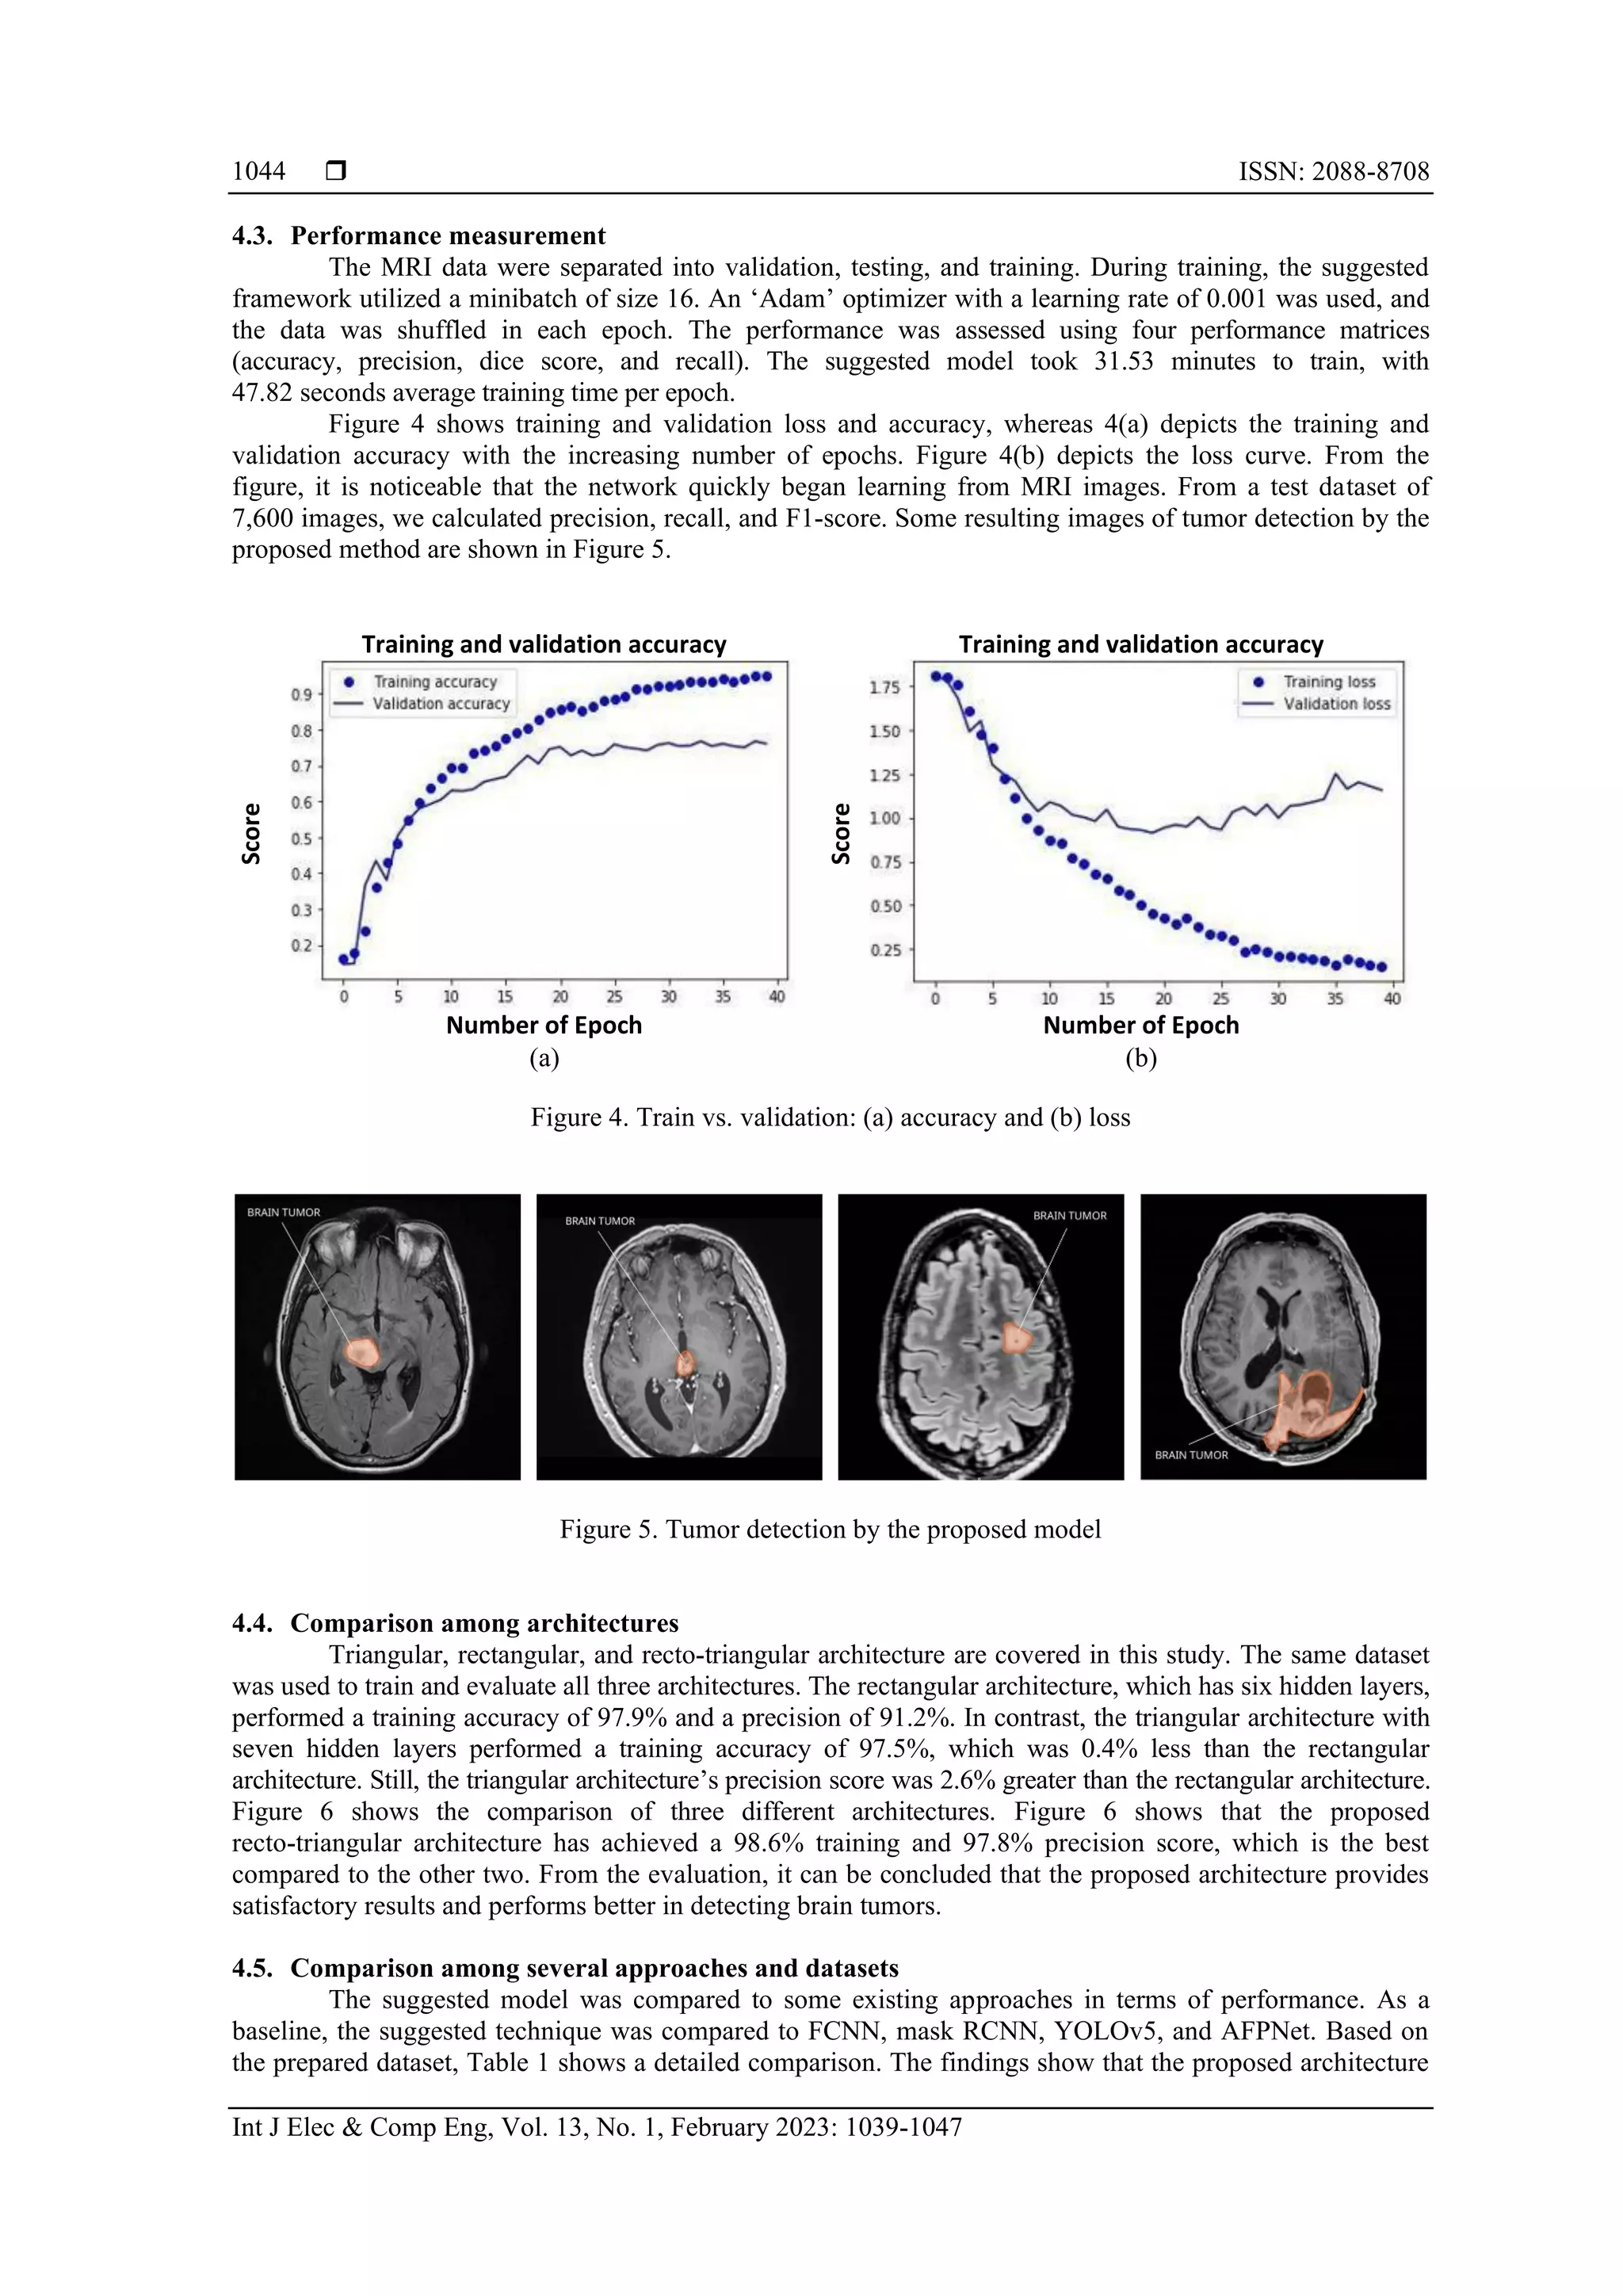
1045
performs much better than prior research investigations. The generated model dominates and surpasses the
current state-of-the-art model. The proposed model’s performance was measured on the existing brain tumor
dataset BRATS 2018, 2019, and 2020. Table 2 shows the model’s performance on BRATS datasets.
Figure 6. Comparison among architectures
Table 1. Performance comparison of several approaches
Name Accuracy F1 Recall Precision
AFPNet 98.30 92.67 98.25 87.65
Mask RCNN 99.16 91.09 99.40 84.24
YOLOv5 98.12 93.89 97.81 90.01
FCNN 98.73 95.98 98.50 93.37
Table 2. Proposed model’s performance on BRATS dataset
Name Accuracy F1 Recall Precision
BRATS_2018 97.25 96.32 96.17 95.40
BRATS_2019 98.10 97.63 96.30 97.16
BRATS_2020 98.49 98.21 96.58 97.53
5. CONCLUSION
A modified architecture has been proposed in this article that takes advantage of the processed MRI
dataset and proposed recto-triangular architecture in the hidden layer for brain tumor detection. The proposed
CNN model may perform better than human observers by focusing on a portion of the brain image near the
tumor tissue. The proposed preprocessing techniques remove many irrelevant pixels from the images to
reduce computing time and capacity. Compared to state-of-the-art alternatives, the proposed model with the
proposed hidden layer architecture and the processed dataset have performed better. In the future, we plan to
improve the filters to enhance accuracy.
REFERENCES
[1] A. Hussain and A. Hussain, “An insilico approach for brain tumor detection and classification from magnetic resonance images,”
Current Cancer Therapy Reviews, vol. 18, Mar. 2022, doi: 10.2174/1573394718666220329184137.
[2] M. Sharif, J. Amin, M. Raza, M. Yasmin, and S. C. Satapathy, “An integrated design of particle swarm optimization (PSO) with
fusion of features for detection of brain tumor,” Pattern Recognition Letters, vol. 129, pp. 150–157, Jan. 2020, doi:
10.1016/j.patrec.2019.11.017.
[3] B. Panda and C. S. Panda, “A review on brain tumor classification methodologies,” International Journal of Scientific Research
in Science and Technology, pp. 346–359, Dec. 2019, doi: 10.32628/IJSRST20717.
[4] R. L. Siegel, K. D. Miller, and A. Jemal, “Cancer statistics, 2020,” CA: A Cancer Journal for Clinicians, vol. 70, no. 1, pp. 7–30,
Jan. 2020, doi: 10.3322/caac.21590.
[5] A. M. Sarhan, “Brain tumor classification in magnetic resonance images using deep learning and wavelet transform,” Journal of
Biomedical Science and Engineering, vol. 13, no. 06, pp. 102–112, 2020, doi: 10.4236/jbise.2020.136010.
[6] M. Mudda, R. Manjunath, and N. Krishnamurthy, “Brain tumor classification using enhanced statistical texture features,” IETE
Journal of Research, pp. 1–12, Jun. 2020, doi: 10.1080/03772063.2020.1775501.
98.6 98.2
96.1
97.8
97.5
95.6
98.3
93.8
97.9
94.4
97.6
91.2
86
88
90
92
94
96
98
100
Accuracy F1 Recall Precision
Performance
Score
Name of Algorithms
Recto-Triangular Triangular Rectangular](https://image.slidesharecdn.com/v9927388lemr14jul227feb22nn-221124062035-c2071421/75/A-deep-learning-approach-for-brain-tumor-detection-using-magnetic-resonance-imaging-7-2048.jpg)
![ ISSN: 2088-8708
Int J Elec & Comp Eng, Vol. 13, No. 1, February 2023: 1039-1047
1046
[7] S. A. Swapnil and V. S. Girish, “Image mining methodology for detection of brain tumor: A review,” in 2020 Fourth
International Conference on Computing Methodologies and Communication (ICCMC), Mar. 2020, pp. 232–237, doi:
10.1109/ICCMC48092.2020.ICCMC-00044.
[8] L. Kapoor and S. Thakur, “A survey on brain tumor detection using image processing techniques,” in 2017 7th International
Conference on Cloud Computing, Data Science & Engineering-Confluence, Jan. 2017, pp. 582–585, doi:
10.1109/CONFLUENCE.2017.7943218.
[9] R. Ranjbarzadeh, A. B. Kasgari, S. J. Ghoushchi, S. Anari, M. Naseri, and M. Bendechache, “Brain tumor segmentation based on
deep learning and an attention mechanism using MRI multi-modalities brain images,” Scientific Reports, vol. 11, no. 1,
Art. no. 10930, Dec. 2021, doi: 10.1038/s41598-021-90428-8.
[10] M. I. Sharif, J. P. Li, J. Naz, and I. Rashid, “A comprehensive review on multi-organs tumor detection based on machine
learning,” Pattern Recognition Letters, vol. 131, pp. 30–37, Mar. 2020, doi: 10.1016/j.patrec.2019.12.006.
[11] A. Işın, C. Direkoğlu, and M. Şah, “Review of MRI-based brain tumor image segmentation using deep learning methods,”
Procedia Computer Science, vol. 102, pp. 317–324, 2016, doi: 10.1016/j.procs.2016.09.407.
[12] P. Saha, R. Das, and S. K. Das, “BCM-VEMT: Classification of brain cancer from MRI images using deep learning and ensemble
of machine learning techniques,” Research Square, pp. 1–19, 2021, doi: 10.21203/rs.3.rs-1100868/v1.
[13] M. K. Abd-Ellah, A. I. Awad, A. A. M. Khalaf, and H. F. A. Hamed, “A review on brain tumor diagnosis from MRI images:
Practical implications, key achievements, and lessons learned,” Magnetic Resonance Imaging, vol. 61, pp. 300–318, Sep. 2019,
doi: 10.1016/j.mri.2019.05.028.
[14] K. R. Bhatele and S. S. Bhadauria, “Brain structural disorders detection and classification approaches: a review,” Artificial
Intelligence Review, vol. 53, no. 5, pp. 3349–3401, Jun. 2020, doi: 10.1007/s10462-019-09766-9.
[15] M. I. Sharif, “Recent advancements in brain tumor segmentation and classification using deep learning: a review,” International
Journal of Engineering Research and, vol. V8, no. 12, Dec. 2019, doi: 10.17577/IJERTV8IS120190.
[16] R. Kaur and A. Doegar, “Localization and classification of brain tumor using machine learning & deep learning techniques,”
International Journal of Innovative Technology and Exploring Engineering, vol. 8, no. 9S, pp. 59–66, Aug. 2019, doi:
10.35940/ijitee.I1010.0789S19.
[17] A. R. Deepa and W. R. S. Emmanuel, “A comprehensive review and analysis on MRI based brain tumor segmentation,”
International Journal of Scientific & Technology Research, vol. 8, no. 10, pp. 2140–2154, 2019.
[18] G. S. Tandel et al., “A review on a deep learning perspective in brain cancer classification,” Cancers, vol. 11, no. 1, Jan. 2019,
doi: 10.3390/cancers11010111.
[19] S. Kumar, A. Negi, J. N. Singh, and H. Verma, “A deep learning for brain tumor MRI images semantic segmentation using FCN,”
in 2018 4th International Conference on Computing Communication and Automation (ICCCA), Dec. 2018, pp. 1–4, doi:
10.1109/CCAA.2018.8777675.
[20] F. Derikvand and H. Khotanlou, “Brain tumor segmentation in MRI images using a hybrid deep network based on patch and
pixel,” in 2020 International Conference on Machine Vision and Image Processing (MVIP), Feb. 2020, pp. 1–5, doi:
10.1109/MVIP49855.2020.9116880.
[21] G. Hemanth, M. Janardhan, and L. Sujihelen, “Design and implementing brain tumor detection using machine learning approach,”
in 2019 3rd International Conference on Trends in Electronics and Informatics (ICOEI), Apr. 2019, pp. 1289–1294, doi:
10.1109/ICOEI.2019.8862553.
[22] T. Hossain, F. S. Shishir, M. Ashraf, M. D. A. Al Nasim, and F. M. Shah, “Brain tumor detection using convolutional neural
network,” in 2019 1st International Conference on Advances in Science, Engineering and Robotics Technology (ICASERT), May
2019, pp. 1–6, doi: 10.1109/ICASERT.2019.8934561.
[23] A. Minz and C. Mahobiya, “MR Image classification using AdaBoost for brain tumor type,” in 2017 IEEE 7th International
Advance Computing Conference (IACC), Jan. 2017, pp. 701–705, doi: 10.1109/IACC.2017.0146.
[24] M. Gurbina, M. Lascu, and D. Lascu, “Tumor detection and classification of MRI brain image using different wavelet transforms
and support vector machines,” in 2019 42nd International Conference on Telecommunications and Signal Processing (TSP), Jul.
2019, pp. 505–508, doi: 10.1109/TSP.2019.8769040.
[25] P. Sharath Chander, J. Soundarya, and R. Priyadharsini, “Brain tumour detection and classification using K-means clustering and
SVM classifier,” in RITA 2018, 2020, pp. 49–63.
[26] S. (Spyros) Bakas, “Brats MICCAI brain tumor dataset,” IEEE Data Port, 2020, doi: 10.21227/hdtd-5j88.
[27] A.-A. Nayan, J. Saha, A. N. Mozumder, K. R. Mahmud, and A. K. Al Azad, “Real time multi-class object detection and
recognition using vision augmentation algorithm,” International Journal of Advanced Science and Technology, vol. 29, no. 5,
pp. 14070–14083, 2020, doi: 10.48550/arXiv.2003.07442.
[28] A.-A. Nayan, J. Saha, K. Raqib Mahmud, A. Kalam Al Azad, and M. Golam Kibria, “Detection of objects from noisy images,” in
2020 2nd International Conference on Sustainable Technologies for Industry 4.0 (STI), Dec. 2020, pp. 1–6, doi:
10.1109/STI50764.2020.9350521.
[29] A.-A. Nayan, B. Kijsirikul, and Y. Iwahori, “Mediastinal lymph node detection and segmentation using deep learning,” IEEE
Access, pp. 1–1, 2022, doi: 10.1109/ACCESS.2022.3198996.
BIOGRAPHIES OF AUTHORS
Al-Akhir Nayan received a Bachelor of Science degree in Computer Science and
Engineering from the University of Liberal Arts Bangladesh (ULAB), Dhaka, Bangladesh, in
2019. He joined the European University of Bangladesh (EUB), Dhaka, in 2019 and worked as
a Lecturer in Computer Science and Engineering Department. He is pursuing a master’s degree
with the Department of Computer Engineering, Chulalongkorn University, Bangkok, Thailand.
His research interests include deep learning, machine learning, artificial intelligence, medical
image processing, and IoT. He can be contacted via email asquiren@gmail.com.](https://image.slidesharecdn.com/v9927388lemr14jul227feb22nn-221124062035-c2071421/75/A-deep-learning-approach-for-brain-tumor-detection-using-magnetic-resonance-imaging-8-2048.jpg)