Download to read offline


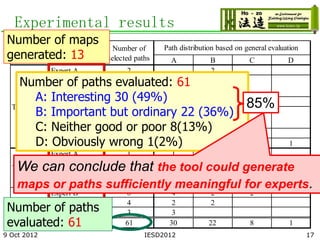
![Experiments for
Evaluation
Target domain and topics
Biofuel production in sustainability science (environmental
domain) .
An experiment for evaluating ontology exploration
tool by domain experts [Kozaki 2011]
Subjects: 4 domain experts
Goal: To evaluate whether the tool can generate maps which are
meaningful for domain experts.
An experiment of consensus building by role-play
discussion
9 Oct 2012 IESD2012 15](https://image.slidesharecdn.com/iesd2012kozakiforss-121009141442-phpapp01/85/A-Consensus-Building-Support-System-based-on-Ontology-Exploration-15-320.jpg)

![Evaluation experiment
Target domain and topics
Biofuel production in sustainability science (environmental
domain) .
An experiment for evaluating ontology exploration
tool by domain experts [Kozaki 2011]
Subjects: 4 domain experts
Goal: To evaluate whether the tool can generate maps which are
meaningful for domain experts.
An experiment of consensus building by role-play
discussion
Subjects: 4 students and 5 domain experts
Goal: To evaluate whether ontology explorations and generated
maps could facilitate a better mutual understanding for
consensus-building among stakeholders.
9 Oct 2012 IESD2012 18](https://image.slidesharecdn.com/iesd2012kozakiforss-121009141442-phpapp01/85/A-Consensus-Building-Support-System-based-on-Ontology-Exploration-18-320.jpg)

![Time table of the experiment
Time used Group A Group B
4 students
Group A 4 Group B
expert
in minute + 1 expert (moderator)
10 Instruction of the experiment
15 Preparation(1)[making a rough plan]
Experiment 1
20 Group discussion(1)[without the system]
Preparation(2)
15
Preparation(2) [rough planning]
35
[Each builds a map] Group discussion(2)
20 Experiment 2
[without a map]
Group discussion (2) Participate in the
20
[Discussion with maps] discussion by group B
20 Answering inquiries with wrap-up discussion
9 Oct 2012 IESD2012 20](https://image.slidesharecdn.com/iesd2012kozakiforss-121009141442-phpapp01/85/A-Consensus-Building-Support-System-based-on-Ontology-Exploration-20-320.jpg)

![Result: Comparison between the
discussion done by groups A and
B
Time used Group A Group B
4 students
Group A 4 Group B
expert
in minute + 1 expert (moderator)
10 There is no significant difference of the number
Instruction of the experiment
of topics appearing the first discussion.
15 Preparation(1)[making a rough plan]
Experiment 1
20 Group discussion(1)[without the system]
Preparation(2)
15 The number of topics appearing
Preparation(2)
the second discussion [rough planning]
35
[Each builds a map] Group discussion(2)
20 Experiment 2
[without a map]
Group discussion (2) Participate in the
20
[Discussion with maps] discussion by group B
20 Answering inquiries with wrap -up discussion
9 Oct 2012 IESD2012 22](https://image.slidesharecdn.com/iesd2012kozakiforss-121009141442-phpapp01/85/A-Consensus-Building-Support-System-based-on-Ontology-Exploration-22-320.jpg)

![Result: Discussion by Group A
through comparison of the
generated maps
Time used Group A Group B
4 students
Group A 4 Group B
expert
in minute + 1 expert (moderator)
10 Instruction of the experiment
15 Preparation(1)[making a rough plan]
Experiment 1
20 Group discussion(1)[without the system]
Preparation(2)
15
Preparation(2) [rough planning]
35
[Each builds a map] Group discussion(2)
20 Experiment 2
[without a map]
Group discussion (2) Participate in the
20
[Discussion with maps] discussion by group B
20 Answering inquiries with wrap -up discussion
9 Oct 2012 IESD2012 24](https://image.slidesharecdn.com/iesd2012kozakiforss-121009141442-phpapp01/85/A-Consensus-Building-Support-System-based-on-Ontology-Exploration-24-320.jpg)
![Result: The number of nodes included
in each map built by each subject in
group A
* The numbers of overlapping nodes indicate the how much the
stakeholders share common interests.
Number Number of overlapping nodes
of nodes in
d: Environmental
the map a: Industry b:Government c:Employees
NGO
a:Industry 110 16 21 10
b:Government 88 - 12 5
c:Employees 187 -
Employees and- 49
Environmental NGO share
d:Environmental
NGO
115 - - -
a lot of common interests.
This interpretation is supported by the result of stakeholder
analysis by an domain Sexpert [Shiroyama H, et al. 2010].
9 Oct 2012 IESD2012 25](https://image.slidesharecdn.com/iesd2012kozakiforss-121009141442-phpapp01/85/A-Consensus-Building-Support-System-based-on-Ontology-Exploration-25-320.jpg)


The document presents a consensus-building support system based on ontology exploration aimed at facilitating collaboration among diverse stakeholders, particularly in the biofuel domain. It describes a tool that allows users to explore different viewpoints by generating conceptual maps, facilitating understanding and discussion among stakeholders. The evaluation experiments conducted indicate that the tool is meaningful for users and can assist in achieving consensus through visualizing differences and similarities in perspectives.