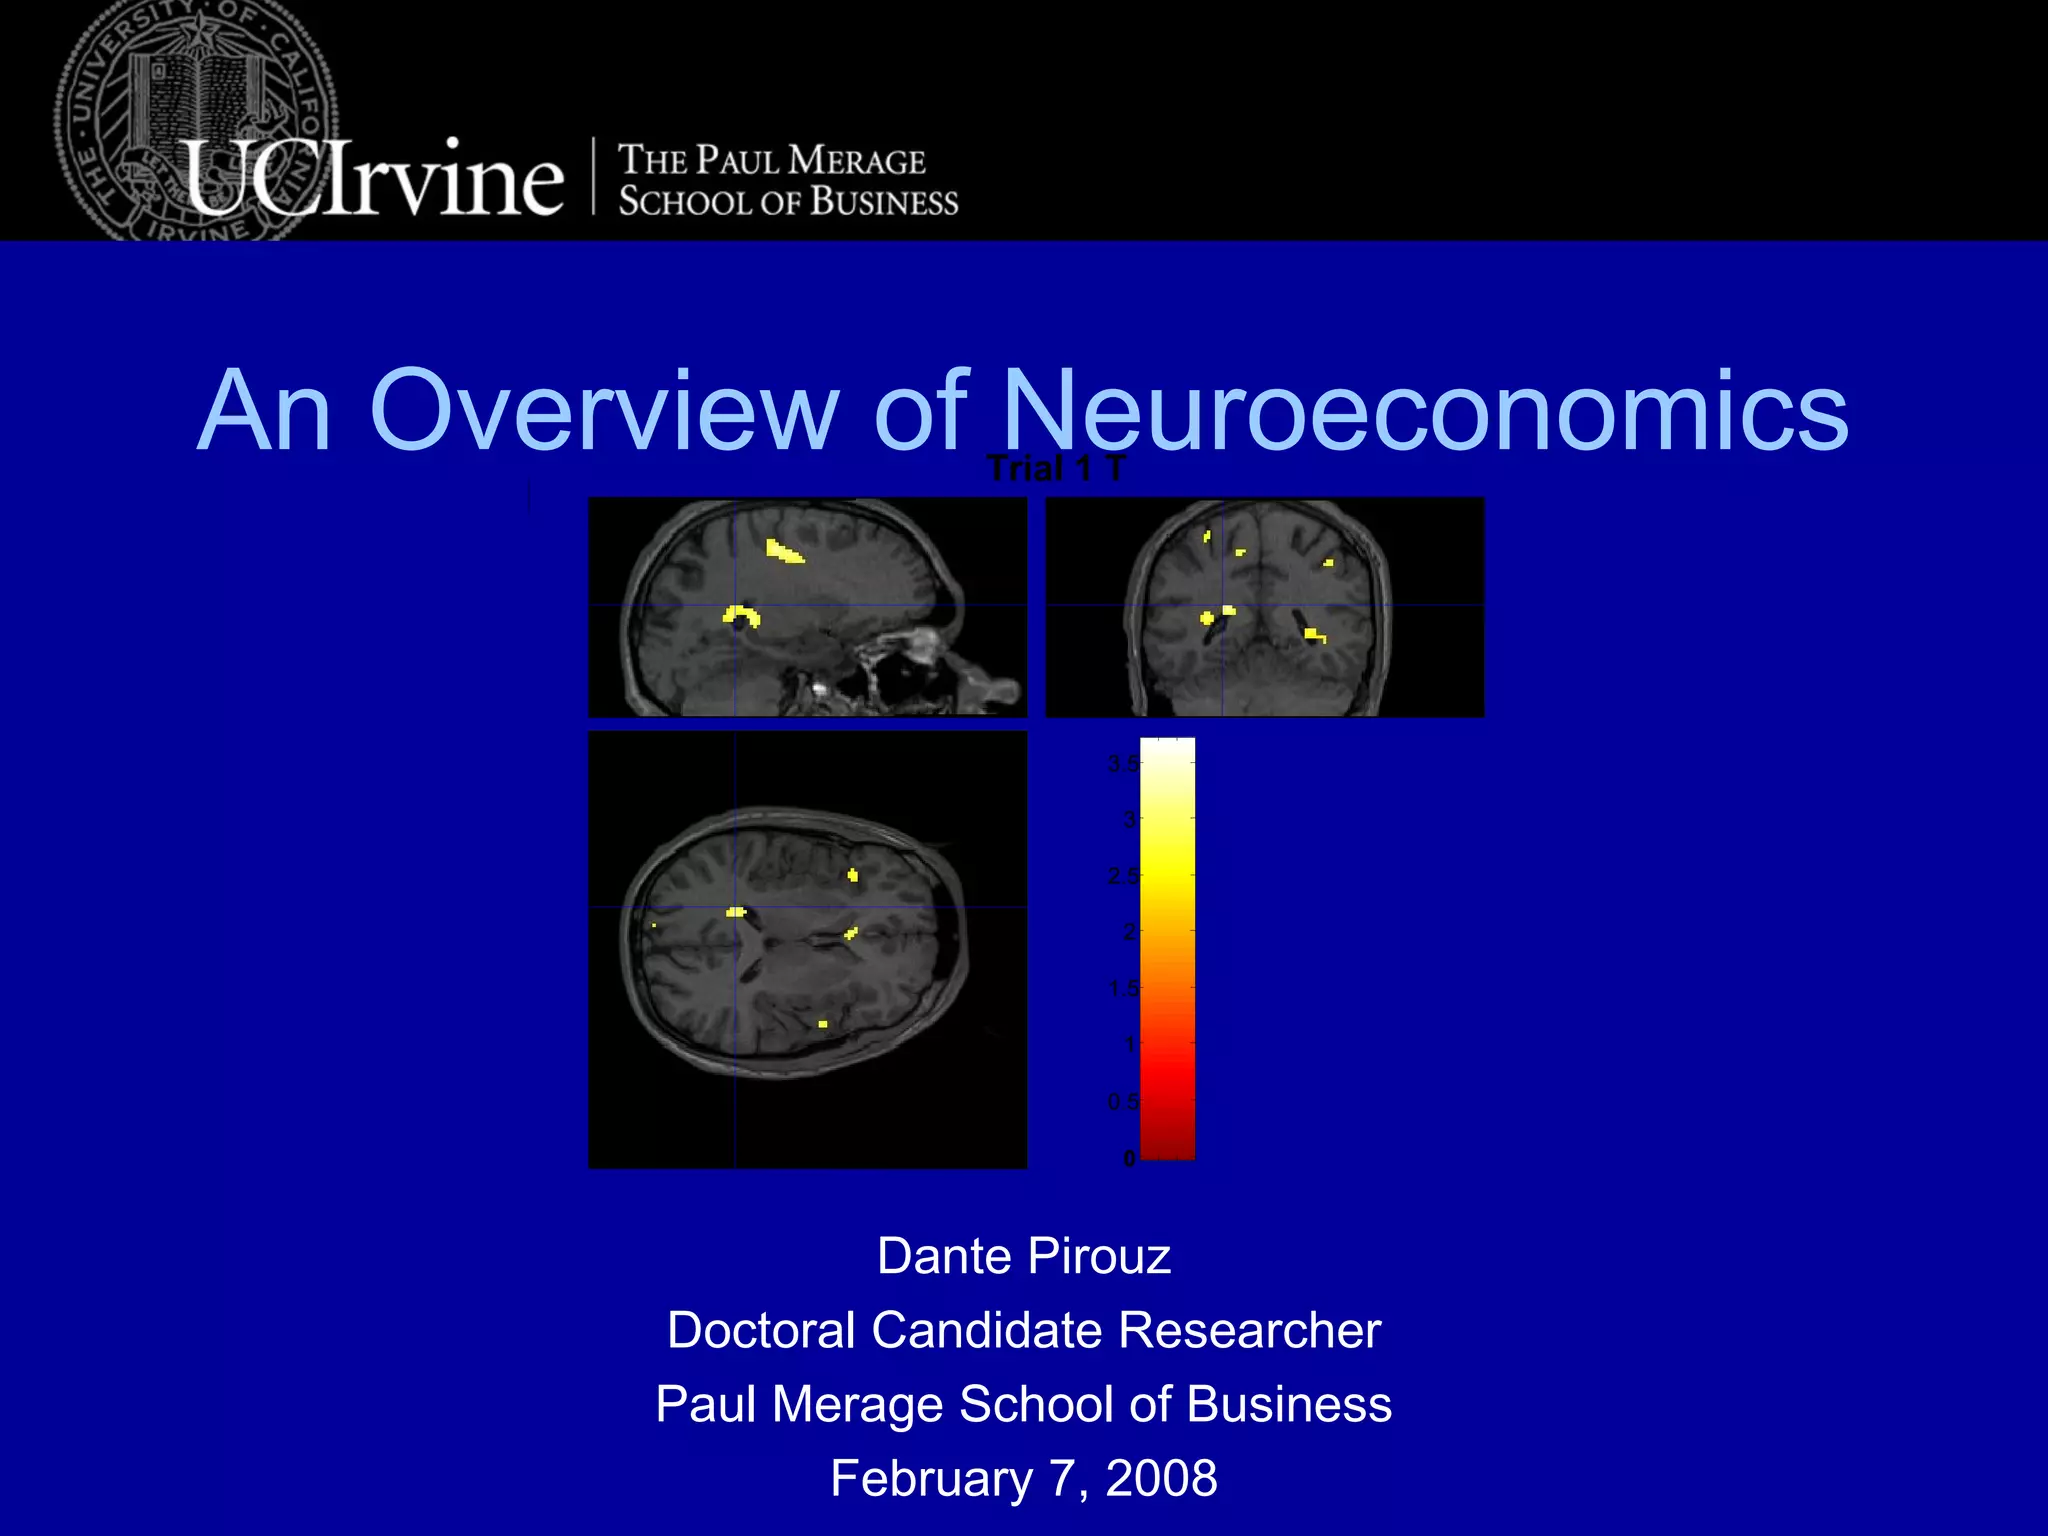
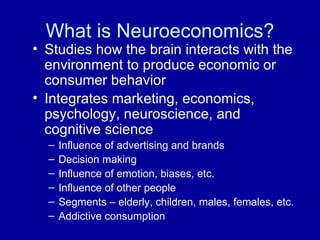
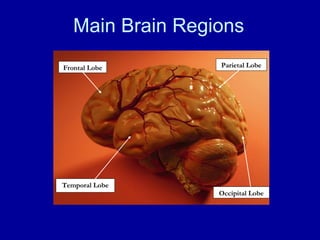
An Overview of Neuroeconomics Dante Pirouz Doctoral Candidate Researcher Paul Merage School of Business February 7, 2008 Trial 1 T 0 0.5 1 1.5 2 2.5 3 3.5
Some Neuroecon Humor…
Consumer Behavior: Brand identification Brand recognition Emotional response Memory
What is Neuroeconomics? Studies how the brain interacts with the environment to produce economic or consumer behavior Integrates marketing, economics, psychology, neuroscience, and cognitive science   Influence of advertising and brands Decision making Influence of emotion, biases, etc. Influence of other people Segments – elderly, children, males, females, etc.  Addictive consumption
Cognitive Neuroscience Seeks to understand the neural mechanisms underlying higher brain function Language, learning, memory, attention, emotion, decision making, perception
Why Combine Consumer Behavior and Neuroscience? Neoclassical economists ask “Given rational people, how do models behave?” Psychologists ask “Why do people behave the way they do?” Looking into the “black box” At the neuronal and biochemical level  To understand what makes people happy, risk seeking or averse, trusting or trustworthy and what drives preference and choice
Neural Response to Advertising Taste test Coke vs. Pepsi Baylor College of Medicine 2004 Super Bowl ads Ranking by fMRI brain scans UCLA 2006 Winner:  ‘I’m Going to Disney World’ Loser:  Budweiser’s ‘Secret Fridge’
Main Brain Regions Occipital Lobe Frontal Lobe Parietal Lobe Temporal Lobe
Pons Spinal Cord Cerebellum Amygdala Thalamus Hypothalamus Hippocampal Formation Corpus Callosum Cingulate Gyrus Striatum Limbic System
Neuroscience Methods Studying humans Imaging of brain activity Measuring hormone levels, pupil dilation, galvanic skin response, heart rate variability Lesion studies Stimulation Transcranial magnetic stimulation (TMS) Studying animals Single and multiunit recordings
Phineas Gage
Brain Imaging Techniques Methodology What is imaged? How? Electroencephalography (EEG) Changes in electrical brain current Electrodes placed on scalp measure electrical brain waves Computed (Axial) Tomography Scan (CT or CAT) X-ray images of the brain Multiple images (tomograms) are taken by rotating X-ray tubes. Does not image function Positron Emission Tomography (PET) Emissions from radioactive chemicals in the blood Radioactive isotopes injected into the blood are detected like X-rays Magnetoencephalography (MEG) Changes in electrical brain current Similar to EEG but magnetic brain waves are measured instead of electrical waves Functional Magnetic Resonance Imaging (fMRI) Blood flow; oxyhemoglobin to deoxyhemoglobin ratio Relies on magnetic properties of blood. Shows brain function spatially and temporally
EEG
CT/CAT
PET
MEG
Functional Magnetic Resonance Imaging (fMRI) Uses strong magnetic fields to create images of biological tissue Measures hemodynamic signals related to neural activity Blood Oxygenation Level Dependent (BOLD) contrast MR signal of blood is dependent on level of oxygenation Changes in deoxyhemoglobin Blood flow in the brain implies function Studies have shown regional brain activity when exposed to cues (Huettel et al. 2004) Source: UC Irvine Center for Functional Onco-Imaging
Why is fMRI so exciting? Non-invasive Better temporal resolution Good and improving spatial resolution Can be used in conjunction with other methods (Savoy 2005) Pirouz & Park, 2005, Harvard Medical School/Massachusetts General Hospital Fellowship Program in fMRI
Caveats of fMRI Interpreting the results Direct vs. indirect measure of brain activity Inferring behavior Experimental design Statistical methods Learning the procedure and statistical methods Cost Comfort/safety/cooperation of the subject
The Dark Side of Product Attachment:  The Neural Response to  Addictive Product Cues Dante Pirouz, Doctoral Student Dr. Steve Cramer, Assistant Professor, Neuroanatomy/Neuroscience Connie Pechmann, Professor, Marketing Paul Rodriguez, Research Specialist, Cognitive Science University of California, Irvine Funded by a clinical research grant from  UCI’s General Clinical Research Center (GCRC)
Background Cue Reactivity Theory (Carter & Tiffany 1999) Substance users exposed to environmental cues (visual, tactile, olfactory, etc.)  Role of cues in addiction How this is related to marketing: Role marketing/ advertising plays in influencing behavior Especially for vulnerable populations, e.g. adolescents
Method Event-Related fMRI (3T) 6 subjects 14 – 25 years old 2 groups: smokers and non-smokers Stimuli Cigarette ads Non-cigarette ads Matched to cig ads Neutral images
Cigarette Ads Ads from 1998 - 2000 40 images Marlboro, Newport, Camel, Winston, Salem, Virginia Slims, Lucky Strike Source: Pollay Tobacco Ad Collection
Neutral Ads Ads from 1999 - 2005 Matched in color, theme, etc. 40 images
Neutral Images International Affective Picture System (Lang 1997) 40 images


Neural Predictors of Purchases Knutson, Rick, Wimmer, Prelec and Loewenstein, Neuron, 2007 Investigates how people process preference and price when buying Decision to purchase Tradeoff between pleasure of acquisition and pain of paying Positive and negative anticipatory affect Determine the distinct neural components of the purchase decision process in individuals
 
Experimental Design Event-related fMRI SHOP = Save Holdings Or Purchase task 26 adults Endowed $20 to spend on range of products 80 products; $8-$80 Subjects purchased about 30% of products
Results Nucleus accumbens (NAcc) Anticipation of financial gains Correlated with product preference Evaluating rewards and craving Insula Implicated in anticipation of loss (Paulus & Stein 2006) Correlated with excessive prices Mesial prefrontal cortex (MPFC) Implicated with integrating gains and losses Correlated with reduced prices
Results Study shows some evidence of regions that can predict purchasing Preference elicits activation in NAcc prior to purchase decision Excessive prices elicits insula activation and MPFC deactivation  Preference as potential gain and price as potential cost
 
Investment Behavior and the Negative Side of Emotion Shiv, Loewenstein, Bechara, Damasio, and Damasio, Psychological Science, 2005 Do emotions cause poor investment decisions? Compared subjects with stable focal brain lesions disabling emotional regions with control patients with no impairment 19 normal subjects, 15 lesion patients with damage in emotional regions, 7 lesion controls with damage in non-emotion related regions
Investment Game Participants told they would making several rounds of investment decisions Endowed with $20 play money  Choose between 2 options: invest or don’t invest If invest, give $1 to researcher; if not, keep $1 Researcher will flip coin  If heads, then lose $1 If tails, then get $2.50 Rational choice: Always invest!!  EV of investing is higher than not investing
Results Lesion patients with emotional neural  damage make more advantageous investment decisions than normal subjects Target patients invested consistently across rounds; controls/normal subjects increasingly declined to invest
The Neurobiology of Trust Zak, Kurzban & Matzner, Annals of New York Academy of Science, 2004 Do hormones, such as oxytocin, regulate trust behavior? Oxytocin Neuropeptide involved in social recognition and bonding Trust game Subjects arranged into DM1-DM2 dyads DM1 asked to split $10 Decision will determine how much they earn 28 mL of blood drawn after each decision 2 conditions: Intention and random draw
Trust Game At node A, the investor has the option of either path Moving left ends the game with the outcomes: $0 to the Trustee and $10 to the Investor Moving right allows trustee to move (after investment is increased) Trustee can choose either path at node B Once trustee moves the game ends and payoffs are distributed (McCabe 2003a) A: Investor B: Trustee $0 $10 $15 $15 $0 $30
Results Oxytocin (OT) levels were higher (2x) with an intentional trust signal from DM1s in DM2s than in random draw condition Also, behavior changed with an intentional trust signal DM2s returned 53% of the money they received vs. 18% in the random draw condition
 
$20/bottle $90/bottle
Marketing Actions Can Modulate Neural Representations of Experienced Pleasantness Plassman, O’Doherty, Shiv and Rangel, PNAC, 2008 Do the changes in the price of a product affect neural representations of experienced pleasantness = price/quality effect Subjects were scanned while taste testing red wines that they believed were different and sold at different prices
 
Results Increasing the price of a wine increased subjective reports of flavor pleasantness Increased BOLD activity in the medial orbitofrontal cortex, believed to encode for experienced pleasantness Study shows that marketing actions modulate neural correlates of experienced pleasantness
Criticisms Theory? Preference for existing models Press coverage Consumer concern Commercial ventures
Recommended Reading “ Neuroeconomics: How Neuroscience Can Inform Economics”   Colin F. Camerer, George Loewenstein, and Drazen Prelec (2005)  Journal of Economic Literature  43(1): 9. “  What Can Advertisers Learn from Neuroscience?” Hilke Plassmann, Tim Ambler, Sven Braeutigam, and Peter Kenning (2007)  International Journal of Advertising  26(2): 151-75. The Secret Life of the Brain , PBS
Thanks! [email_address] http://www.merage.uci.edu/~dpirouz04/

Overview of Neuroeconomics

  • 1.
    An Overview ofNeuroeconomics Dante Pirouz Doctoral Candidate Researcher Paul Merage School of Business February 7, 2008 Trial 1 T 0 0.5 1 1.5 2 2.5 3 3.5
  • 2.
  • 3.
    Consumer Behavior: Brandidentification Brand recognition Emotional response Memory
  • 4.
    What is Neuroeconomics?Studies how the brain interacts with the environment to produce economic or consumer behavior Integrates marketing, economics, psychology, neuroscience, and cognitive science Influence of advertising and brands Decision making Influence of emotion, biases, etc. Influence of other people Segments – elderly, children, males, females, etc. Addictive consumption
  • 5.
    Cognitive Neuroscience Seeksto understand the neural mechanisms underlying higher brain function Language, learning, memory, attention, emotion, decision making, perception
  • 6.
    Why Combine ConsumerBehavior and Neuroscience? Neoclassical economists ask “Given rational people, how do models behave?” Psychologists ask “Why do people behave the way they do?” Looking into the “black box” At the neuronal and biochemical level To understand what makes people happy, risk seeking or averse, trusting or trustworthy and what drives preference and choice
  • 7.
    Neural Response toAdvertising Taste test Coke vs. Pepsi Baylor College of Medicine 2004 Super Bowl ads Ranking by fMRI brain scans UCLA 2006 Winner: ‘I’m Going to Disney World’ Loser: Budweiser’s ‘Secret Fridge’
  • 8.
    Main Brain RegionsOccipital Lobe Frontal Lobe Parietal Lobe Temporal Lobe
  • 9.
    Pons Spinal CordCerebellum Amygdala Thalamus Hypothalamus Hippocampal Formation Corpus Callosum Cingulate Gyrus Striatum Limbic System
  • 10.
    Neuroscience Methods Studyinghumans Imaging of brain activity Measuring hormone levels, pupil dilation, galvanic skin response, heart rate variability Lesion studies Stimulation Transcranial magnetic stimulation (TMS) Studying animals Single and multiunit recordings
  • 11.
  • 12.
    Brain Imaging TechniquesMethodology What is imaged? How? Electroencephalography (EEG) Changes in electrical brain current Electrodes placed on scalp measure electrical brain waves Computed (Axial) Tomography Scan (CT or CAT) X-ray images of the brain Multiple images (tomograms) are taken by rotating X-ray tubes. Does not image function Positron Emission Tomography (PET) Emissions from radioactive chemicals in the blood Radioactive isotopes injected into the blood are detected like X-rays Magnetoencephalography (MEG) Changes in electrical brain current Similar to EEG but magnetic brain waves are measured instead of electrical waves Functional Magnetic Resonance Imaging (fMRI) Blood flow; oxyhemoglobin to deoxyhemoglobin ratio Relies on magnetic properties of blood. Shows brain function spatially and temporally
  • 13.
  • 14.
  • 15.
  • 16.
  • 17.
    Functional Magnetic ResonanceImaging (fMRI) Uses strong magnetic fields to create images of biological tissue Measures hemodynamic signals related to neural activity Blood Oxygenation Level Dependent (BOLD) contrast MR signal of blood is dependent on level of oxygenation Changes in deoxyhemoglobin Blood flow in the brain implies function Studies have shown regional brain activity when exposed to cues (Huettel et al. 2004) Source: UC Irvine Center for Functional Onco-Imaging
  • 18.
    Why is fMRIso exciting? Non-invasive Better temporal resolution Good and improving spatial resolution Can be used in conjunction with other methods (Savoy 2005) Pirouz & Park, 2005, Harvard Medical School/Massachusetts General Hospital Fellowship Program in fMRI
  • 19.
    Caveats of fMRIInterpreting the results Direct vs. indirect measure of brain activity Inferring behavior Experimental design Statistical methods Learning the procedure and statistical methods Cost Comfort/safety/cooperation of the subject
  • 20.
    The Dark Sideof Product Attachment: The Neural Response to Addictive Product Cues Dante Pirouz, Doctoral Student Dr. Steve Cramer, Assistant Professor, Neuroanatomy/Neuroscience Connie Pechmann, Professor, Marketing Paul Rodriguez, Research Specialist, Cognitive Science University of California, Irvine Funded by a clinical research grant from UCI’s General Clinical Research Center (GCRC)
  • 21.
    Background Cue ReactivityTheory (Carter & Tiffany 1999) Substance users exposed to environmental cues (visual, tactile, olfactory, etc.) Role of cues in addiction How this is related to marketing: Role marketing/ advertising plays in influencing behavior Especially for vulnerable populations, e.g. adolescents
  • 22.
    Method Event-Related fMRI(3T) 6 subjects 14 – 25 years old 2 groups: smokers and non-smokers Stimuli Cigarette ads Non-cigarette ads Matched to cig ads Neutral images
  • 23.
    Cigarette Ads Adsfrom 1998 - 2000 40 images Marlboro, Newport, Camel, Winston, Salem, Virginia Slims, Lucky Strike Source: Pollay Tobacco Ad Collection
  • 24.
    Neutral Ads Adsfrom 1999 - 2005 Matched in color, theme, etc. 40 images
  • 25.
    Neutral Images InternationalAffective Picture System (Lang 1997) 40 images
  • 26.
  • 27.
  • 28.
  • 29.
  • 30.
    Neural Predictors ofPurchases Knutson, Rick, Wimmer, Prelec and Loewenstein, Neuron, 2007 Investigates how people process preference and price when buying Decision to purchase Tradeoff between pleasure of acquisition and pain of paying Positive and negative anticipatory affect Determine the distinct neural components of the purchase decision process in individuals
  • 31.
  • 32.
    Experimental Design Event-relatedfMRI SHOP = Save Holdings Or Purchase task 26 adults Endowed $20 to spend on range of products 80 products; $8-$80 Subjects purchased about 30% of products
  • 33.
    Results Nucleus accumbens(NAcc) Anticipation of financial gains Correlated with product preference Evaluating rewards and craving Insula Implicated in anticipation of loss (Paulus & Stein 2006) Correlated with excessive prices Mesial prefrontal cortex (MPFC) Implicated with integrating gains and losses Correlated with reduced prices
  • 34.
    Results Study showssome evidence of regions that can predict purchasing Preference elicits activation in NAcc prior to purchase decision Excessive prices elicits insula activation and MPFC deactivation Preference as potential gain and price as potential cost
  • 35.
  • 36.
    Investment Behavior andthe Negative Side of Emotion Shiv, Loewenstein, Bechara, Damasio, and Damasio, Psychological Science, 2005 Do emotions cause poor investment decisions? Compared subjects with stable focal brain lesions disabling emotional regions with control patients with no impairment 19 normal subjects, 15 lesion patients with damage in emotional regions, 7 lesion controls with damage in non-emotion related regions
  • 37.
    Investment Game Participantstold they would making several rounds of investment decisions Endowed with $20 play money Choose between 2 options: invest or don’t invest If invest, give $1 to researcher; if not, keep $1 Researcher will flip coin If heads, then lose $1 If tails, then get $2.50 Rational choice: Always invest!! EV of investing is higher than not investing
  • 38.
    Results Lesion patientswith emotional neural damage make more advantageous investment decisions than normal subjects Target patients invested consistently across rounds; controls/normal subjects increasingly declined to invest
  • 39.
    The Neurobiology ofTrust Zak, Kurzban & Matzner, Annals of New York Academy of Science, 2004 Do hormones, such as oxytocin, regulate trust behavior? Oxytocin Neuropeptide involved in social recognition and bonding Trust game Subjects arranged into DM1-DM2 dyads DM1 asked to split $10 Decision will determine how much they earn 28 mL of blood drawn after each decision 2 conditions: Intention and random draw
  • 40.
    Trust Game Atnode A, the investor has the option of either path Moving left ends the game with the outcomes: $0 to the Trustee and $10 to the Investor Moving right allows trustee to move (after investment is increased) Trustee can choose either path at node B Once trustee moves the game ends and payoffs are distributed (McCabe 2003a) A: Investor B: Trustee $0 $10 $15 $15 $0 $30
  • 41.
    Results Oxytocin (OT)levels were higher (2x) with an intentional trust signal from DM1s in DM2s than in random draw condition Also, behavior changed with an intentional trust signal DM2s returned 53% of the money they received vs. 18% in the random draw condition
  • 42.
  • 43.
  • 44.
    Marketing Actions CanModulate Neural Representations of Experienced Pleasantness Plassman, O’Doherty, Shiv and Rangel, PNAC, 2008 Do the changes in the price of a product affect neural representations of experienced pleasantness = price/quality effect Subjects were scanned while taste testing red wines that they believed were different and sold at different prices
  • 45.
  • 46.
    Results Increasing theprice of a wine increased subjective reports of flavor pleasantness Increased BOLD activity in the medial orbitofrontal cortex, believed to encode for experienced pleasantness Study shows that marketing actions modulate neural correlates of experienced pleasantness
  • 47.
    Criticisms Theory? Preferencefor existing models Press coverage Consumer concern Commercial ventures
  • 48.
    Recommended Reading “Neuroeconomics: How Neuroscience Can Inform Economics” Colin F. Camerer, George Loewenstein, and Drazen Prelec (2005) Journal of Economic Literature 43(1): 9. “ What Can Advertisers Learn from Neuroscience?” Hilke Plassmann, Tim Ambler, Sven Braeutigam, and Peter Kenning (2007) International Journal of Advertising 26(2): 151-75. The Secret Life of the Brain , PBS
  • 49.

Editor's Notes

  • #2 Table 1. Activation Foci for Neutral Ads RegionZ ScoreTalairach Coordinates Left Cerebrum, Frontal Lobe, Sub-Gyral3.55-22, -22, 34Right Cerebrum, Frontal Lobe, Sub-Gyral3.4524, -12, 32Left Cerebrum, Frontal Lobe, Inferior Frontal Gyrus, Brodmann area 453.44-46, 20, 12Cerebrum, Frontal Lobe, Inferior Frontal Gyrus, Brodmann area 473.14-40, 24, 2Left Cerebrum, Occipital Lobe, Lingual Gyrus3.32-18, -42, -2Left Cerebrum, Limbic Lobe, Parahippocampal Gyrus, Brodmann area 353.22-18, -34, -8Left Cerebrum, Limbic Lobe, Parahippocampal Gyrus,3.08-32, -50, -6Right Cerebrum, Sub-lobar, Caudate, Caudate Body3.2914, 2, 20Right Cerebrum, Sub-lobar, Extra-Nuclear, Corpus Callosum3.276, 24, 10Right Cerebrum, Parietal Lobe, Postcentral Gyrus, Brodmann area 433.2662, -8, 14Right Cerebrum, Parietal Lobe, Precuneus2.7626, -62, 38Left Cerebrum, Limbic Lobe, Anterior Cingulate3.12-8, 32, 20Left Cerebrum, Parietal Lobe, Precuneus3.00-12, -56, 50