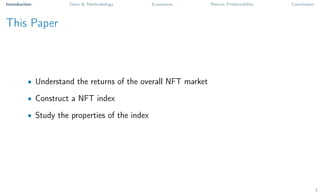
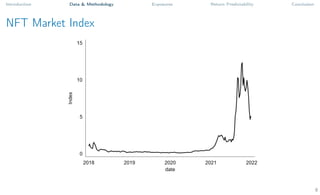
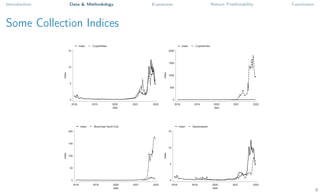
- The paper analyzes the economics of non-fungible tokens (NFTs) by constructing an NFT market index and studying its properties.
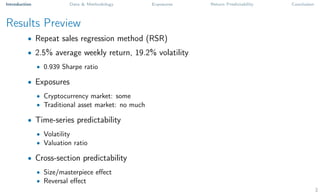
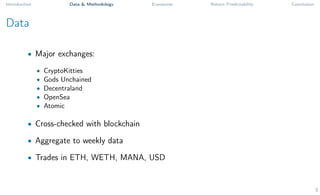
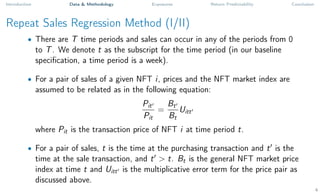
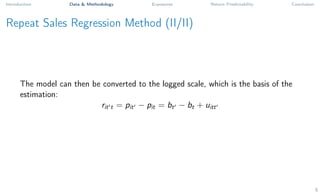
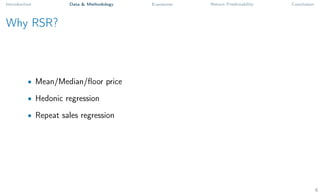
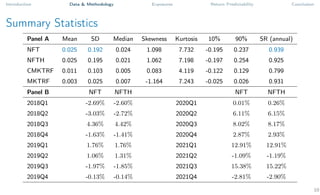
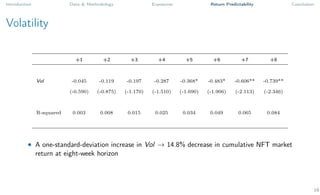
- Using a repeat sales regression method, the analysis finds an average weekly return of 2.5% for the NFT market index, with a volatility of 19.2% and a Sharpe ratio of 0.939.
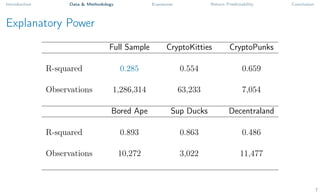
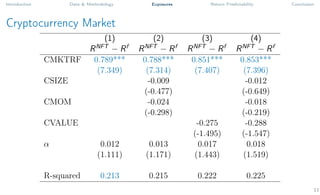
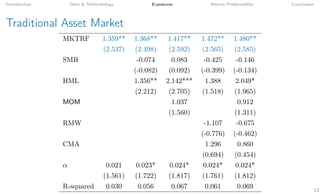
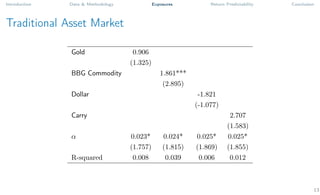
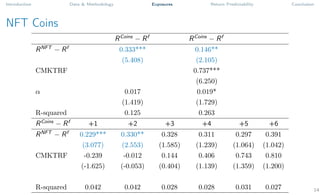
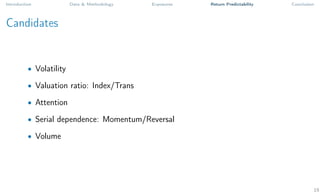
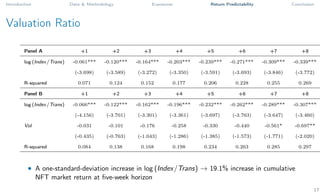
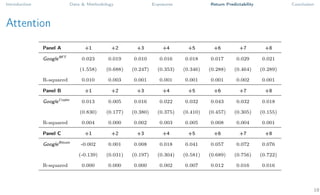
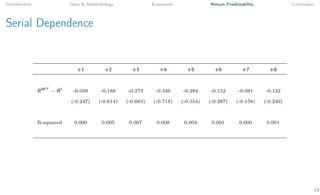
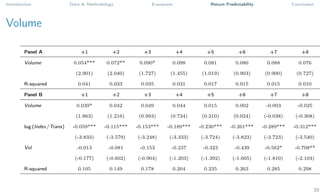
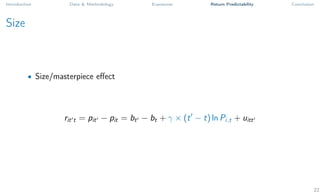
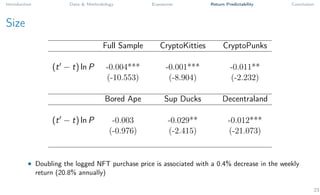
- The results show some exposure between the NFT market and cryptocurrency markets, but little exposure to traditional asset markets. Various factors like volatility, valuation ratios, and volume show some degree of return predictability in the NFT market.


![[DSC Europe 24] Milan Zdravkovic - Can Memes Beat the market.pptx](https://cdn.slidesharecdn.com/ss_thumbnails/dsceurope24milanzdravkovic-canmemesbeatthemarket-241208142443-b4d8dd32-thumbnail.jpg?width=640&height=640&fit=bounds)


![Ramakrishna ramaramaramaramaramaramatamara_ppt[1].pptx](https://cdn.slidesharecdn.com/ss_thumbnails/ramakrishnappt1-250716143454-5bb065c4-thumbnail.jpg?width=640&height=640&fit=bounds)


