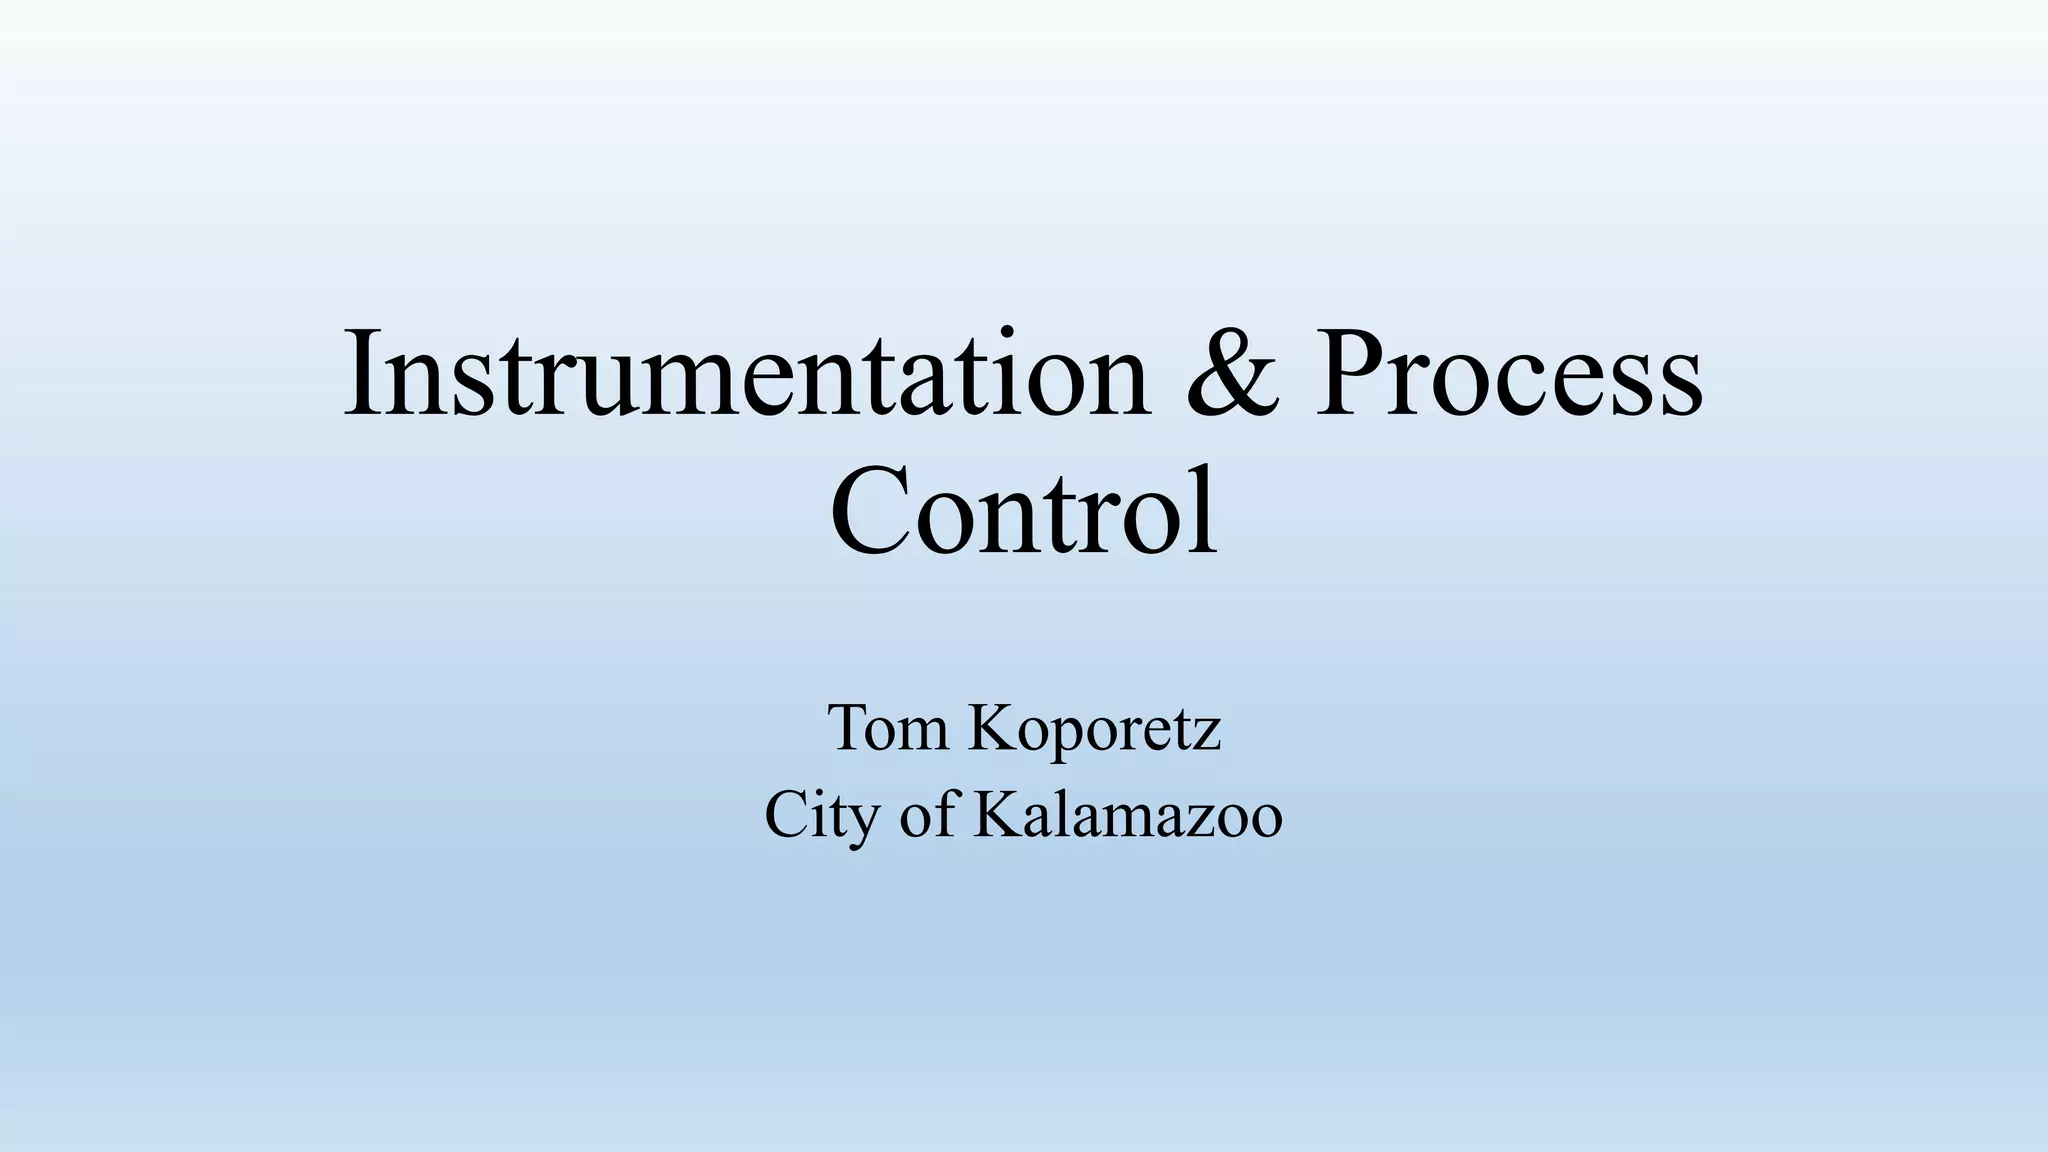
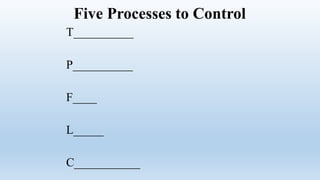
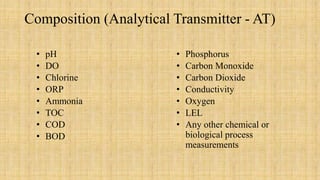
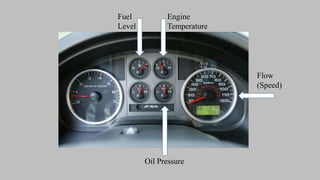
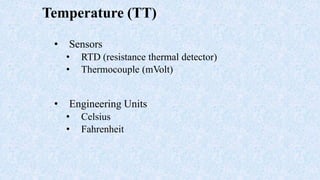
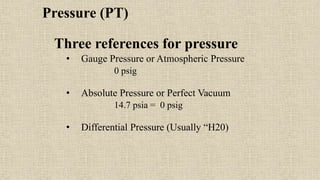
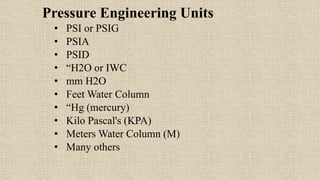
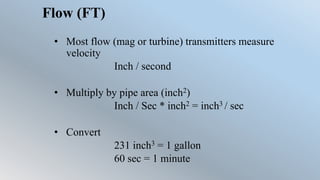
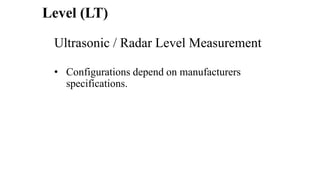
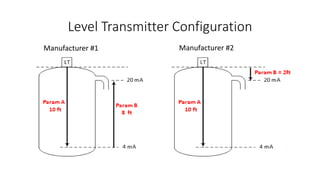
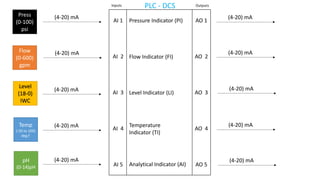
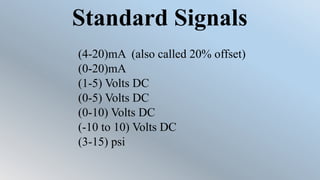
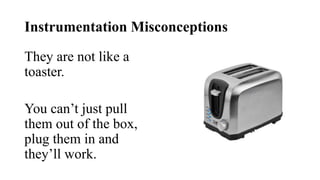
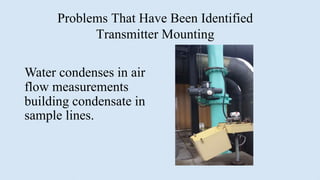
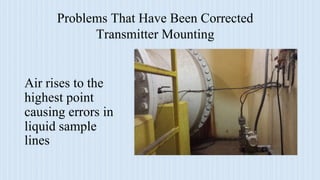
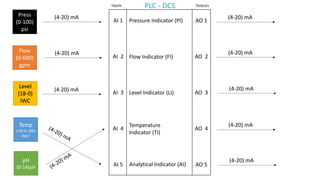
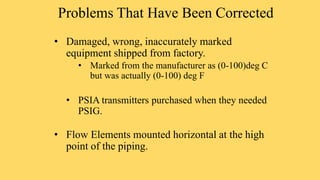
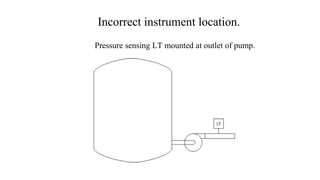
Instrumentation & Process
Control
Tom Koporetz
City of Kalamazoo
Five Processes to Control
T__________
P__________
F____
L_____
C___________
Five Processes to Control
Temperature
P__________
F____
L_____
C___________
Five Processes to Control
Temperature
Pressure
F____
L_____
C___________
Five Processes to Control
Temperature
Pressure
Flow
L_____
C___________
Five Processes to Control
Temperature
Pressure
Flow
Level
C___________
Five Processes to Control
Temperature
Pressure
Flow
Level
Composition
Composition (Analytical Transmitter - AT)
• pH
• DO
• Chlorine
• ORP
• Ammonia
• TOC
• COD
• BOD
• Phosphorus
• Carbon Monoxide
• Carbon Dioxide
• Conductivity
• Oxygen
• LEL
• Any other chemical or
biological process
measurements
Ron Janssen will discuss the analytical controls and
how they relate to the waste water treatment process
and some of the control schemes we use.
I will discuss general details of the remaining four
processes, Temperature, Pressure, Flow, and Level
A classic example of these processes in every day life
Fuel
Level
Engine
Temperature
Oil Pressure
Flow
(Speed)
A typical example of a PID control loop
that everyone can understand is cruise
control.
• Gas pedal says where it needs to be on a flat
surface.
• When you start to go up a hill the gas pedal goes
down to maintain the speed set point.
• When you start to go down hill the gas pedal backs
off to try and maintain the speed set point.
Temperature (TT)
• Sensors
• RTD (resistance thermal detector)
• Thermocouple (mVolt)
• Engineering Units
• Celsius
• Fahrenheit
Pressure (PT)
Three references for pressure
• Gauge Pressure or Atmospheric Pressure
0 psig
• Absolute Pressure or Perfect Vacuum
14.7 psia = 0 psig
• Differential Pressure (Usually “H20)
Pressure Engineering Units
• PSI or PSIG
• PSIA
• PSID
• “H2O or IWC
• mm H2O
• Feet Water Column
• “Hg (mercury)
• Kilo Pascal's (KPA)
• Meters Water Column (M)
• Many others
Flow (FT)
• Most flow (mag or turbine) transmitters measure
velocity
Inch / second
• Multiply by pipe area (inch2)
Inch / Sec * inch2 = inch3 / sec
• Convert
231 inch3 = 1 gallon
60 sec = 1 minute
Transmitters are identified by
the Process they Measure,
NOT their Principle of
Operation.
Flow (FT)
A Differential Pressure transmitter used to measure
Flow is identified as a Flow Transmitter (FT).
Level (LT)
Pressure (weight) of liquid column.
• A pressure transmitter used to measure the
process of level is identified as a Level
Transmitter (LT)
Pressure Sensing Level (LT)
Level (LT)
Ultrasonic / Radar Level Measurement
• Configurations depend on manufacturers
specifications.
Level Transmitter Configuration
Manufacturer #1 Manufacturer #2
Temp
(-50 to 100)
deg F
Press
(0-100)
psi
Flow
(0-600)
gpm
Level
(18-0)
IWC
pH
(0-14)pH
(4-20) mA
(4-20) mA
(4-20) mA
(4-20) mA
(4-20) mA
AI 1
AI 2
AI 3
AI 4
AI 5
AO 1
AO 2
AO 3
AO 4
AO 5
Inputs Outputs
(4-20) mA
(4-20) mA
(4-20) mA
(4-20) mA
(4-20) mA
Pressure Indicator (PI)
Flow Indicator (FI)
Level Indicator (LI)
Temperature
Indicator (TI)
Analytical Indicator (AI)
PLC - DCS
Standard Signals
(4-20)mA (also called 20% offset)
(0-20)mA
(1-5) Volts DC
(0-5) Volts DC
(0-10) Volts DC
(-10 to 10) Volts DC
(3-15) psi
My first lesson in my first
computer class in 1974
Garbage In
Garbage Out
You can’t make
good decisions
with bad
information!
Instrumentation Misconceptions
They are not like a
toaster.
You can’t just pull
them out of the box,
plug them in and
they’ll work.
Instrumentation Reality
• Smart Pressure Transmitter – 50 parameters to utilize
• Smart Flow Transmitters – 75 parameters to utilize
• Frequency Drive – 300 parameters to utilize
• Ultrasonic Level Transmitter – 100 parameters to utilize
•You can get the configuration 98% right and it
will function 100% wrong.
Problems That Have Been Identified
Transmitter Mounting
Water condenses in air
flow measurements
building condensate in
sample lines.
Problems That Have Been Corrected
Transmitter Mounting
Air rises to the
highest point
causing errors in
liquid sample
lines
Problems That Have Been
Corrected
• Transmitters wired incorrectly
• pH and Temperature signal wires swapped
Temp
(-50 to 100)
deg F
Press
(0-100)
psi
Flow
(0-600)
gpm
Level
(18-0)
IWC
pH
(0-14)pH
(4-20) mA
(4-20) mA
(4-20) mA
AI 1
AI 2
AI 3
AI 4
AI 5
AO 1
AO 2
AO 3
AO 4
AO 5
Inputs Outputs
(4-20) mA
(4-20) mA
(4-20) mA
(4-20) mA
(4-20) mA
Pressure Indicator (PI)
Flow Indicator (FI)
Level Indicator (LI)
Temperature
Indicator (TI)
Analytical Indicator (AI)
PLC - DCS
Problems That Have Been Corrected
• Misconfiguration of frequency drives.
• Too long to discuss
• Bad mapping of data to and from SCADA, PLC,
or DCS
• A Flow Transmitter wired to first PLC, mapped on to second
PLC then mapped to DCS. 600 gpm simulation indicated as
540 gpm. 10% error since initial installation.
• Three freq drives and set points mapped wrong.
• 50% signal divided by 10 and ran at 5%
Problems That Have Been Corrected
• Square root extraction incorrectly used for flow
measurement with DP sensing.
• Thermocouples
• Red wire is negative.
• Extension wire must be thermocouple wire. Can
NOT use regular wire.
• Fail safe strategies not considered.
• If you unplug a signal and don’t get an alarm it’s not
designed fail safe.
Problems That Have Been Corrected
• Damaged, wrong, inaccurately marked
equipment shipped from factory.
• Marked from the manufacturer as (0-100)deg C
but was actually (0-100) deg F
• PSIA transmitters purchased when they needed
PSIG.
• Flow Elements mounted horizontal at the high
point of the piping.
Incorrect instrument location.
Pressure sensing LT mounted at outlet of pump.
Commissioning or Validation
Most of the above issues would have been
avoided with proper Commissioning or
Validation.
This process confirms the accuracy of data
from instruments to the SCADA screens and
from the SCADA screens to the instruments.
Commissioning or Validation
Most of the above issues would have been
avoided with proper Commissioning or
Validation.
This process confirms the accuracy of data
from instruments to the SCADA screens and
from the SCADA screens to the instruments.
This is what confirms you don’t have
“Garbage In”
Commissioning or Validation
Once you have confirmed there
is no “Garbage In” then control
schemes (programming) can be
implemented and tested.
You Don’t Have to Automate
Everything!
You Don’t Have to Automate
Everything!
• If it’s a simple process keep it simple.
You Don’t Have to Automate
Everything!
• If it’s a simple process keep it simple.
• You don’t need cruise control for a horse!
You Don’t Have to Automate
Everything!
• If it’s a simple process keep it simple.
• You don’t need cruise control for a horse!
• You don’t use cruise control in a blizzard.
You need to keep your hands on the wheel,
feet on the pedals and drive the car.
Ron Janssen will be next discussing
some of our control strategies.

6A._Koporetz_Tom_2-Instrumentation__Process_Control_custom_screen.pdf

  • 1.
    Instrumentation & Process Control TomKoporetz City of Kalamazoo
  • 2.
    Five Processes toControl T__________ P__________ F____ L_____ C___________
  • 3.
    Five Processes toControl Temperature P__________ F____ L_____ C___________
  • 4.
    Five Processes toControl Temperature Pressure F____ L_____ C___________
  • 5.
    Five Processes toControl Temperature Pressure Flow L_____ C___________
  • 6.
    Five Processes toControl Temperature Pressure Flow Level C___________
  • 7.
    Five Processes toControl Temperature Pressure Flow Level Composition
  • 8.
    Composition (Analytical Transmitter- AT) • pH • DO • Chlorine • ORP • Ammonia • TOC • COD • BOD • Phosphorus • Carbon Monoxide • Carbon Dioxide • Conductivity • Oxygen • LEL • Any other chemical or biological process measurements
  • 9.
    Ron Janssen willdiscuss the analytical controls and how they relate to the waste water treatment process and some of the control schemes we use. I will discuss general details of the remaining four processes, Temperature, Pressure, Flow, and Level A classic example of these processes in every day life
  • 10.
  • 11.
    A typical exampleof a PID control loop that everyone can understand is cruise control. • Gas pedal says where it needs to be on a flat surface. • When you start to go up a hill the gas pedal goes down to maintain the speed set point. • When you start to go down hill the gas pedal backs off to try and maintain the speed set point.
  • 12.
    Temperature (TT) • Sensors •RTD (resistance thermal detector) • Thermocouple (mVolt) • Engineering Units • Celsius • Fahrenheit
  • 13.
    Pressure (PT) Three referencesfor pressure • Gauge Pressure or Atmospheric Pressure 0 psig • Absolute Pressure or Perfect Vacuum 14.7 psia = 0 psig • Differential Pressure (Usually “H20)
  • 14.
    Pressure Engineering Units •PSI or PSIG • PSIA • PSID • “H2O or IWC • mm H2O • Feet Water Column • “Hg (mercury) • Kilo Pascal's (KPA) • Meters Water Column (M) • Many others
  • 15.
    Flow (FT) • Mostflow (mag or turbine) transmitters measure velocity Inch / second • Multiply by pipe area (inch2) Inch / Sec * inch2 = inch3 / sec • Convert 231 inch3 = 1 gallon 60 sec = 1 minute
  • 16.
    Transmitters are identifiedby the Process they Measure, NOT their Principle of Operation.
  • 17.
    Flow (FT) A DifferentialPressure transmitter used to measure Flow is identified as a Flow Transmitter (FT).
  • 18.
    Level (LT) Pressure (weight)of liquid column. • A pressure transmitter used to measure the process of level is identified as a Level Transmitter (LT)
  • 19.
  • 20.
    Level (LT) Ultrasonic /Radar Level Measurement • Configurations depend on manufacturers specifications.
  • 21.
  • 22.
    Temp (-50 to 100) degF Press (0-100) psi Flow (0-600) gpm Level (18-0) IWC pH (0-14)pH (4-20) mA (4-20) mA (4-20) mA (4-20) mA (4-20) mA AI 1 AI 2 AI 3 AI 4 AI 5 AO 1 AO 2 AO 3 AO 4 AO 5 Inputs Outputs (4-20) mA (4-20) mA (4-20) mA (4-20) mA (4-20) mA Pressure Indicator (PI) Flow Indicator (FI) Level Indicator (LI) Temperature Indicator (TI) Analytical Indicator (AI) PLC - DCS
  • 23.
    Standard Signals (4-20)mA (alsocalled 20% offset) (0-20)mA (1-5) Volts DC (0-5) Volts DC (0-10) Volts DC (-10 to 10) Volts DC (3-15) psi
  • 24.
    My first lessonin my first computer class in 1974
  • 25.
  • 26.
    You can’t make gooddecisions with bad information!
  • 27.
    Instrumentation Misconceptions They arenot like a toaster. You can’t just pull them out of the box, plug them in and they’ll work.
  • 28.
    Instrumentation Reality • SmartPressure Transmitter – 50 parameters to utilize • Smart Flow Transmitters – 75 parameters to utilize • Frequency Drive – 300 parameters to utilize • Ultrasonic Level Transmitter – 100 parameters to utilize •You can get the configuration 98% right and it will function 100% wrong.
  • 29.
    Problems That HaveBeen Identified Transmitter Mounting Water condenses in air flow measurements building condensate in sample lines.
  • 30.
    Problems That HaveBeen Corrected Transmitter Mounting Air rises to the highest point causing errors in liquid sample lines
  • 31.
    Problems That HaveBeen Corrected • Transmitters wired incorrectly • pH and Temperature signal wires swapped
  • 32.
    Temp (-50 to 100) degF Press (0-100) psi Flow (0-600) gpm Level (18-0) IWC pH (0-14)pH (4-20) mA (4-20) mA (4-20) mA AI 1 AI 2 AI 3 AI 4 AI 5 AO 1 AO 2 AO 3 AO 4 AO 5 Inputs Outputs (4-20) mA (4-20) mA (4-20) mA (4-20) mA (4-20) mA Pressure Indicator (PI) Flow Indicator (FI) Level Indicator (LI) Temperature Indicator (TI) Analytical Indicator (AI) PLC - DCS
  • 33.
    Problems That HaveBeen Corrected • Misconfiguration of frequency drives. • Too long to discuss • Bad mapping of data to and from SCADA, PLC, or DCS • A Flow Transmitter wired to first PLC, mapped on to second PLC then mapped to DCS. 600 gpm simulation indicated as 540 gpm. 10% error since initial installation. • Three freq drives and set points mapped wrong. • 50% signal divided by 10 and ran at 5%
  • 34.
    Problems That HaveBeen Corrected • Square root extraction incorrectly used for flow measurement with DP sensing. • Thermocouples • Red wire is negative. • Extension wire must be thermocouple wire. Can NOT use regular wire. • Fail safe strategies not considered. • If you unplug a signal and don’t get an alarm it’s not designed fail safe.
  • 35.
    Problems That HaveBeen Corrected • Damaged, wrong, inaccurately marked equipment shipped from factory. • Marked from the manufacturer as (0-100)deg C but was actually (0-100) deg F • PSIA transmitters purchased when they needed PSIG. • Flow Elements mounted horizontal at the high point of the piping.
  • 36.
    Incorrect instrument location. Pressuresensing LT mounted at outlet of pump.
  • 37.
    Commissioning or Validation Mostof the above issues would have been avoided with proper Commissioning or Validation. This process confirms the accuracy of data from instruments to the SCADA screens and from the SCADA screens to the instruments.
  • 38.
    Commissioning or Validation Mostof the above issues would have been avoided with proper Commissioning or Validation. This process confirms the accuracy of data from instruments to the SCADA screens and from the SCADA screens to the instruments. This is what confirms you don’t have “Garbage In”
  • 39.
    Commissioning or Validation Onceyou have confirmed there is no “Garbage In” then control schemes (programming) can be implemented and tested.
  • 40.
    You Don’t Haveto Automate Everything!
  • 41.
    You Don’t Haveto Automate Everything! • If it’s a simple process keep it simple.
  • 42.
    You Don’t Haveto Automate Everything! • If it’s a simple process keep it simple. • You don’t need cruise control for a horse!
  • 43.
    You Don’t Haveto Automate Everything! • If it’s a simple process keep it simple. • You don’t need cruise control for a horse! • You don’t use cruise control in a blizzard. You need to keep your hands on the wheel, feet on the pedals and drive the car.
  • 44.
    Ron Janssen willbe next discussing some of our control strategies.