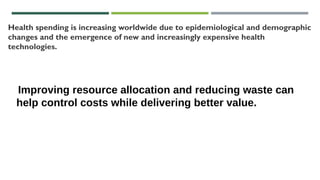
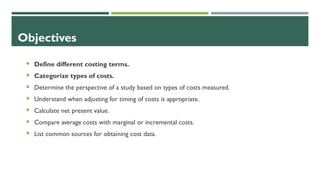
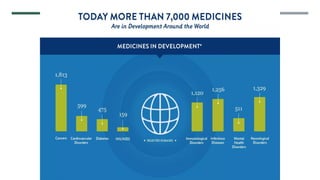
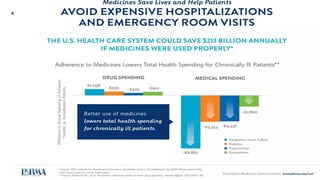
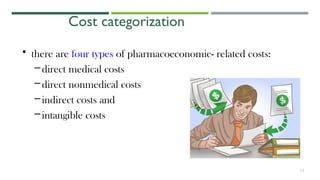
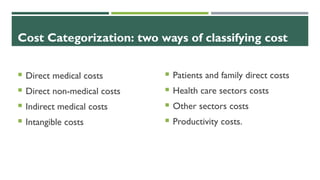
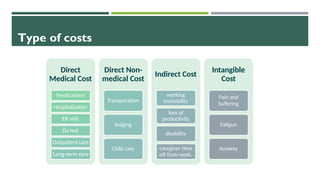
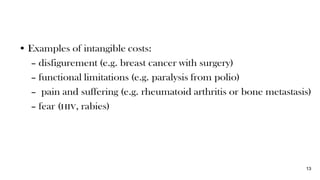
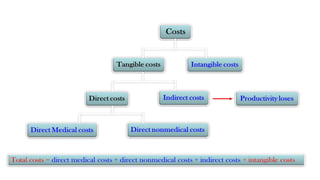
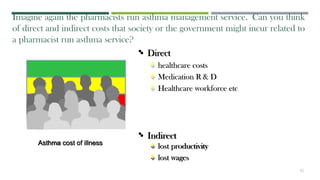
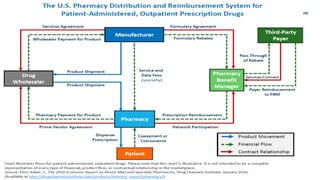
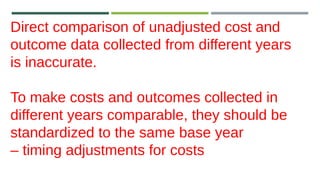
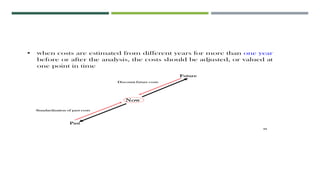
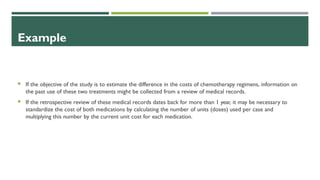
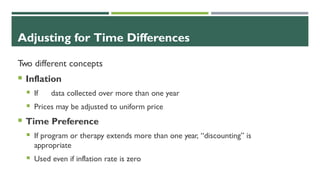
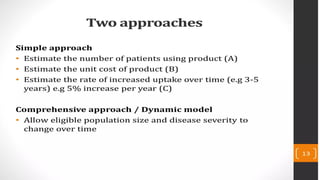
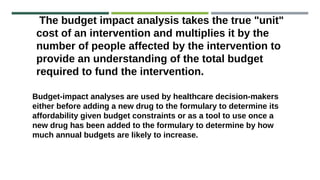
The document discusses the increasing global health spending due to demographic changes and costly health technologies, emphasizing the need for efficient resource allocation to control costs. It categorizes different types of health-related costs, including direct medical, non-medical, indirect, and intangible costs, and highlights the importance of measuring costs from various perspectives (patient, provider, payer, and society). Also addressed are methodologies for cost analysis, timing adjustments for costs, and the role of budget impact analyses in understanding the financial implications of new health technologies.


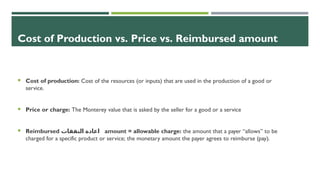
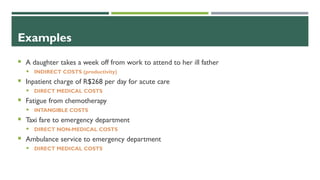
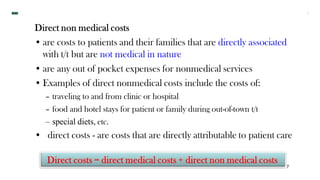
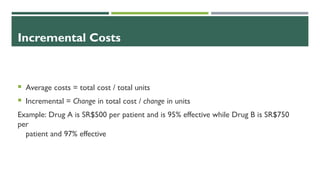
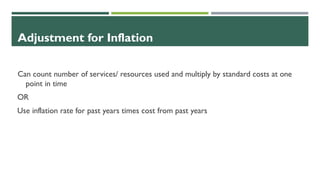
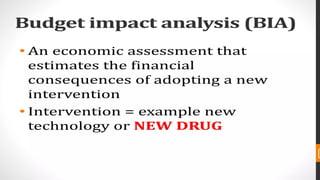
![Scarcity is the fundamental economic
problem that forces consumers and
producers to use resources wisely.
Unlimited Wants
NIPH & PNIPH – Budget Impact Analysis 57
Limit resources
Scarcity
Choices
For whom
to make it
What to
make
How to
make it
How does the concept of scarcity
apply to healthcare?
The fundamental economic problem
Recap
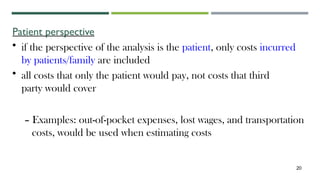
Sl ide from: Chola L, Heupink LF, Peacocke E, Sæterdal I (2020). Economic evaluation of public health interventions [PowerPoint
s l ides]. Norwegian Institute of Public Health, Oslo.](https://image.slidesharecdn.com/6costestimationpharm615-241003174648-d55dfc81/85/6-Cost-estimation-pharmcy-madtr-615-pptx-57-320.jpg)
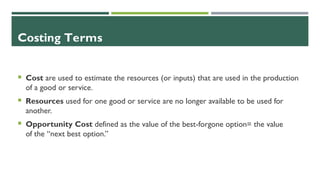
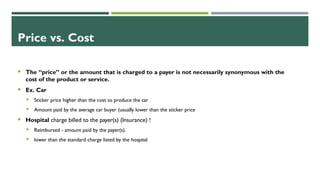
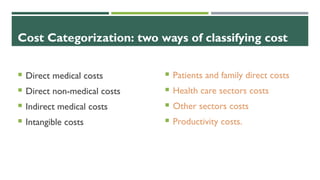
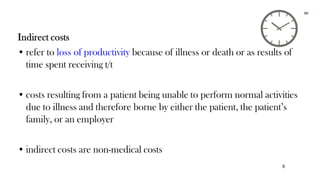
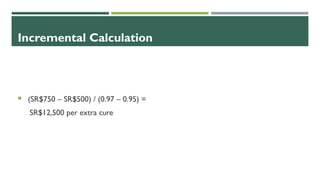
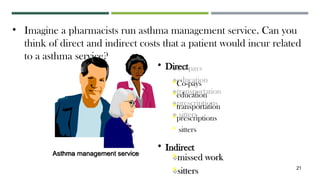
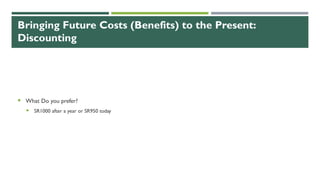
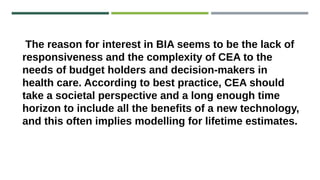
![The ‘Health Economic’ problem
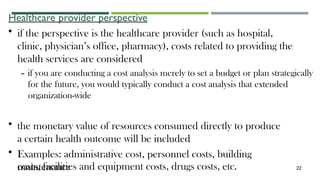
Recap
Unlimited healthcare “wants” with rapid growth in
health expenditure.
Insufficient health sector resources.
Choosing between ‘wants’ we can ‘afford’ given our
resource ‘budget’.
4
NIPH & PNIPH – Budget Impact Analysis
Sl ide from: Chola L, Heupink LF, Peacocke E, Sæterdal I (2020). Economic evaluation of public health interventions [PowerPoint
s l ides]. Norwegian Institute of Public Health, Os lo.
Sl ide from: Chola L, Heupink LF, Peacocke E, Sæterdal I (2020). Economic evaluation of public health interventions [PowerPoint
s l ides]. Norwegian Institute of Public Health, Oslo.](https://image.slidesharecdn.com/6costestimationpharm615-241003174648-d55dfc81/85/6-Cost-estimation-pharmcy-madtr-615-pptx-58-320.jpg)
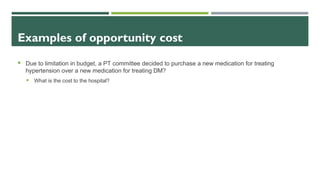
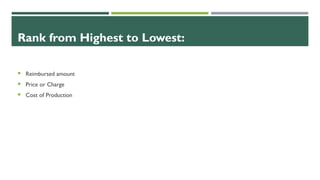
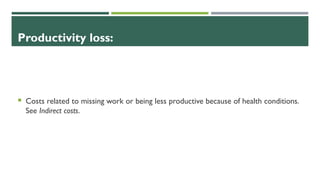
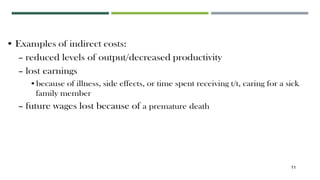
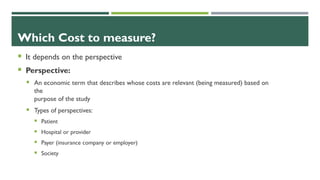
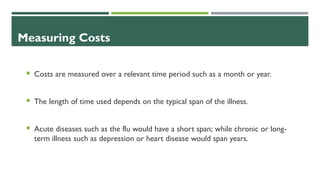
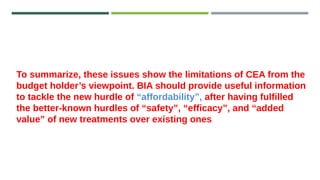
![How HTA can inform policy and priorities
BIA can be a part of an HTA to inform on the financial impact of a ‘new’ intervention
Financial and non-financial
levers for quality improvement
Quality
standards
Clinical
guidelines
and
pathways
HTA
Health technology assessment
(HTA) to compare clinical and cost-
effectiveness of different
interventions
Clinical guidelines and
pathways distilled from HTA and
other evidence
Quality standards and indicators
from evidence-based guidelines
Health benefits plans (HBPs), pay-for-
performance, other levers (regulation,
accreditation, education…)
Evidence
NIPH 2020 - Lithuania Workshop 6
Source: International Decision Support Initiative (iDSI)
Sl ide from: Chola L, Heupink LF, Peacocke E, Sæterdal I (2020). Economic evaluation of public health interventions [PowerPoint
s l ides]. Norwegian Institute of Public Health, Oslo.](https://image.slidesharecdn.com/6costestimationpharm615-241003174648-d55dfc81/85/6-Cost-estimation-pharmcy-madtr-615-pptx-59-320.jpg)


![제 23회 보아즈(BOAZ) 빅데이터 컨퍼런스 - [MBOAX] : ABSA를 활용한 소비자 반응 분석 기반 운영 효율화 대시보드 설계](https://cdn.slidesharecdn.com/ss_thumbnails/3-1boaz23rdconferencemboax-260203102709-9d519923-thumbnail.jpg?width=640&height=640&fit=bounds)


![Hacking-Uncovered-How-People-Get-Hacked-and-How-to-Stay-Safe[1].pptx](https://cdn.slidesharecdn.com/ss_thumbnails/hacking-uncovered-how-people-get-hacked-and-how-to-stay-safe1-260130170011-4883a9c7-thumbnail.jpg?width=640&height=640&fit=bounds)


