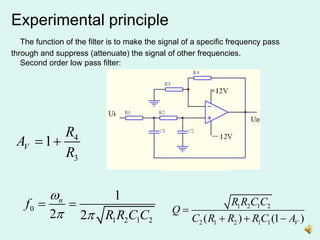
This document describes an experiment to measure the amplitude frequency characteristics of active low pass and high pass filters. The experiment involves:
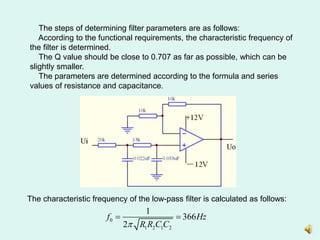
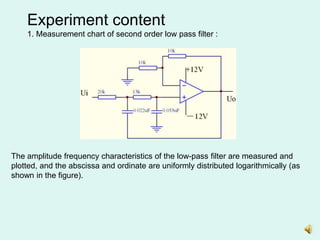
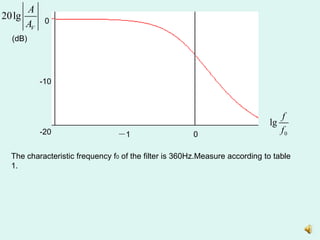
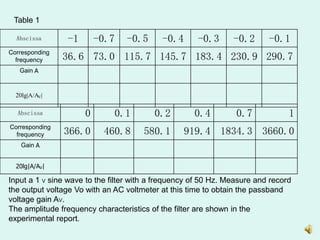
1) Measuring the output of a second-order low pass filter with a characteristic frequency of 360Hz in response to input sine waves of varying frequency.
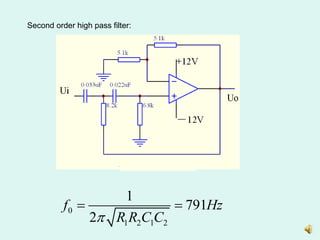
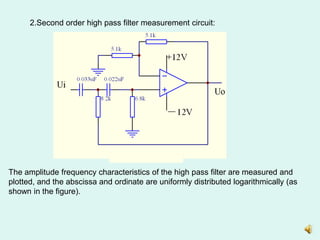
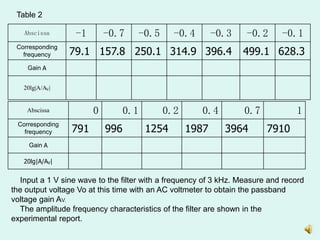
2) Measuring the output of a second-order high pass filter with a characteristic frequency of 791Hz in response to input sine waves of varying frequency.
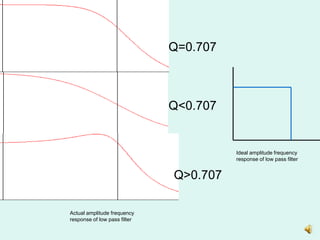
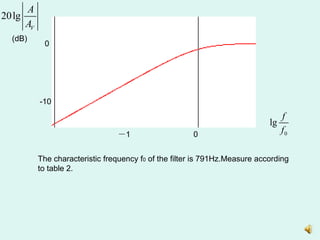
3) Plotting the amplitude frequency response curves of each filter on a logarithmic scale and determining the passband gain.