Download as PDF, PPTX
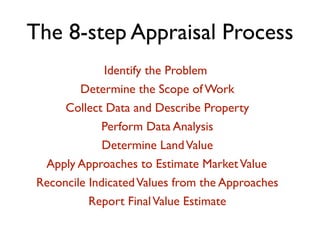
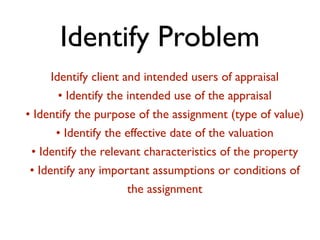
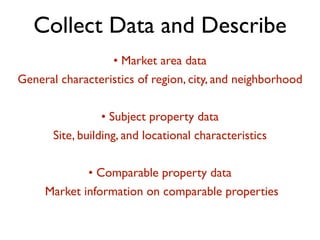
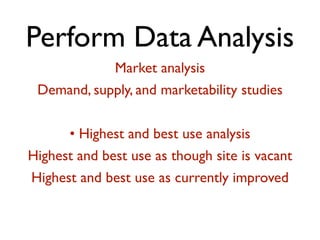
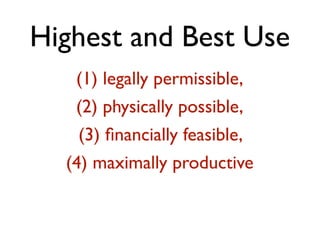
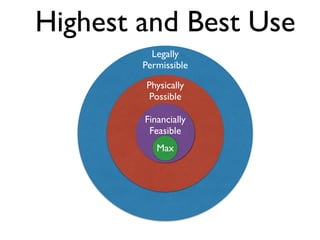
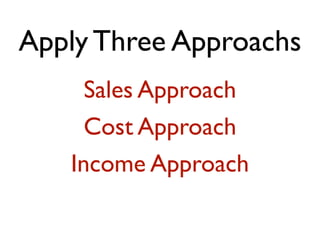
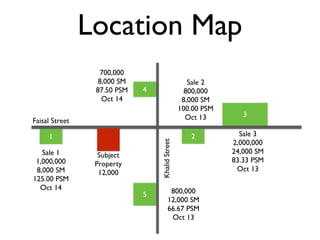
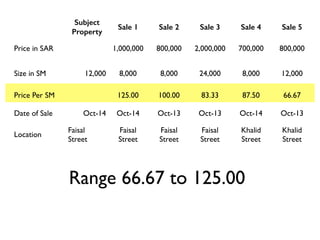
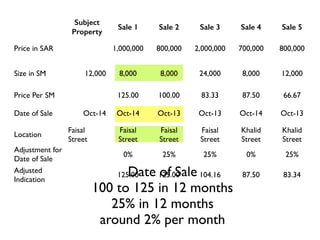
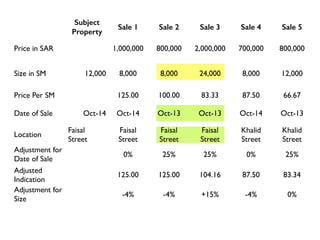
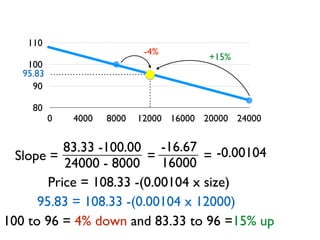
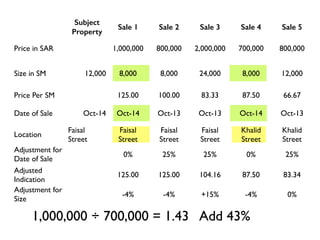
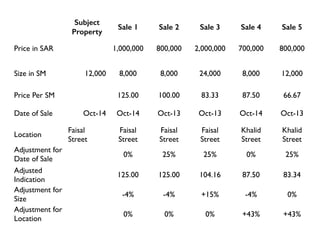
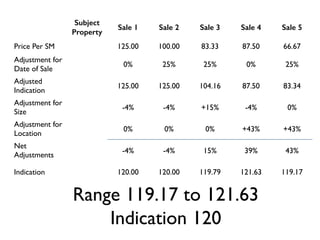
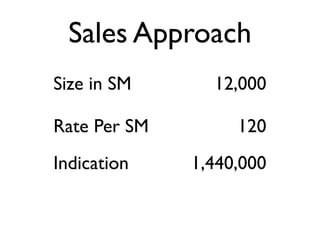
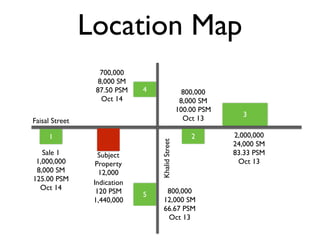
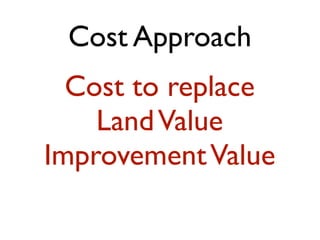
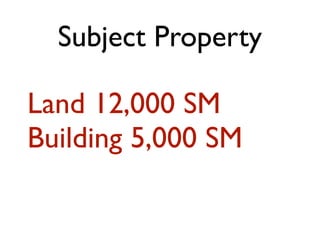
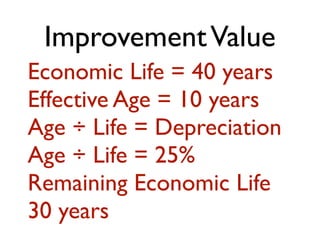
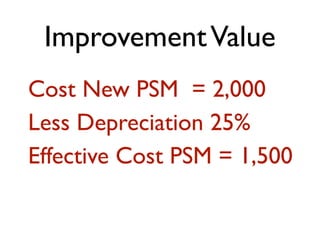
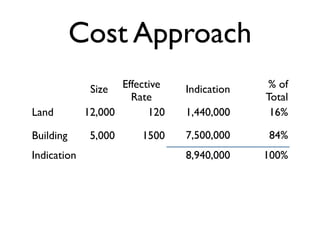

This document contains lecture slides on real estate analysis and appraisal. It discusses concepts like highest and best use, the three approaches to value (sales comparison, cost, and income), and the steps of the appraisal process including defining the problem, collecting data, analyzing the market, and reconciling values. It provides examples of comparable sales analyses for a case property, calculating indicated values under each approach and reconciling to a final estimate of market value.


