Download as PDF, PPTX


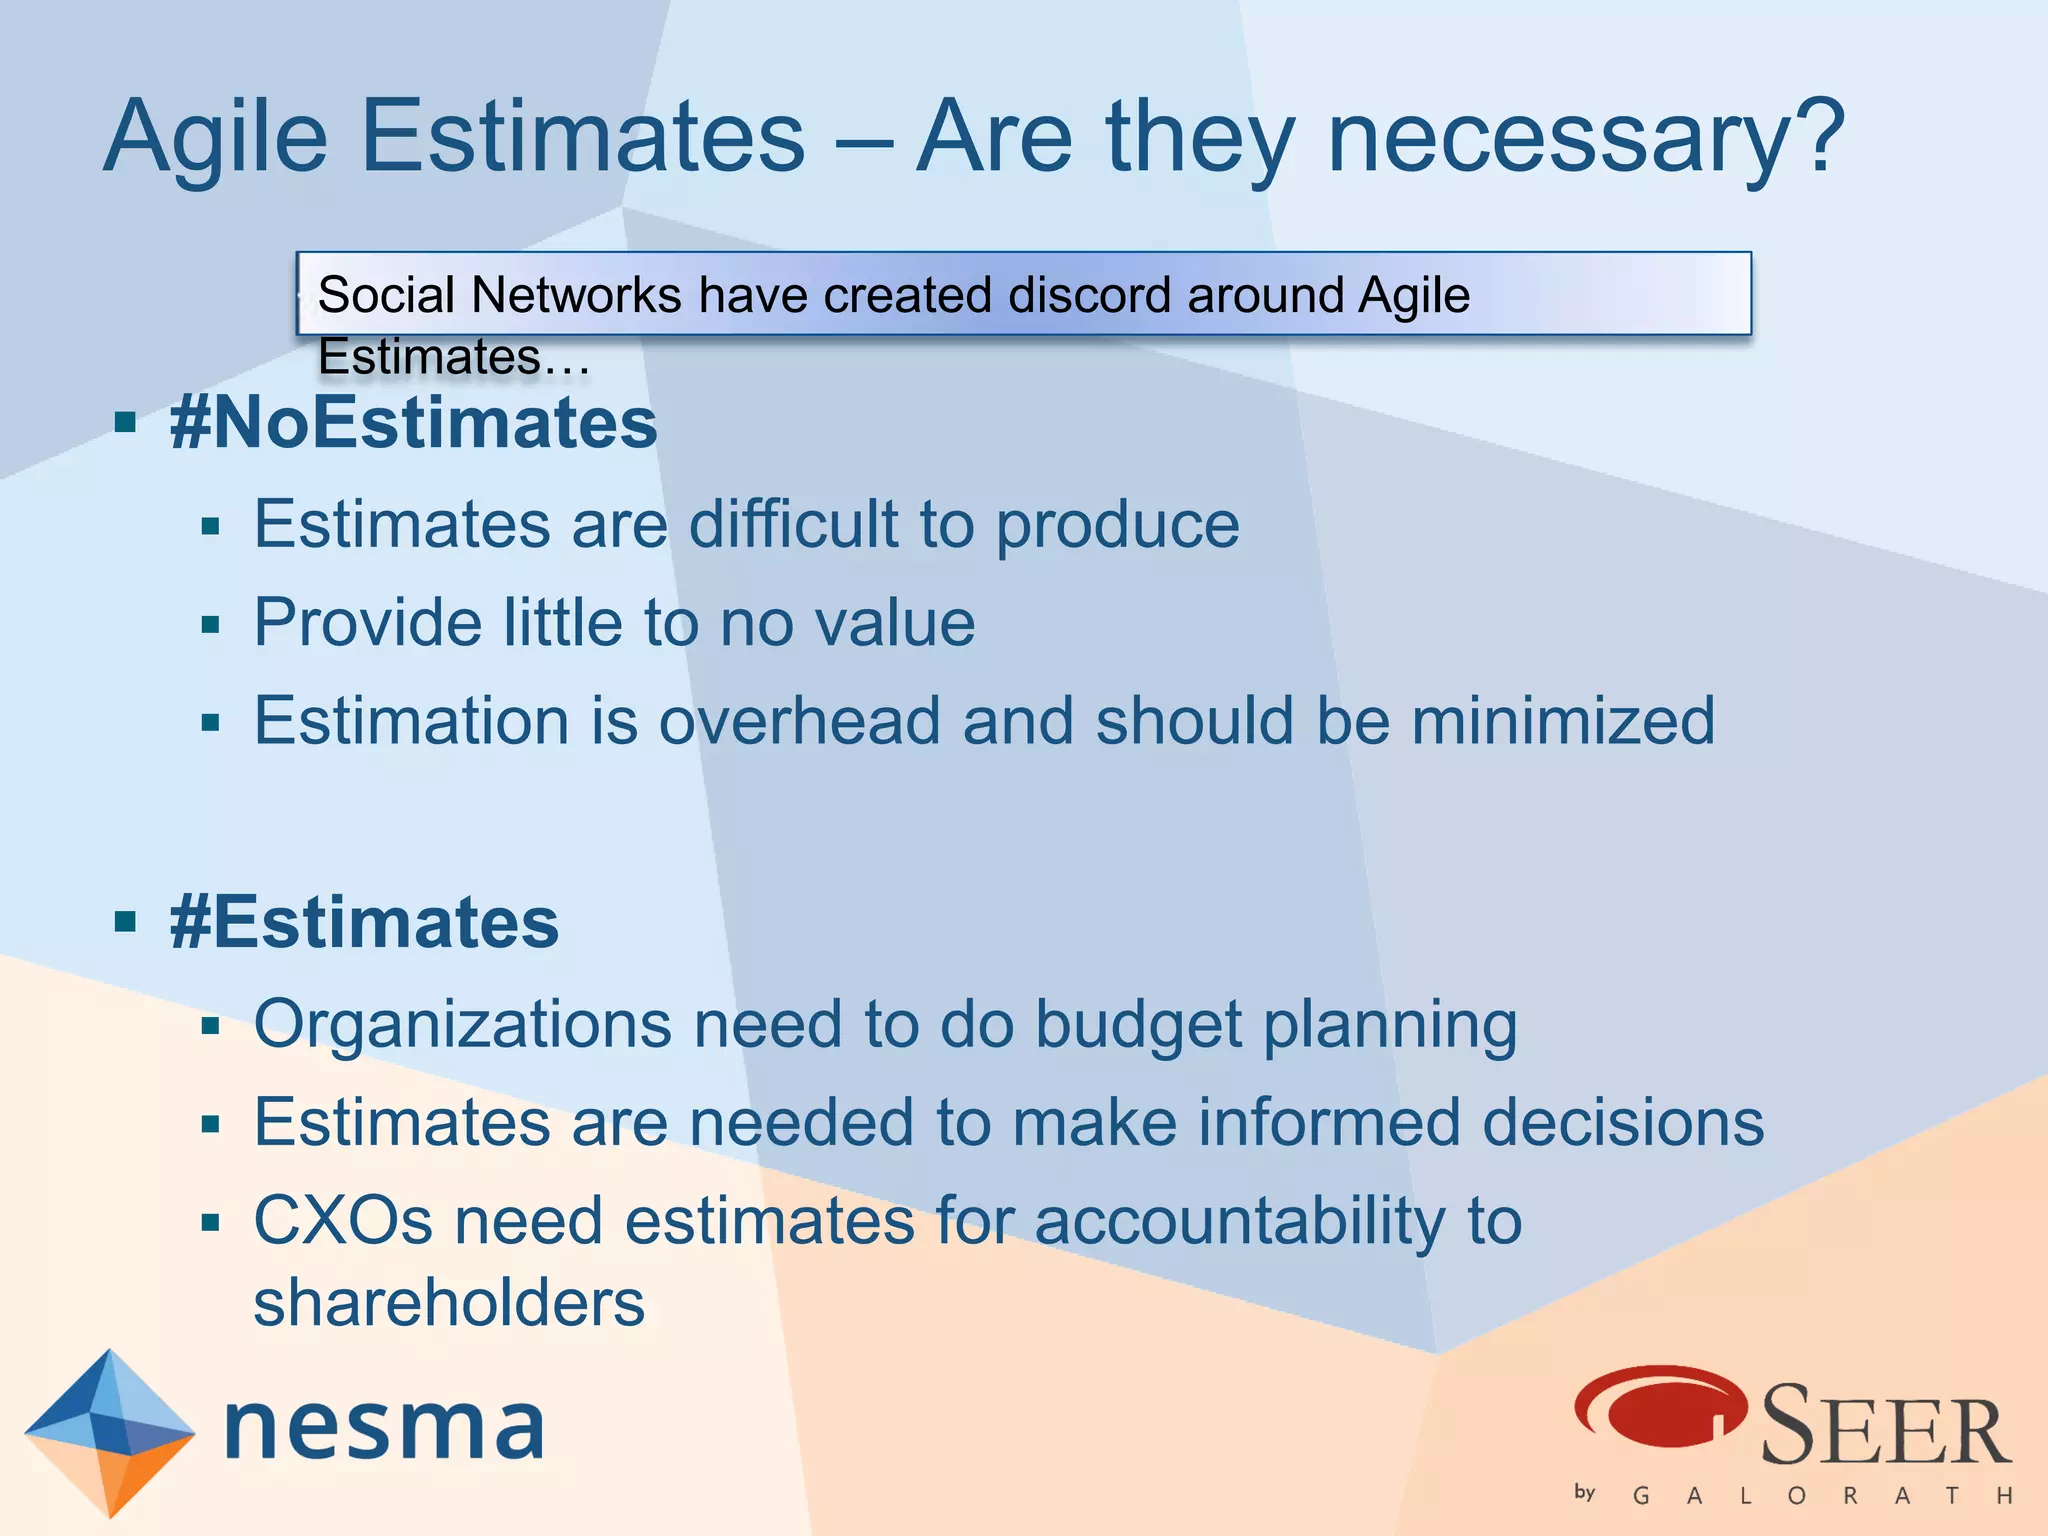
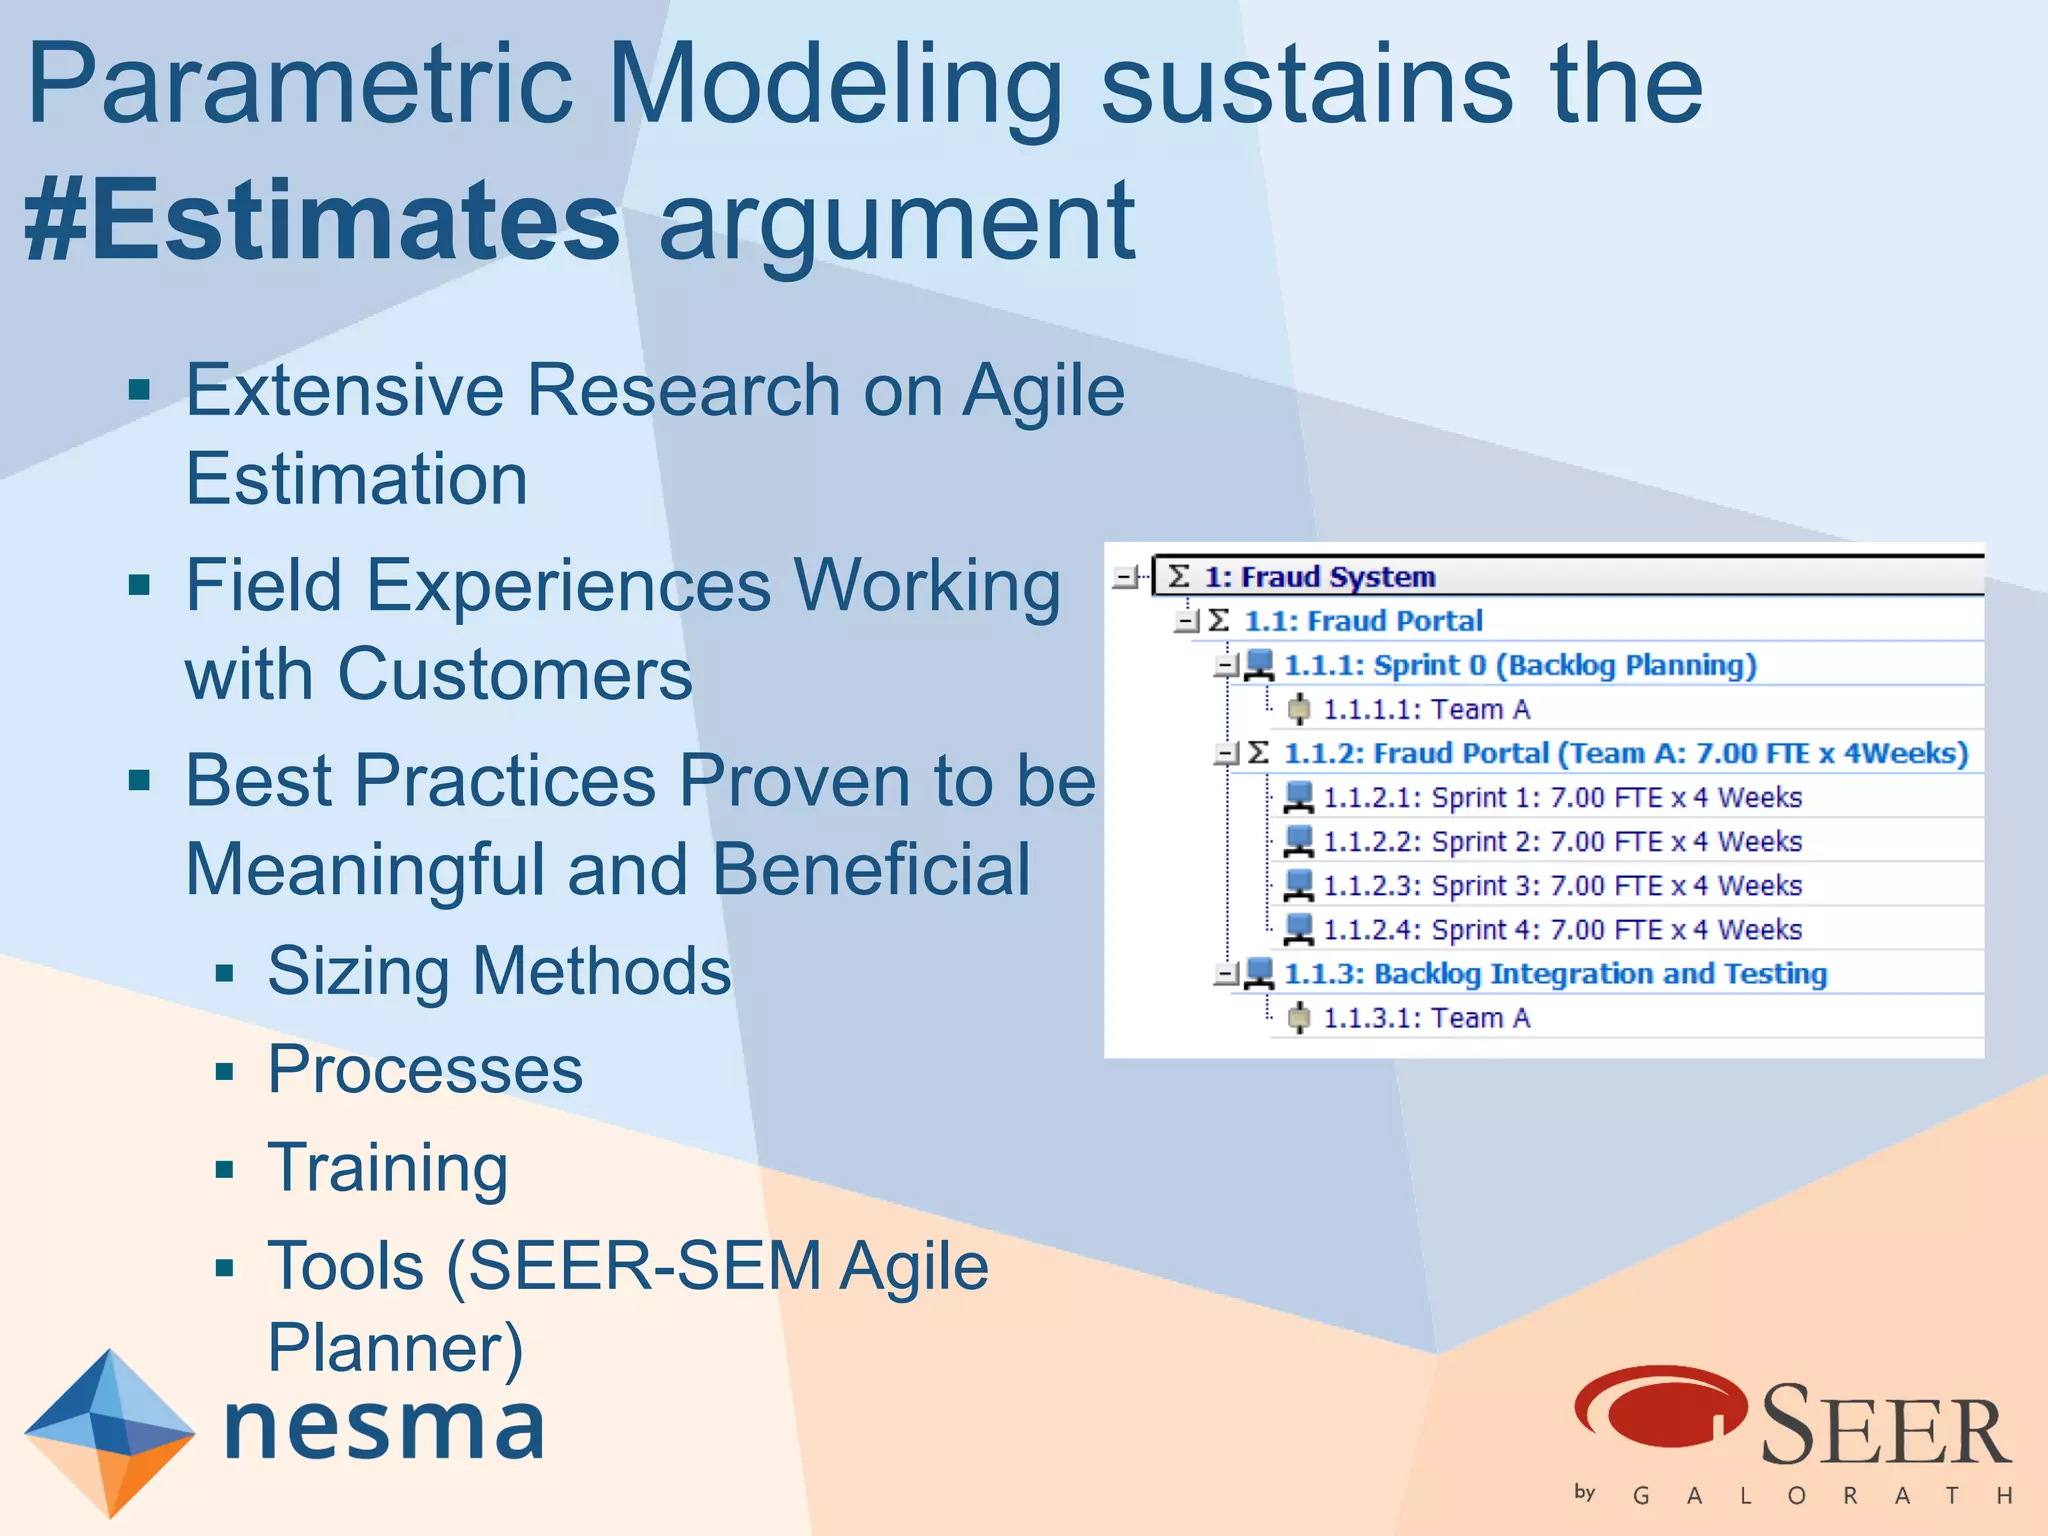
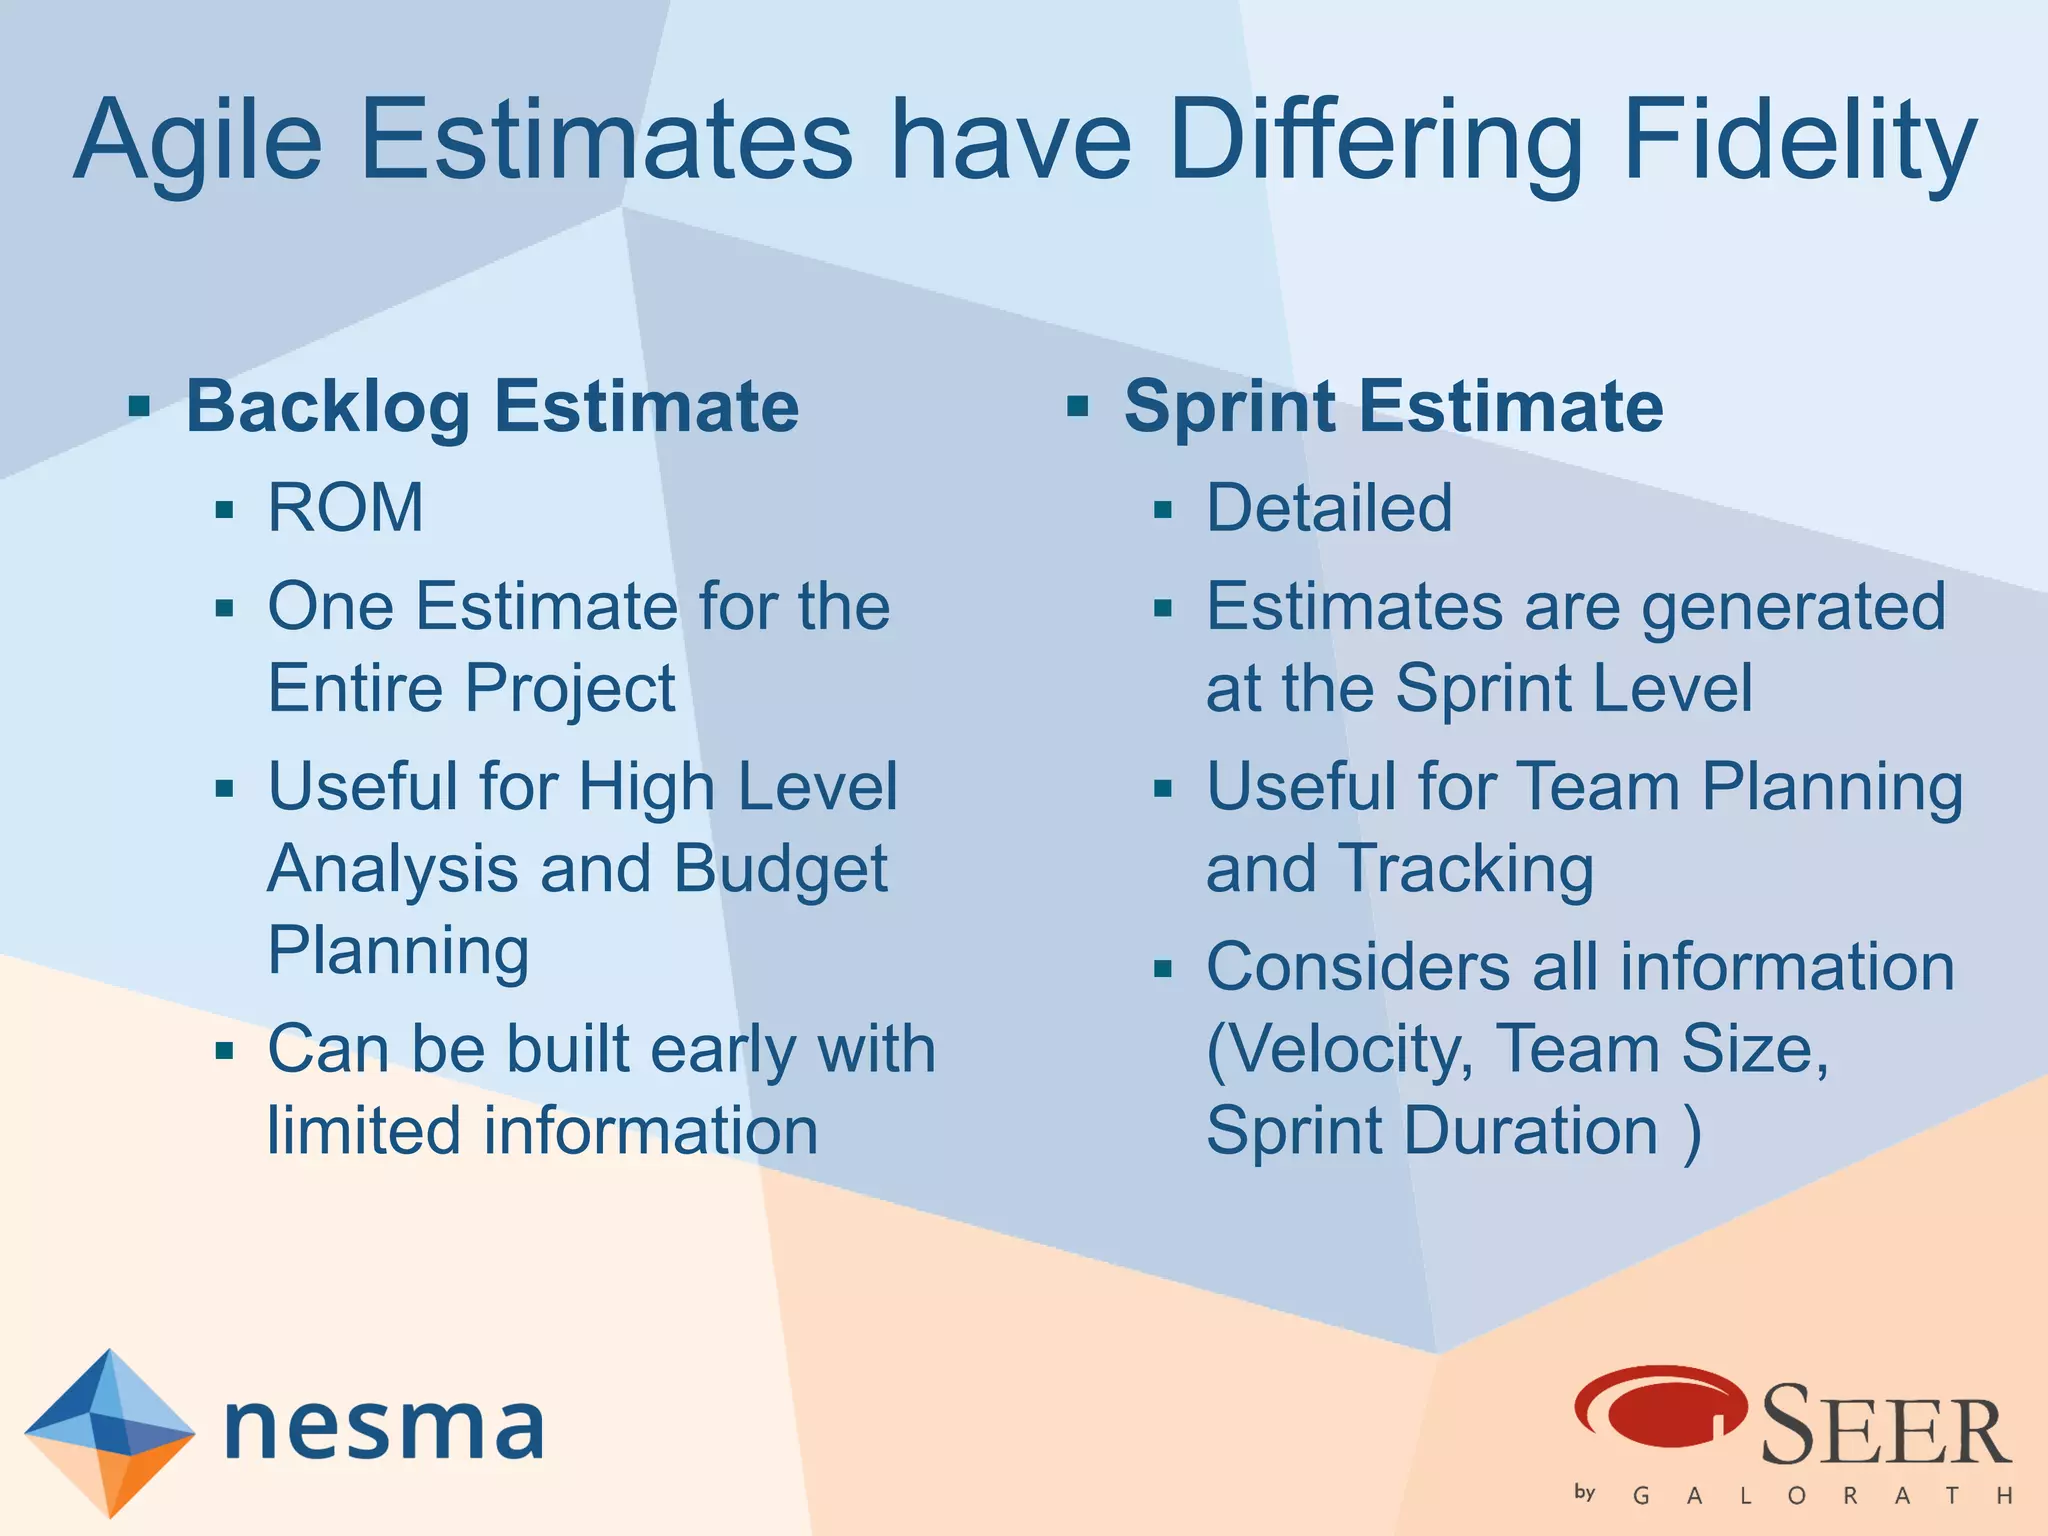
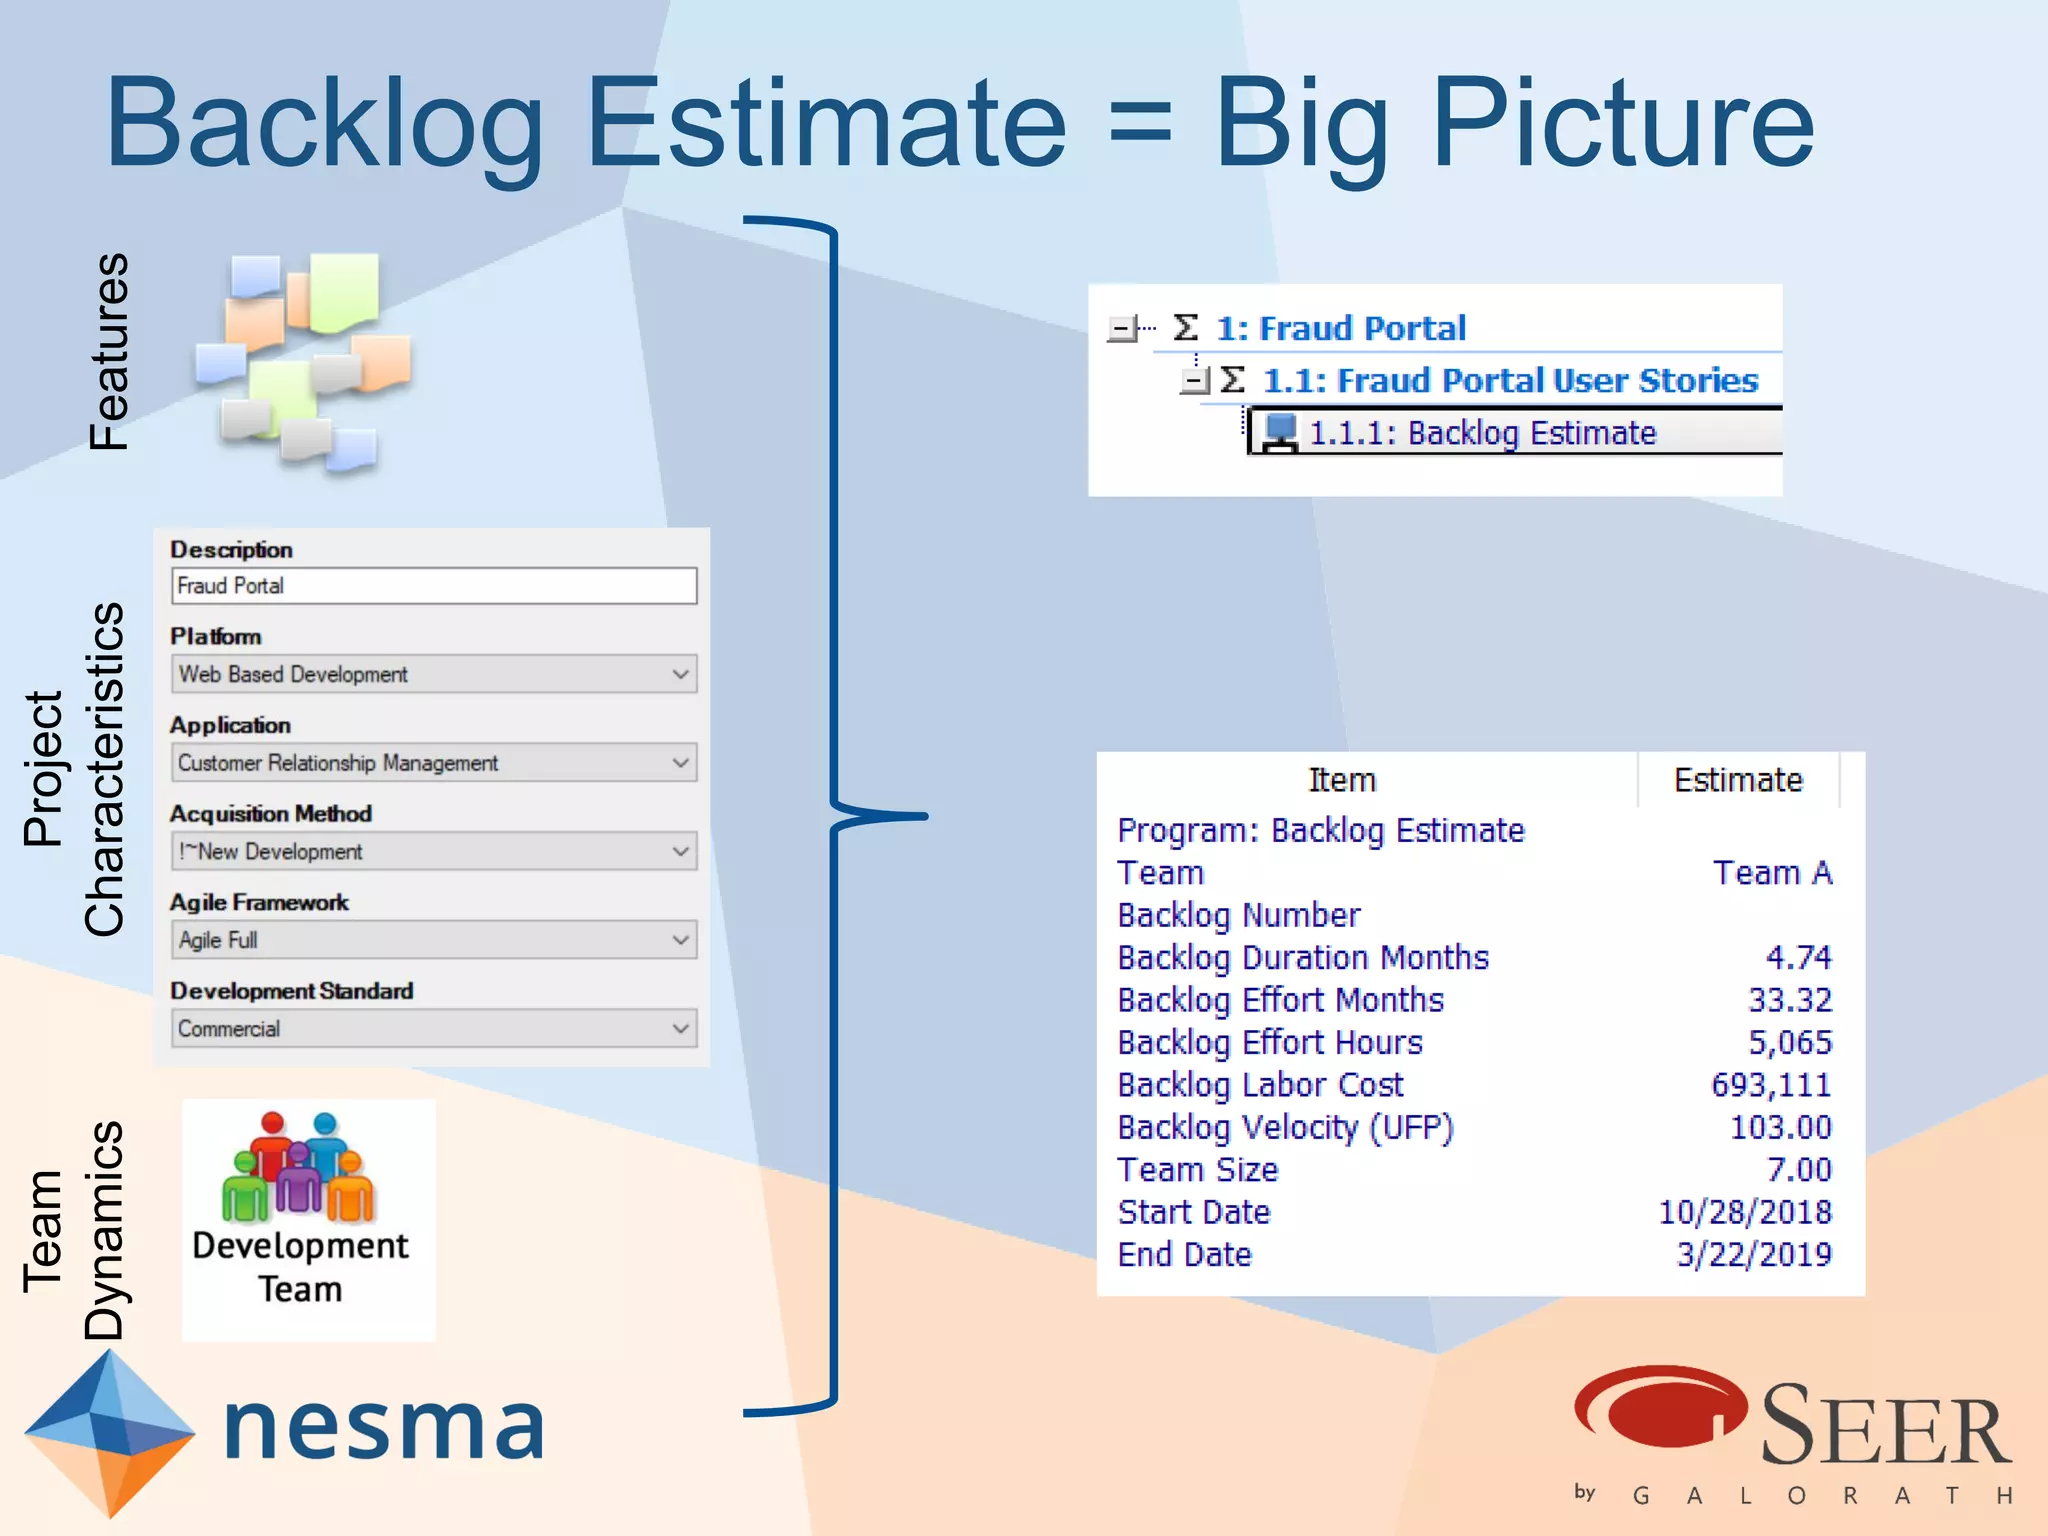
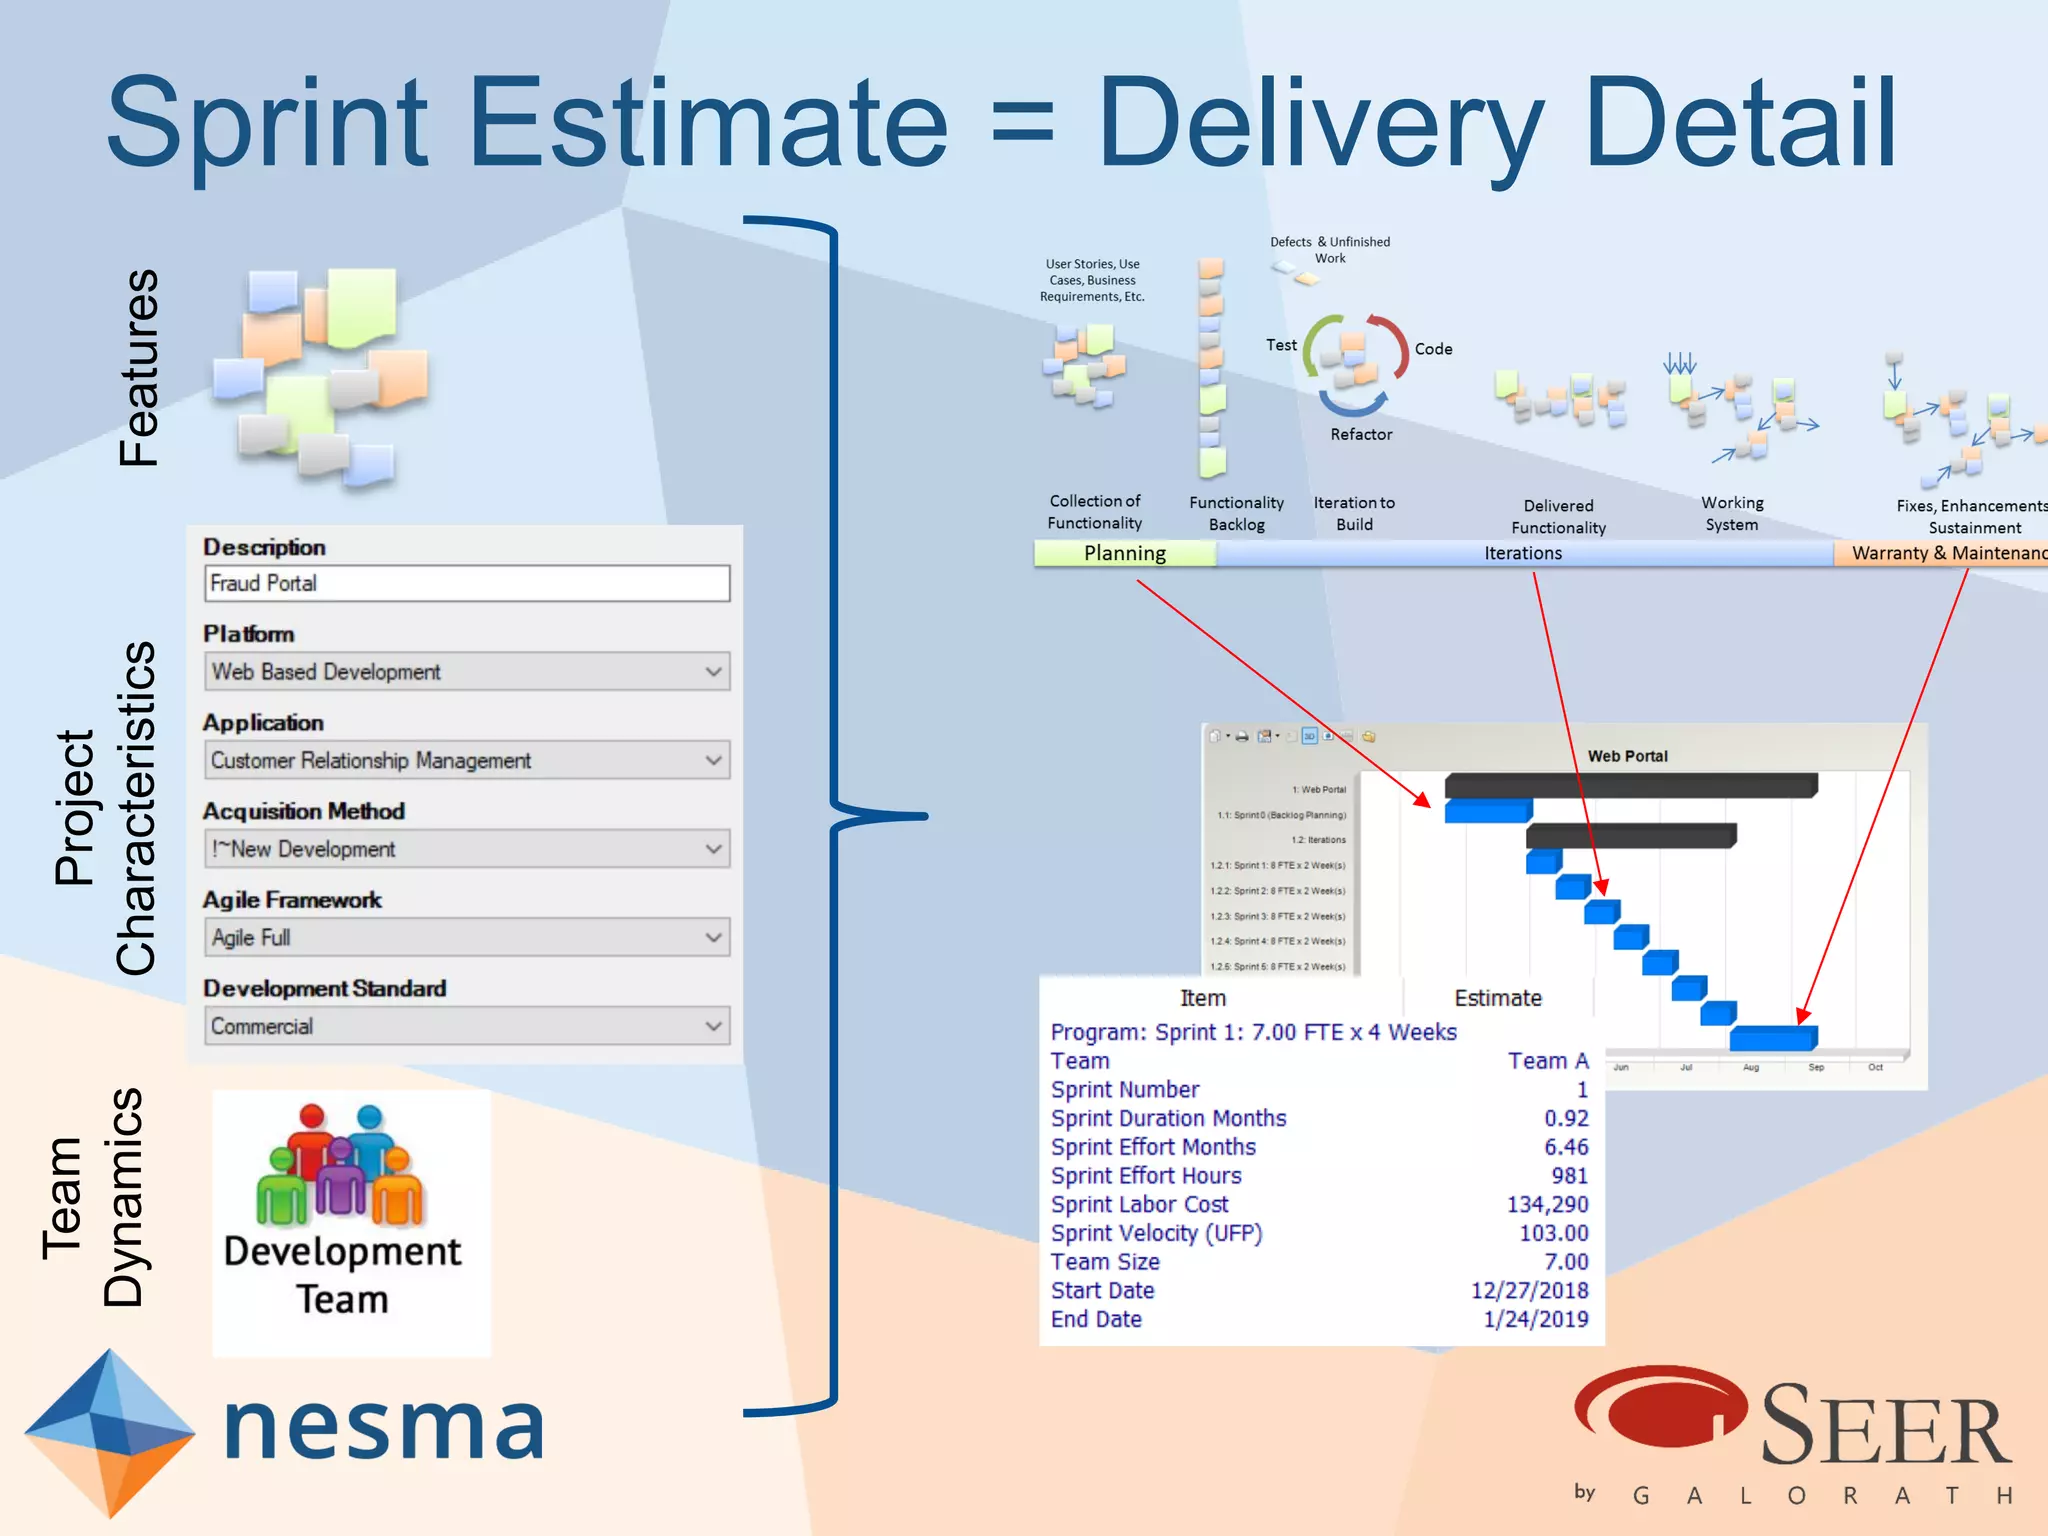
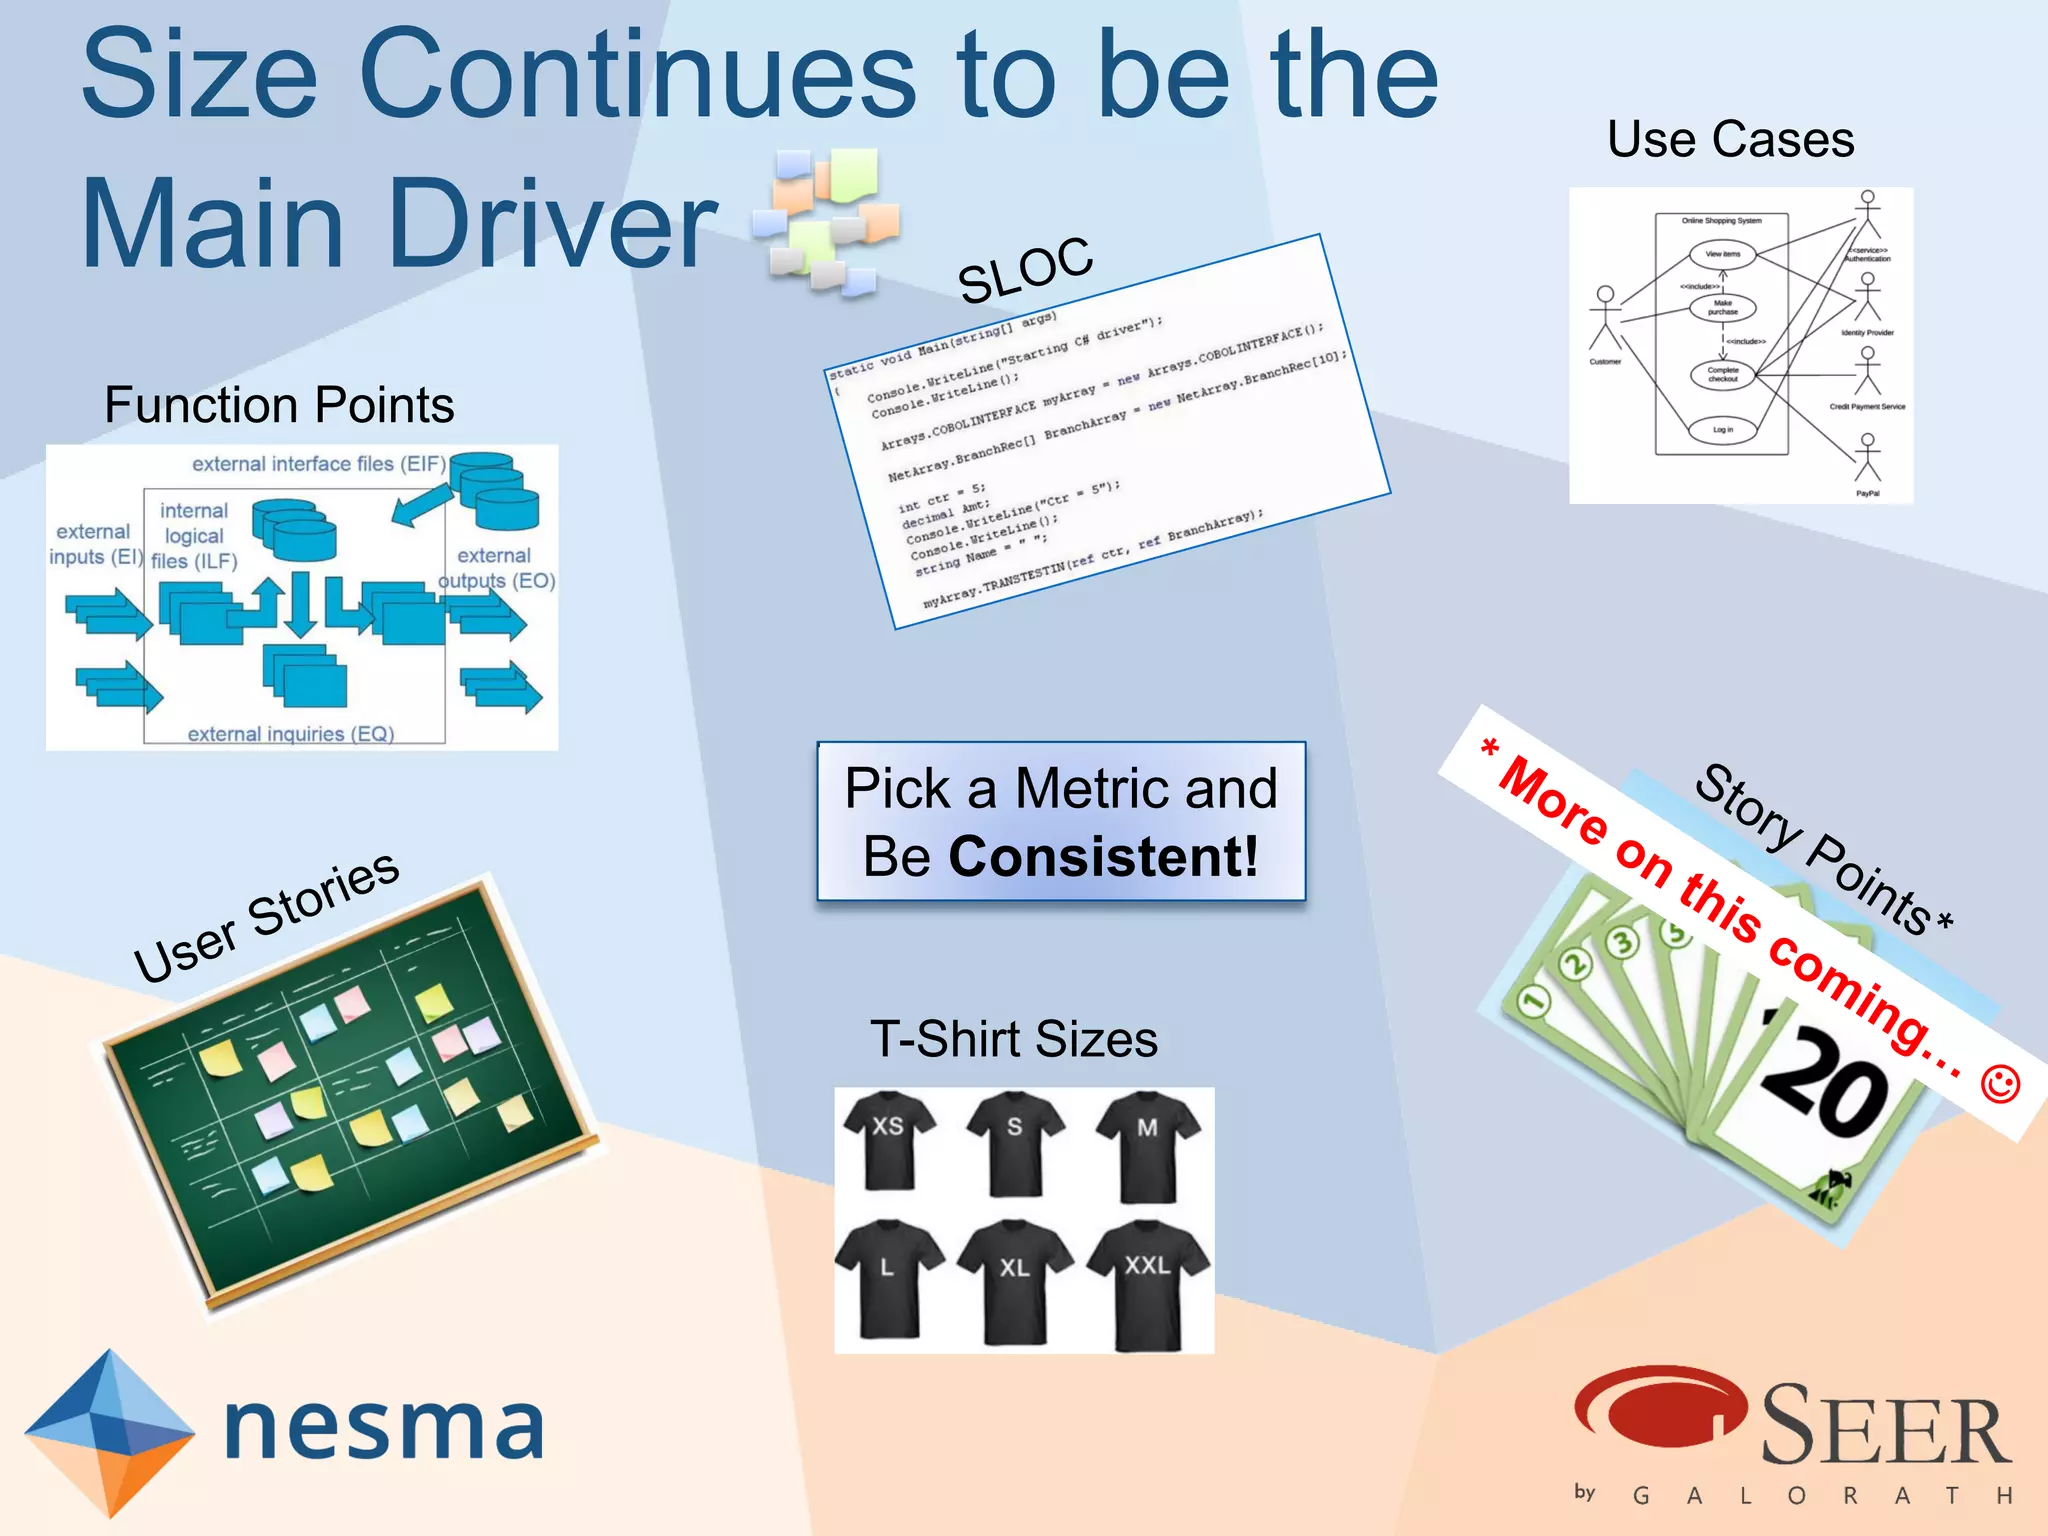
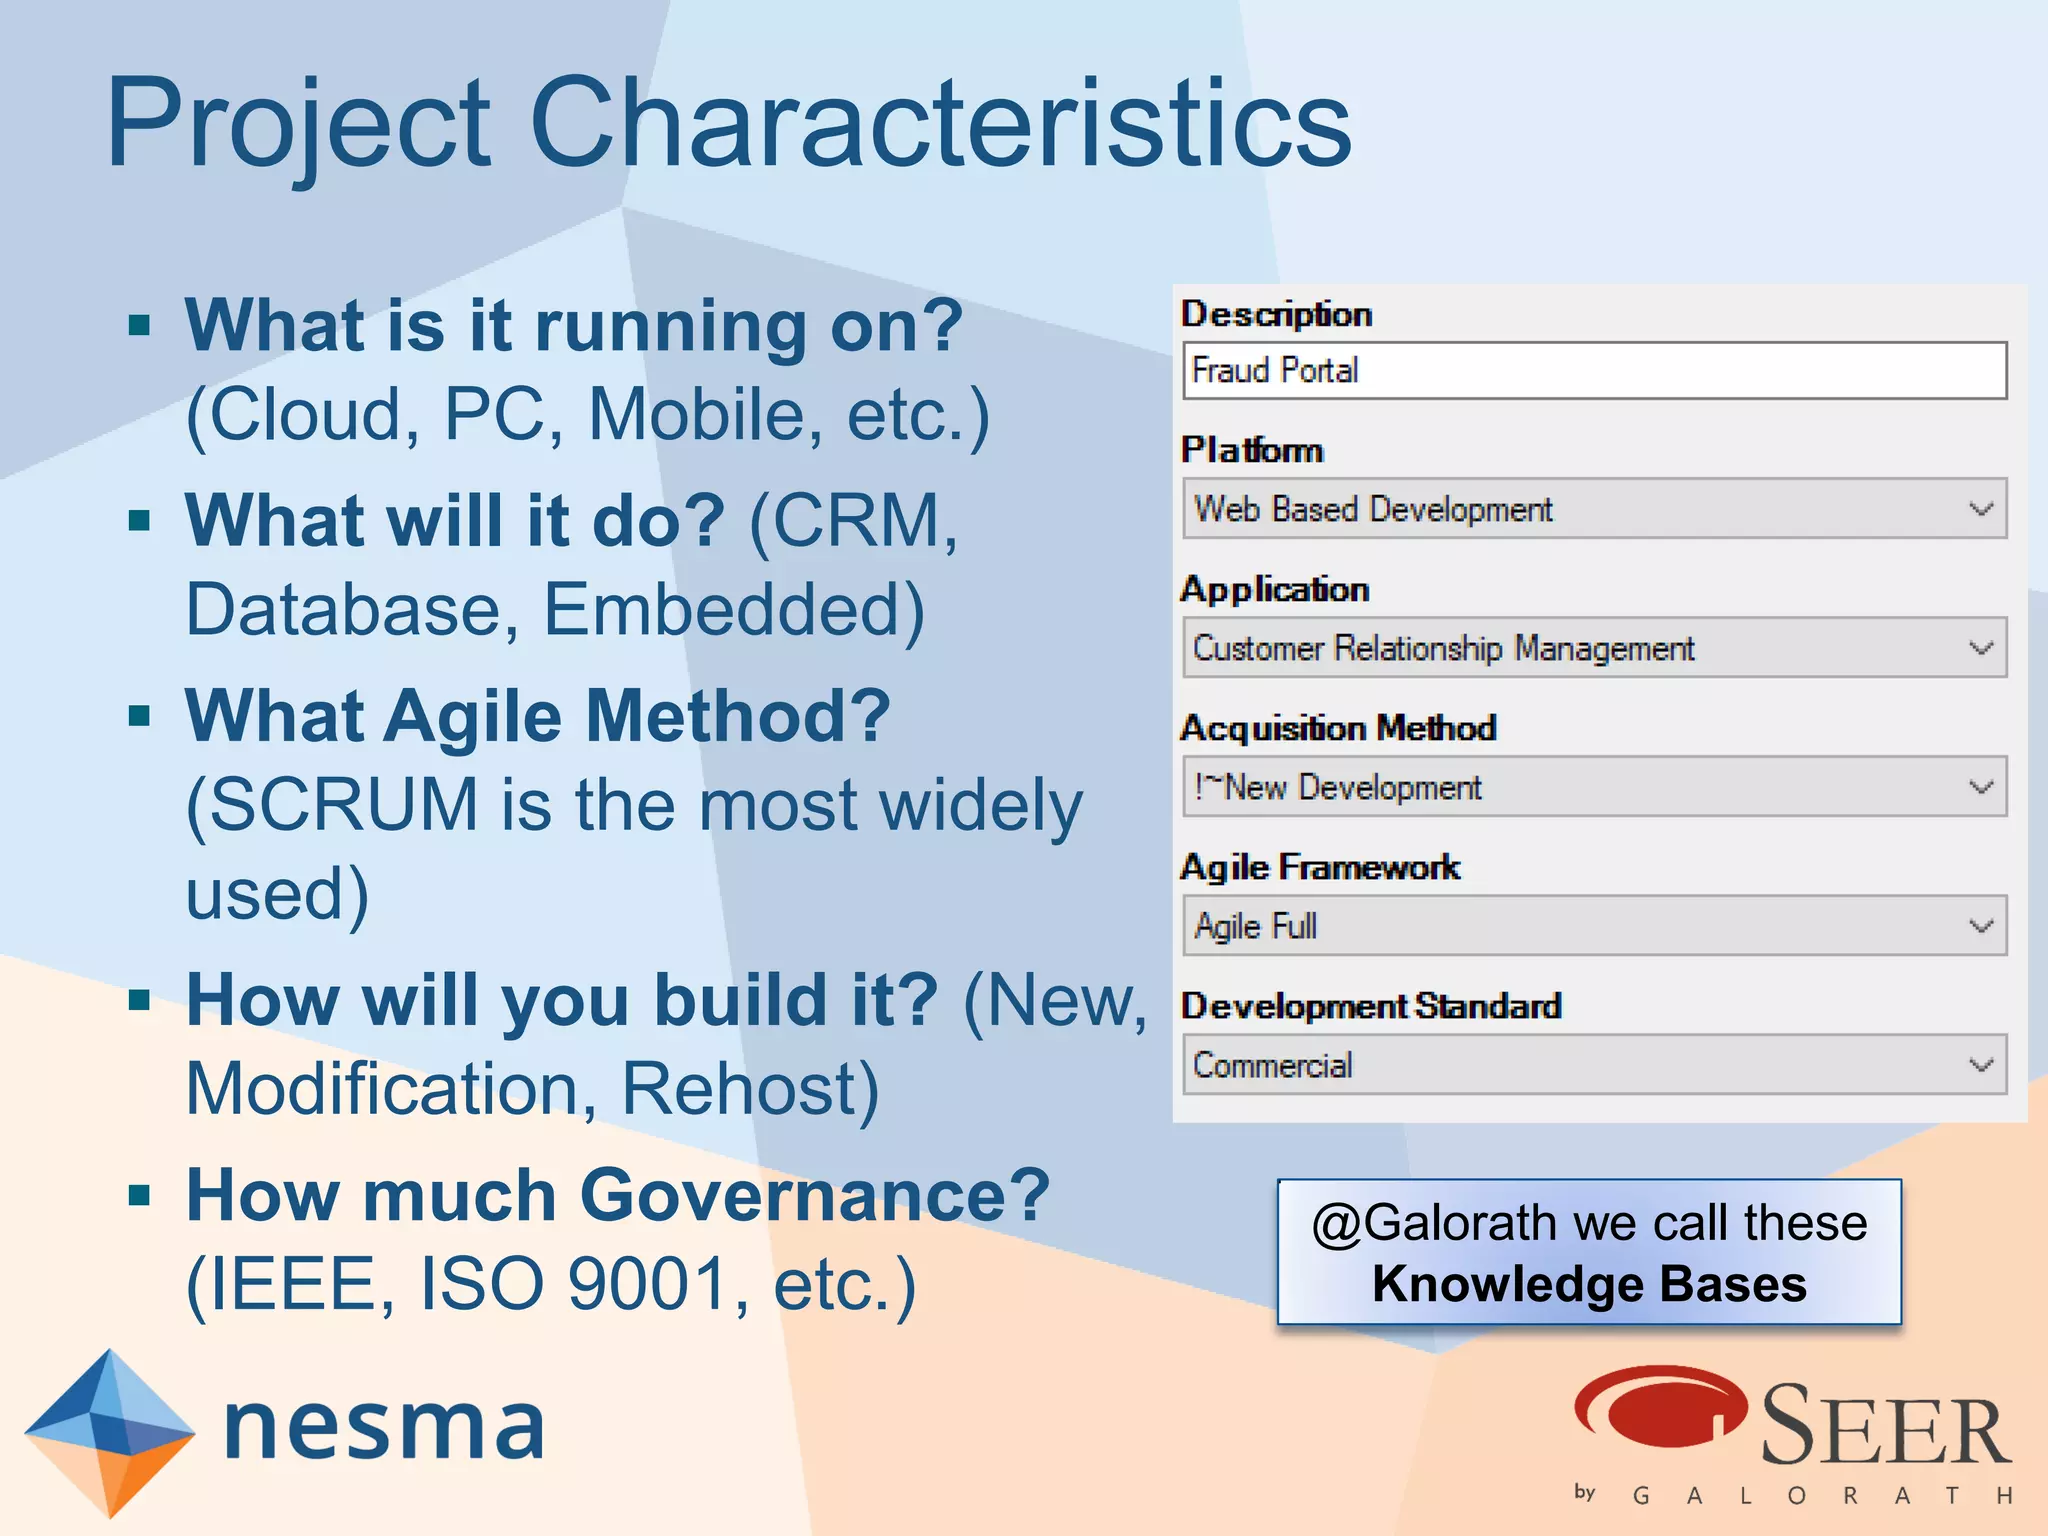
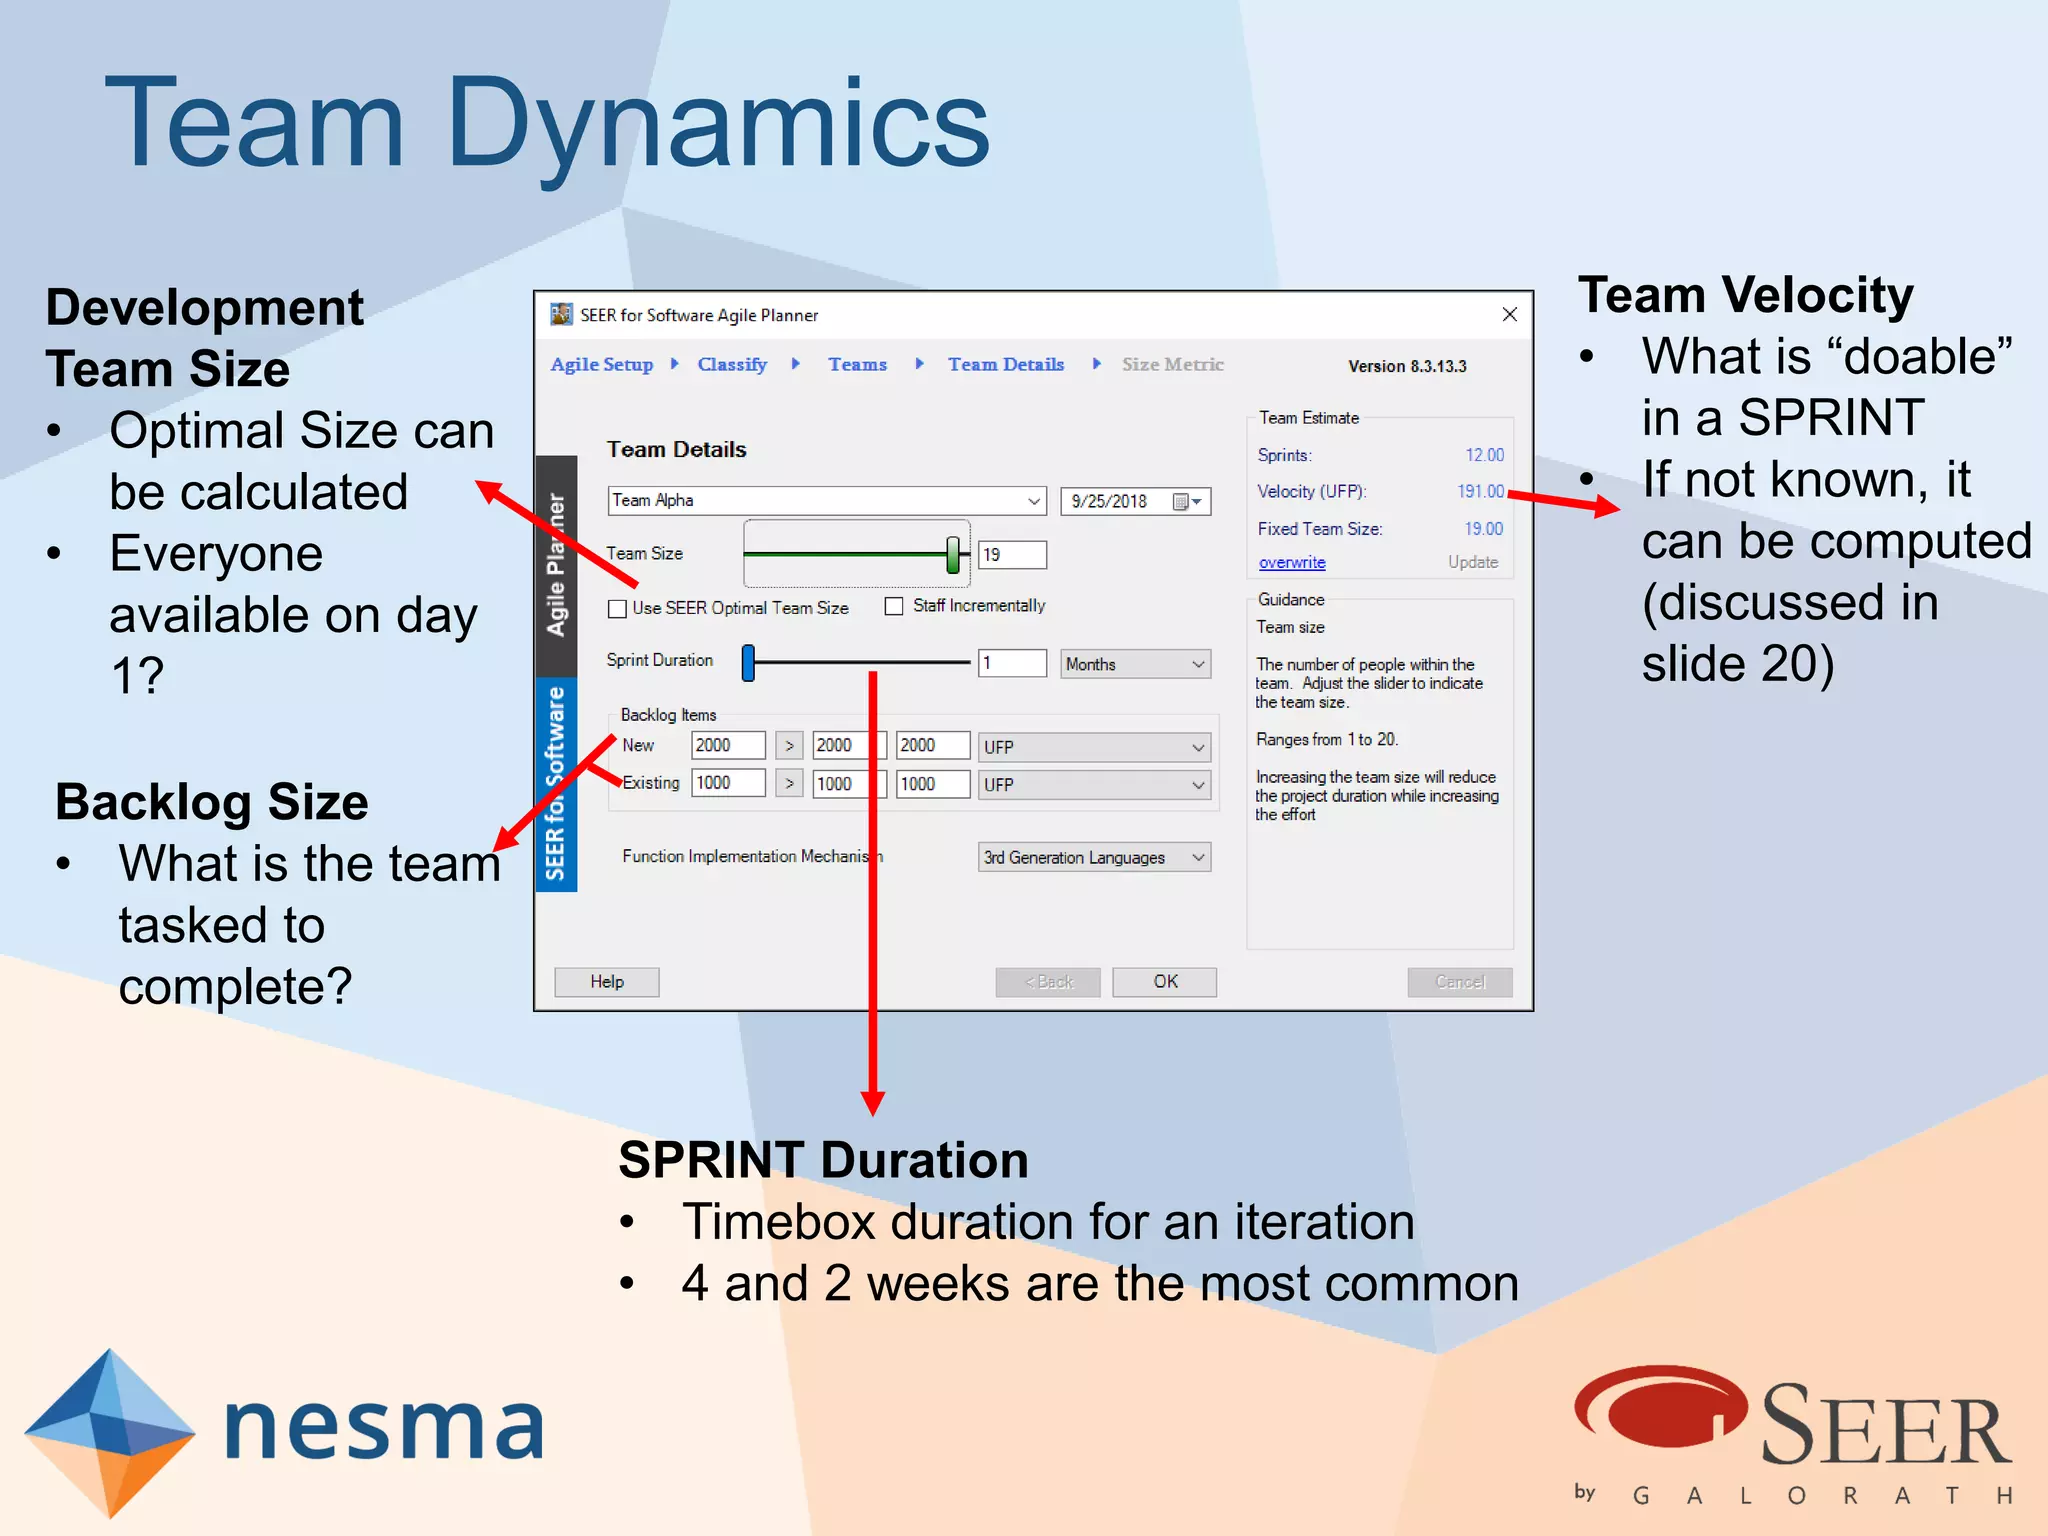
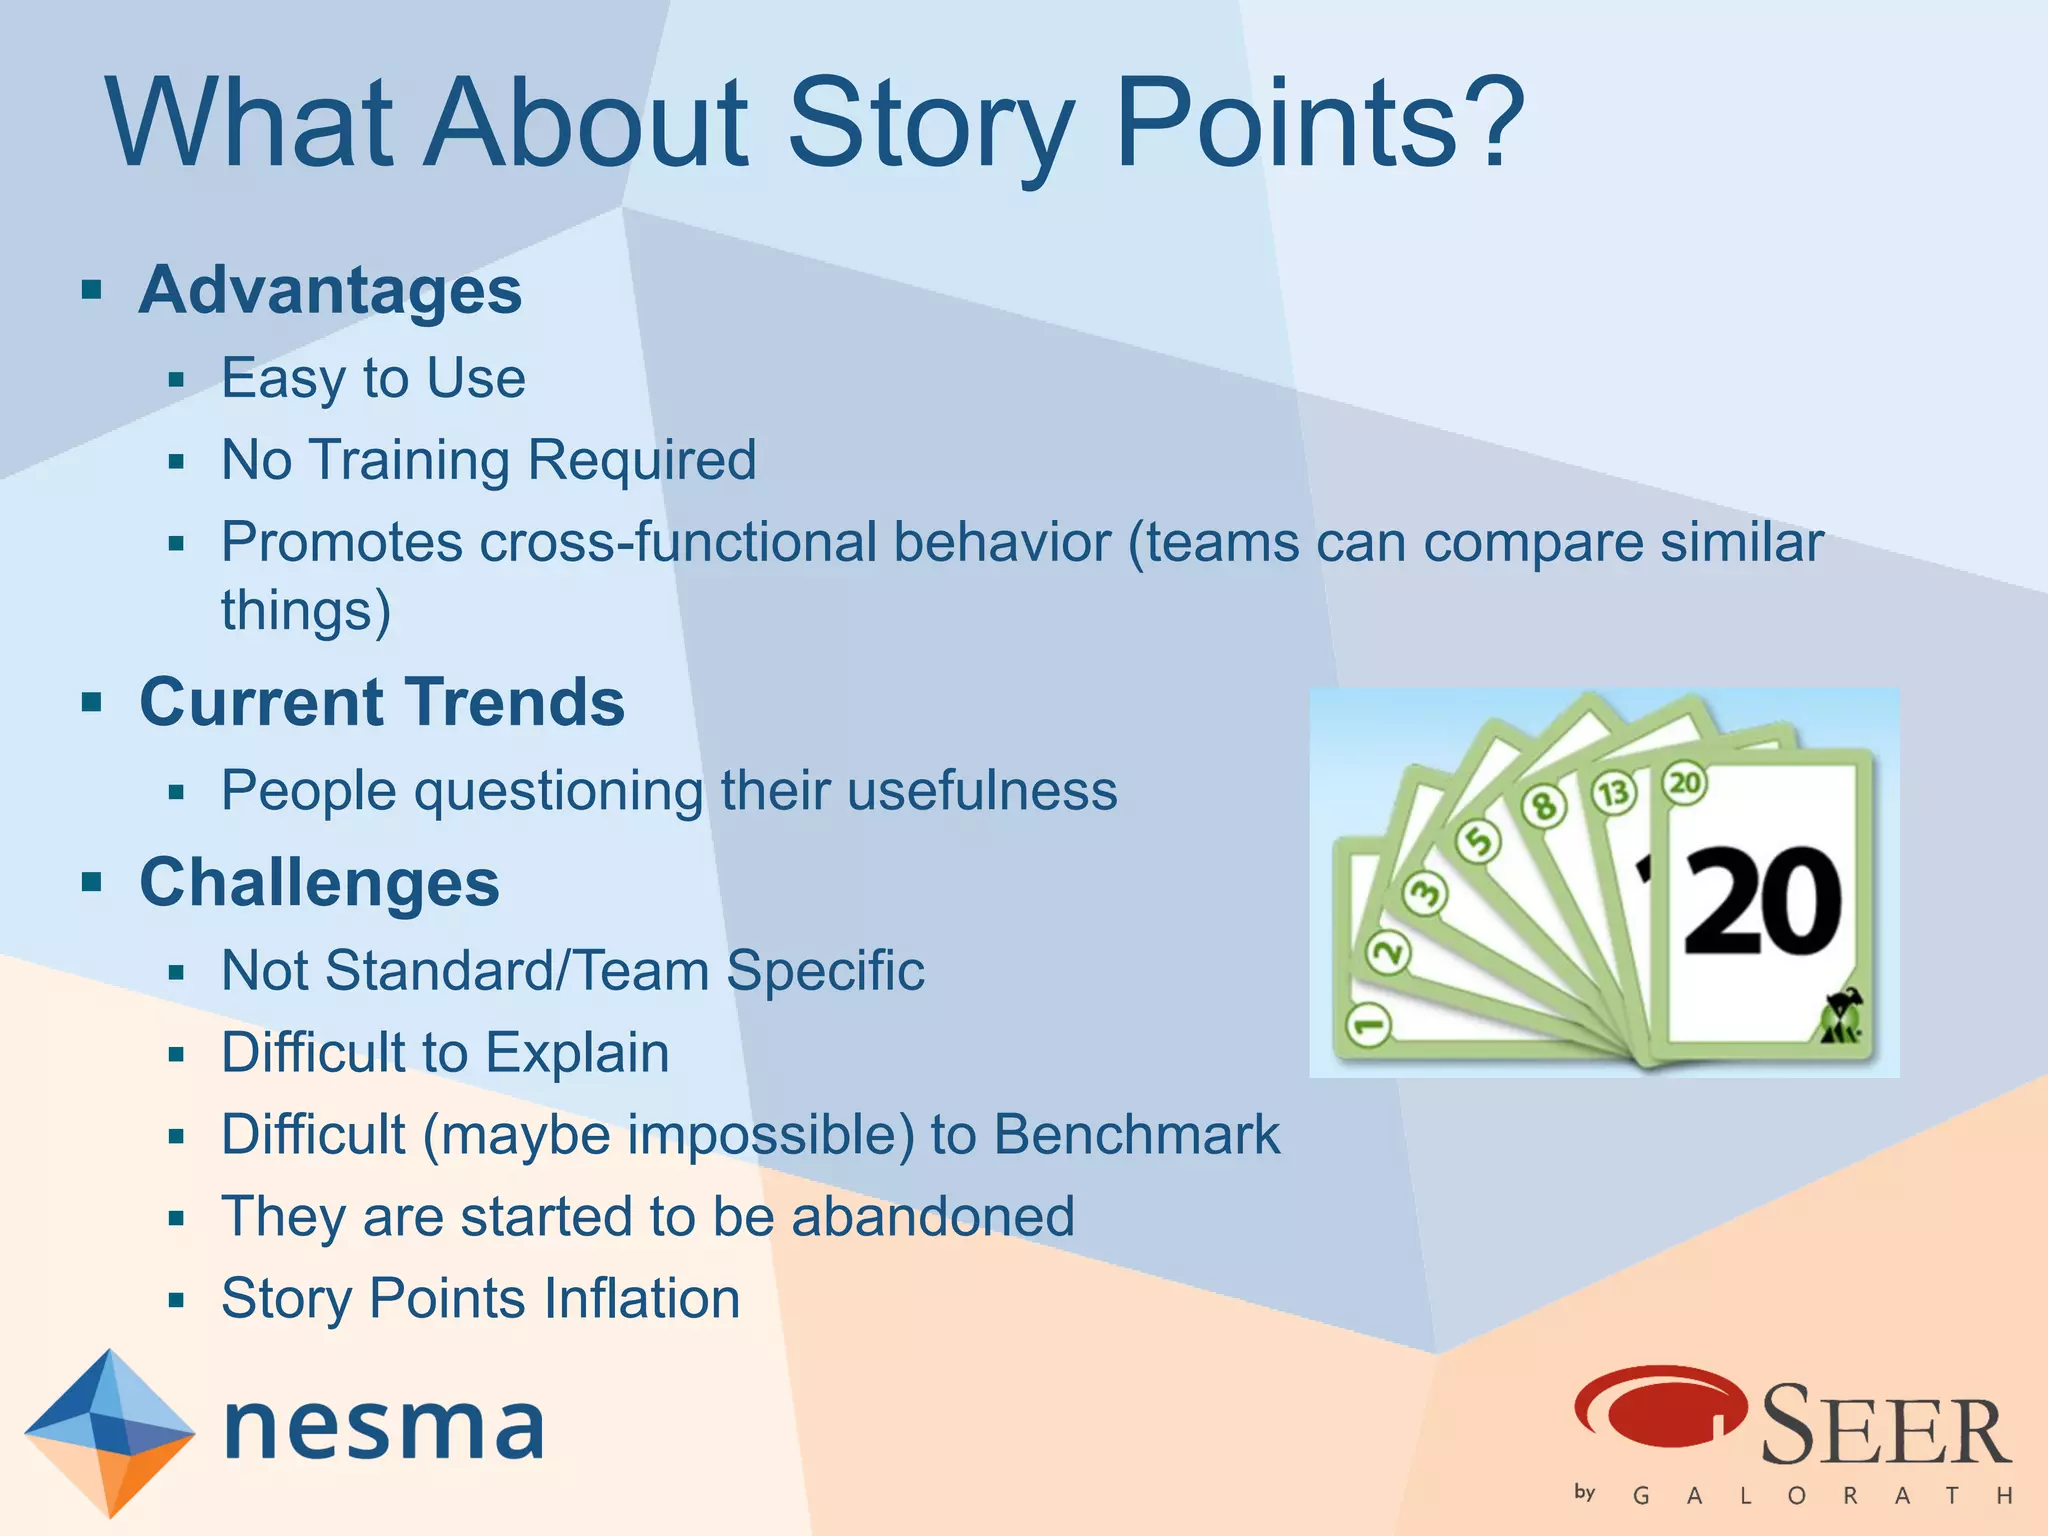
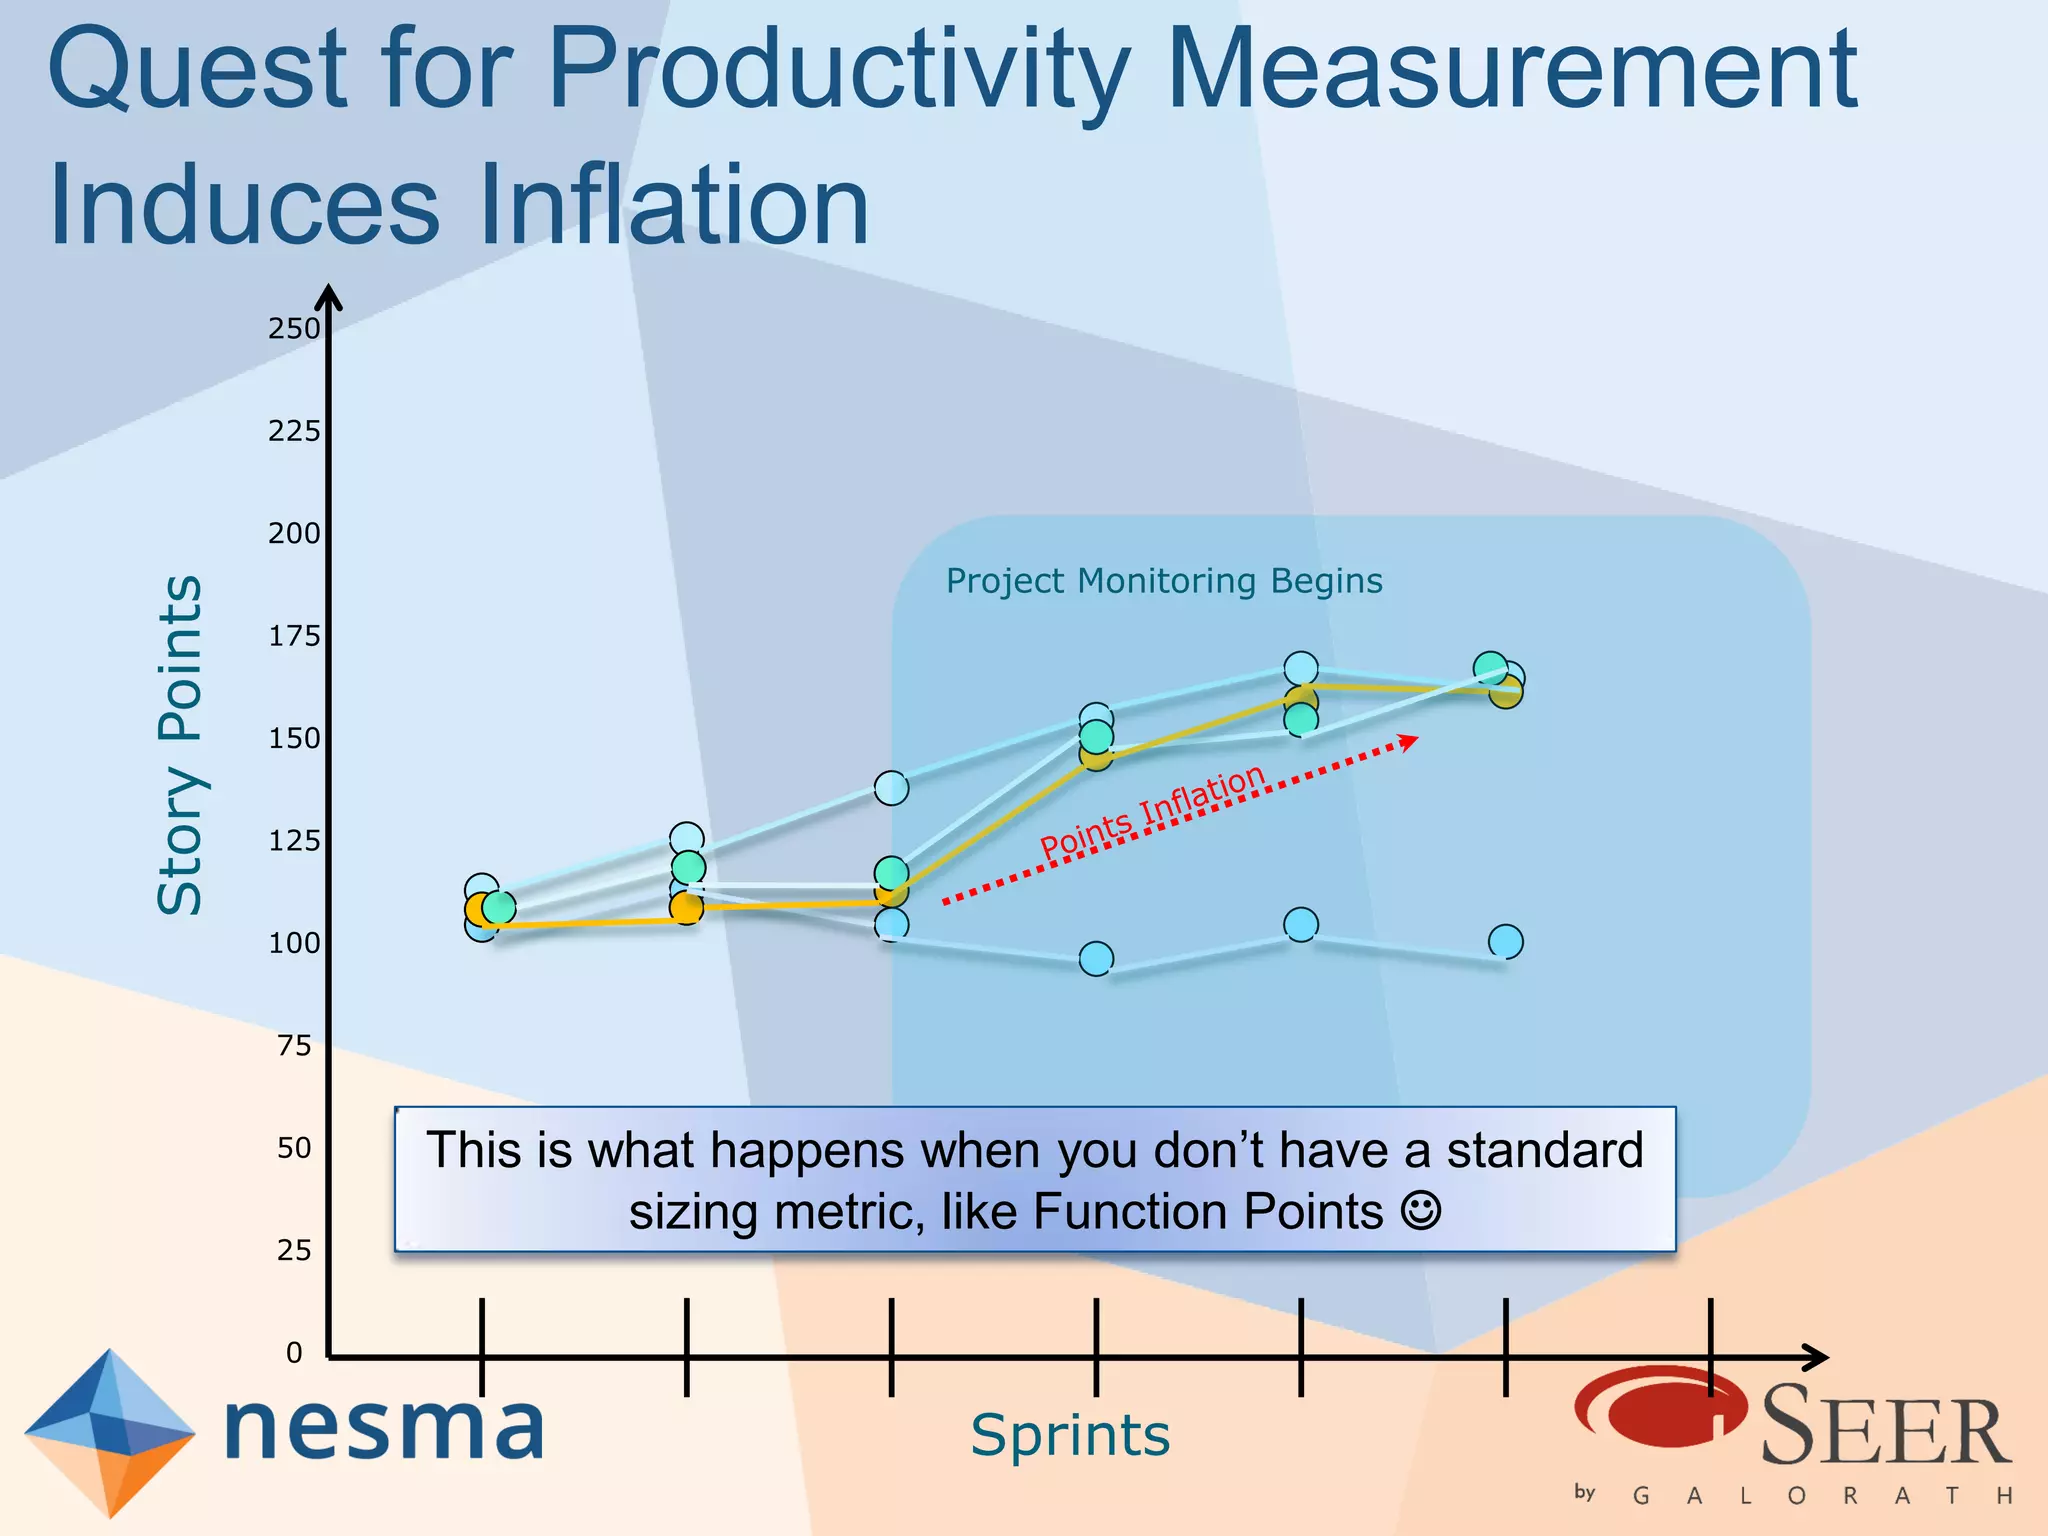
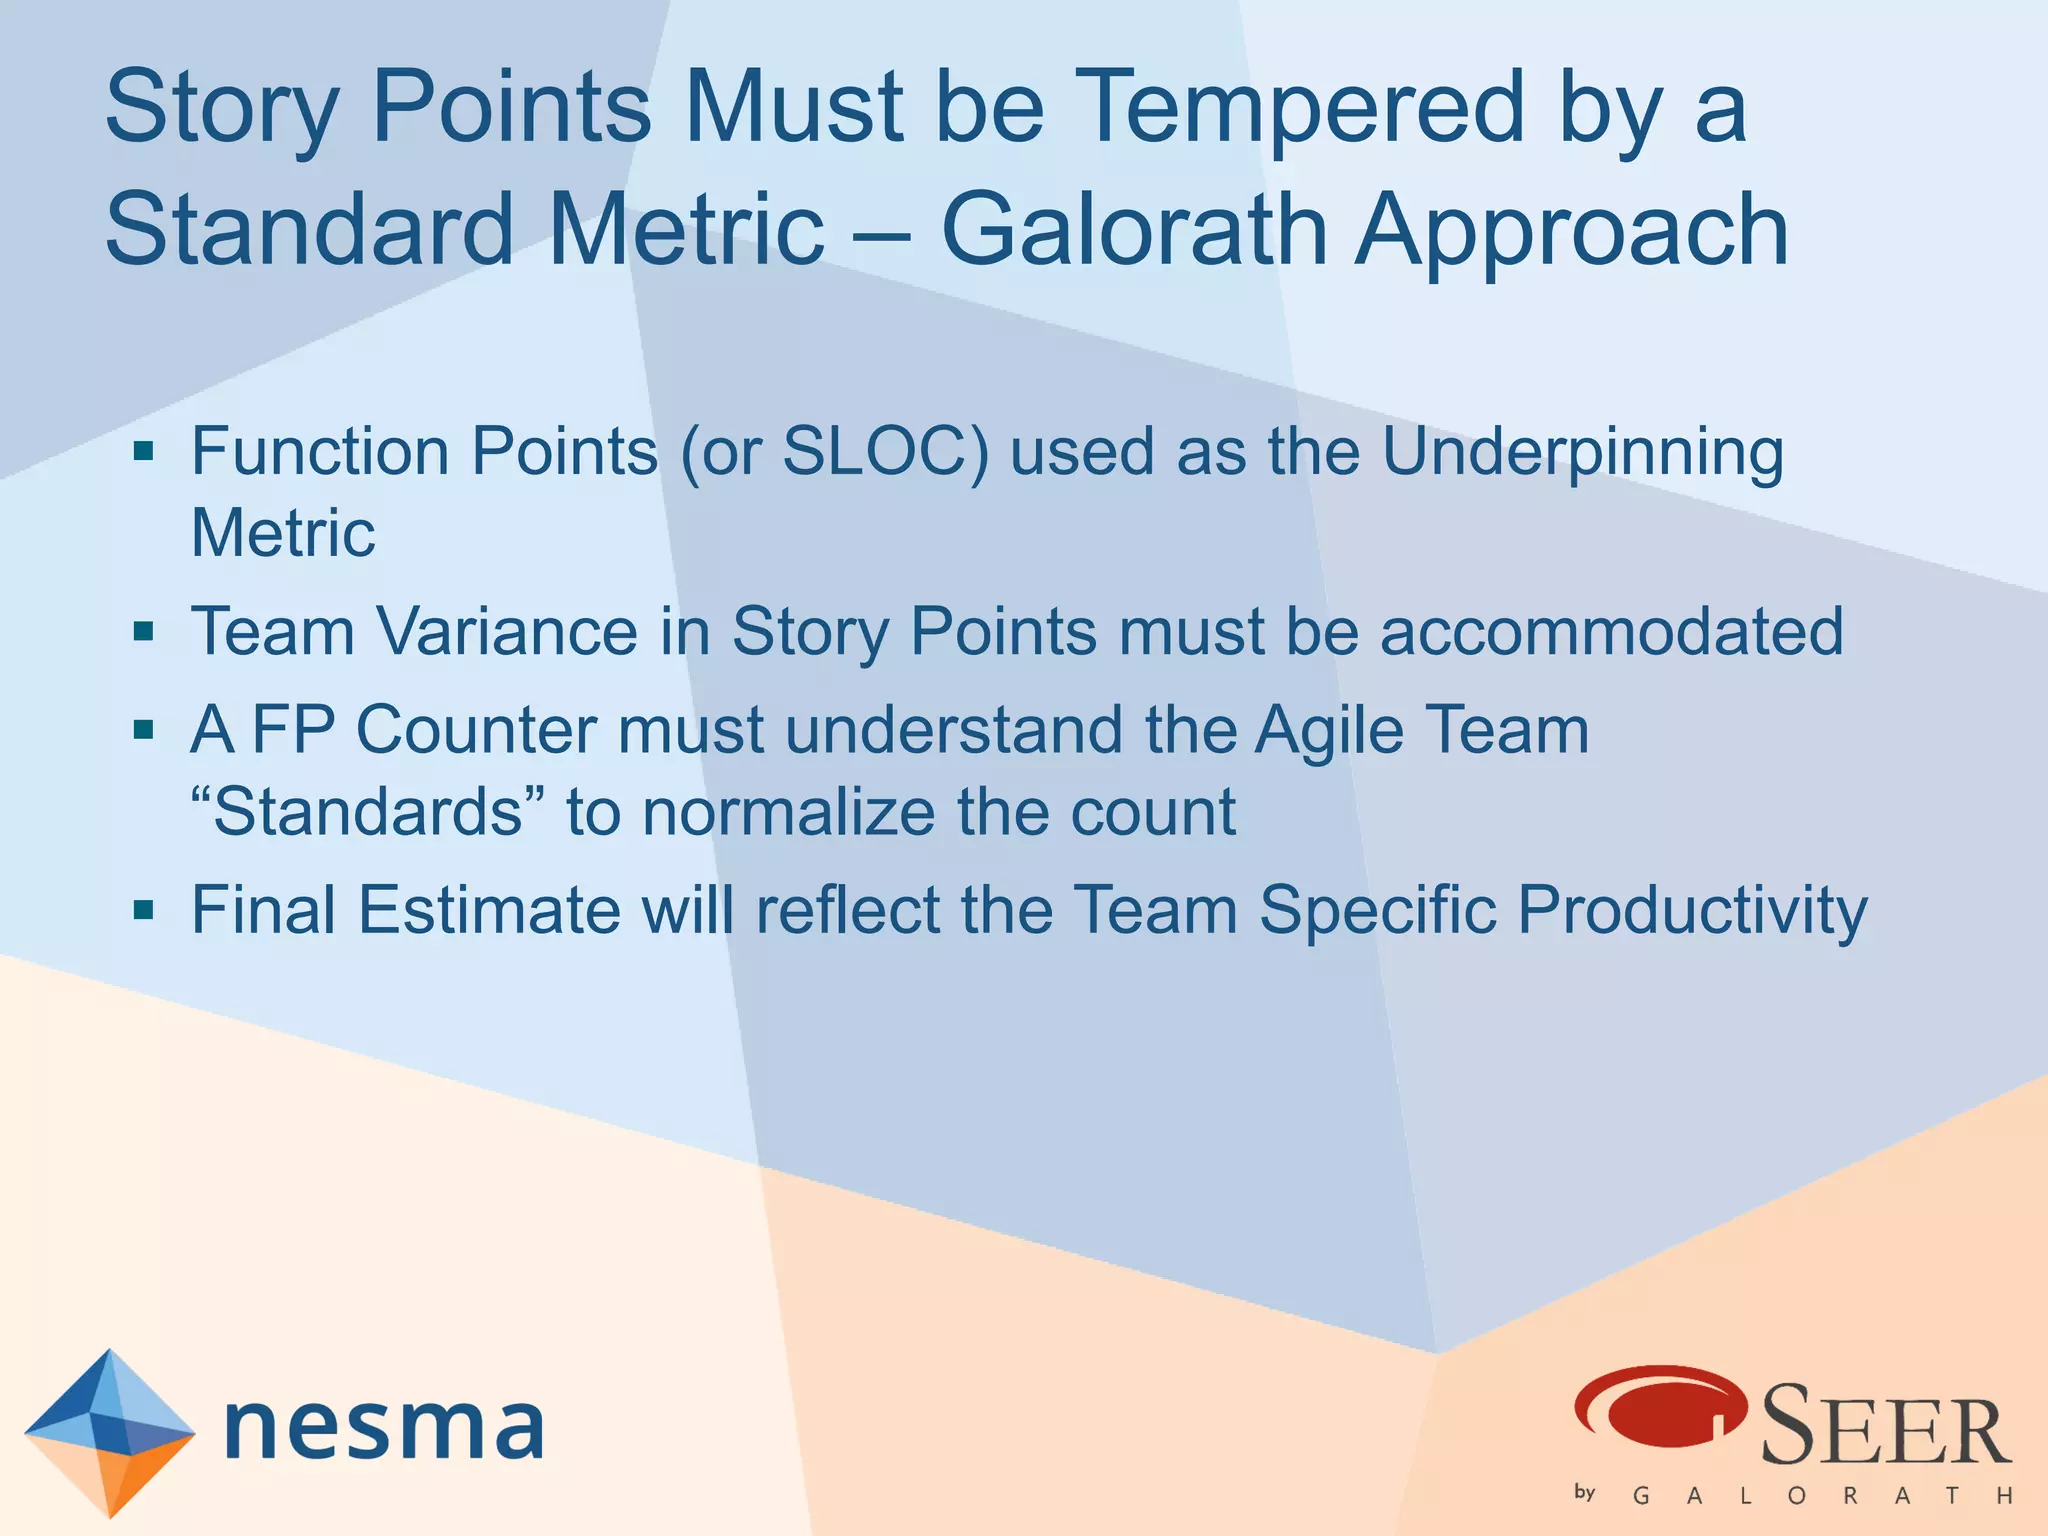
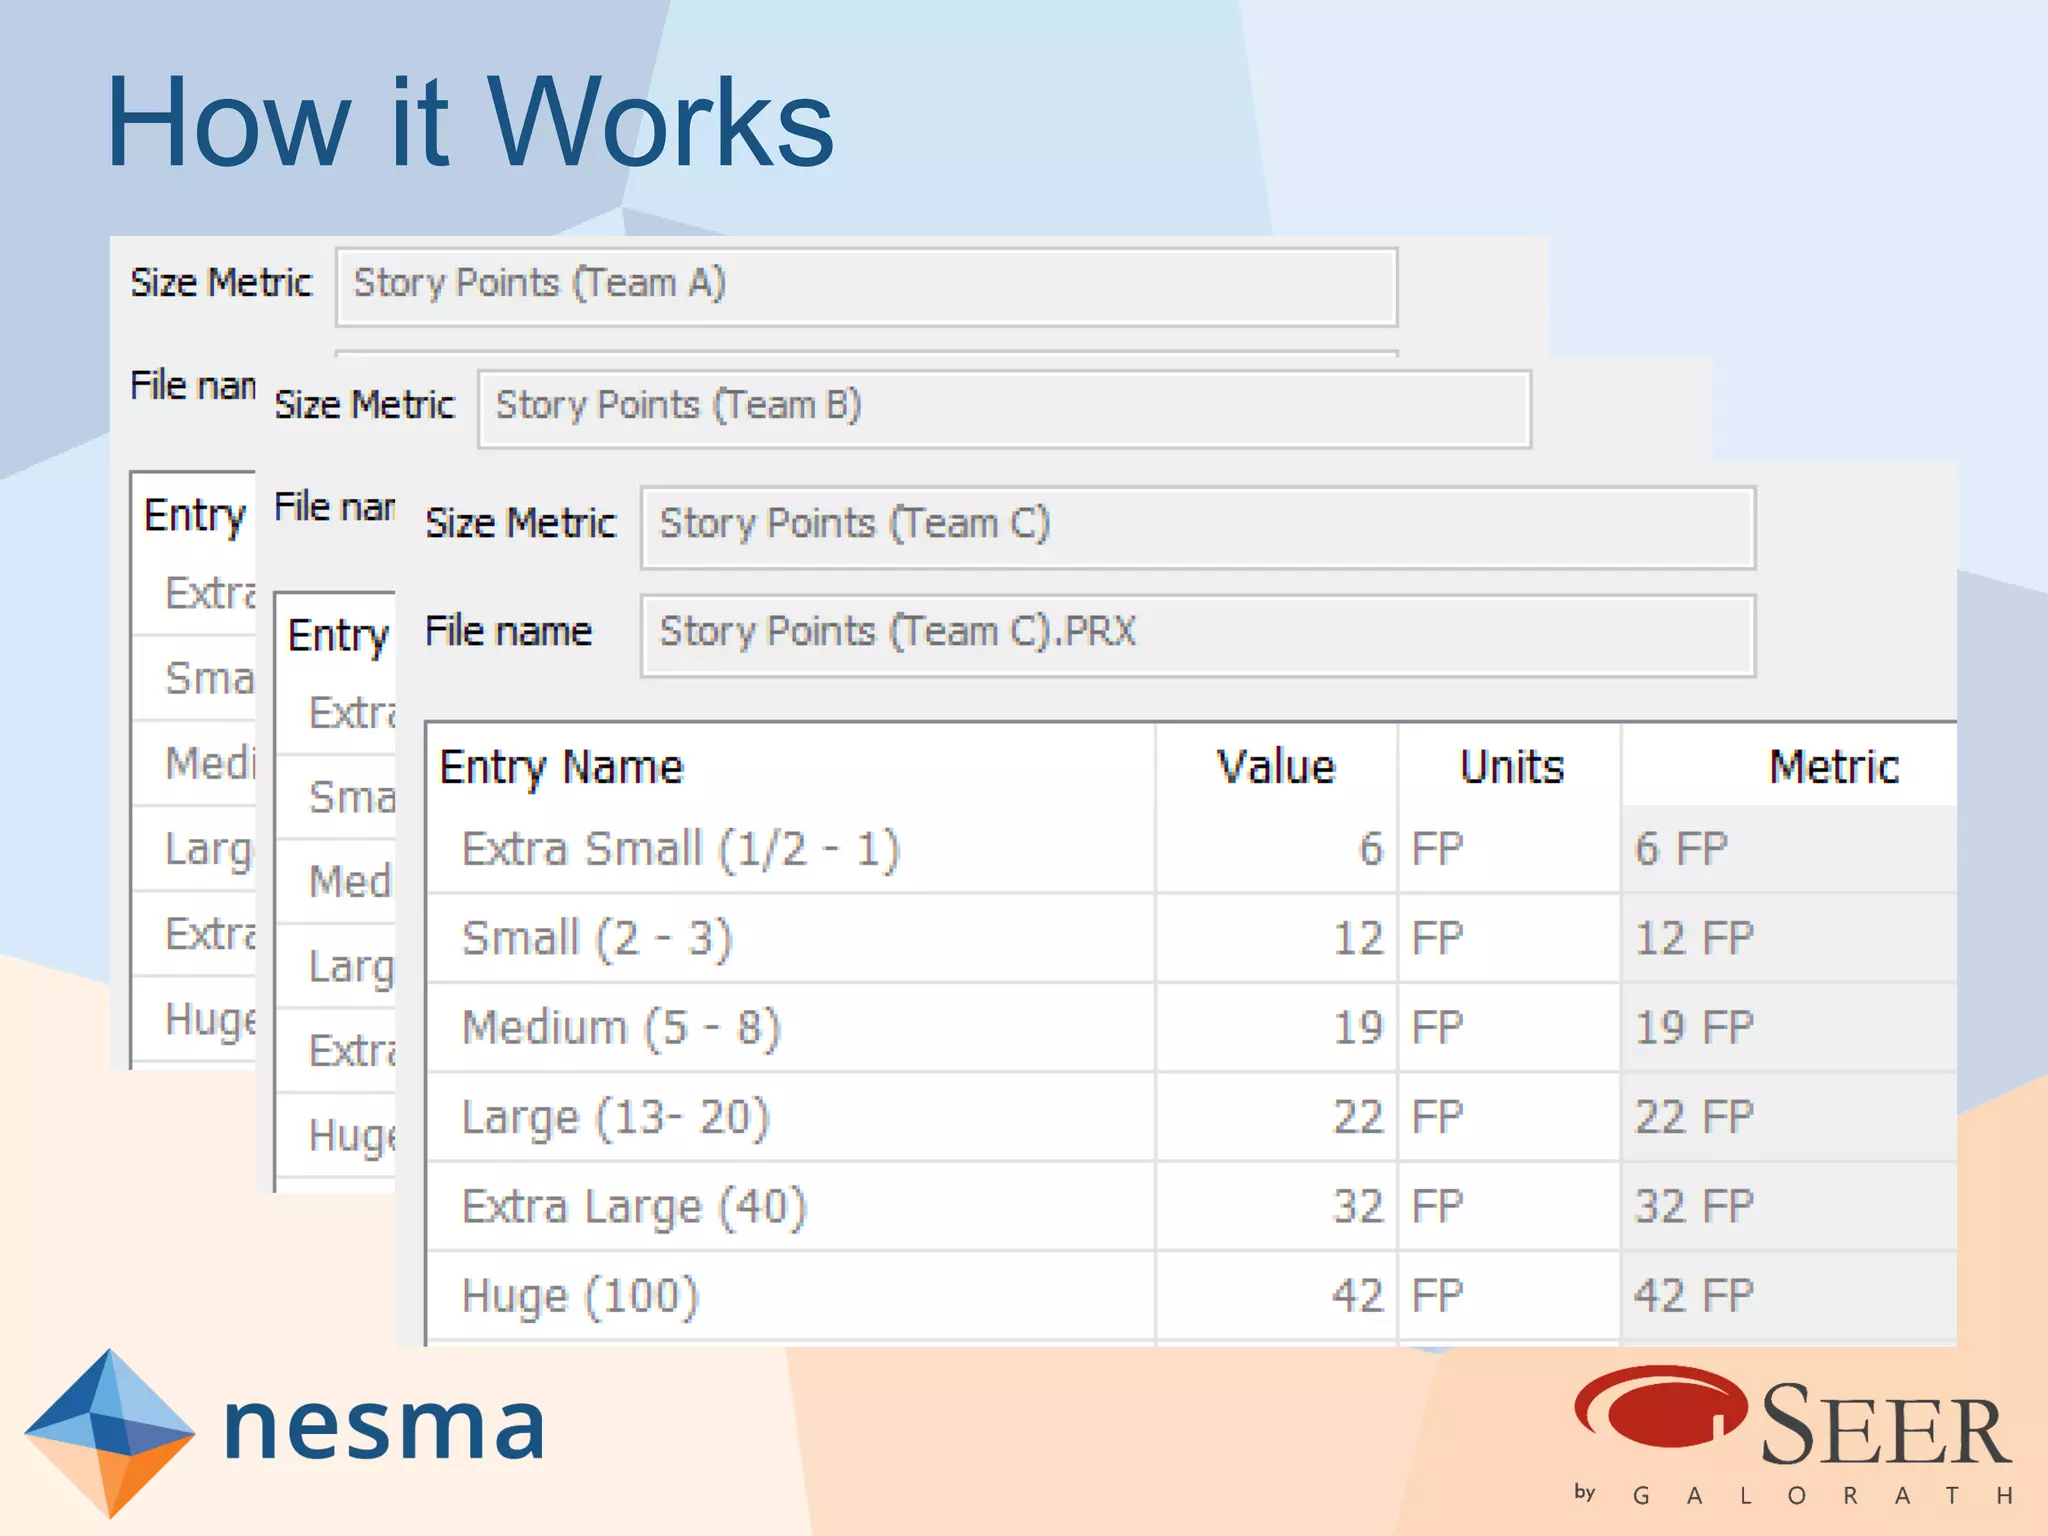
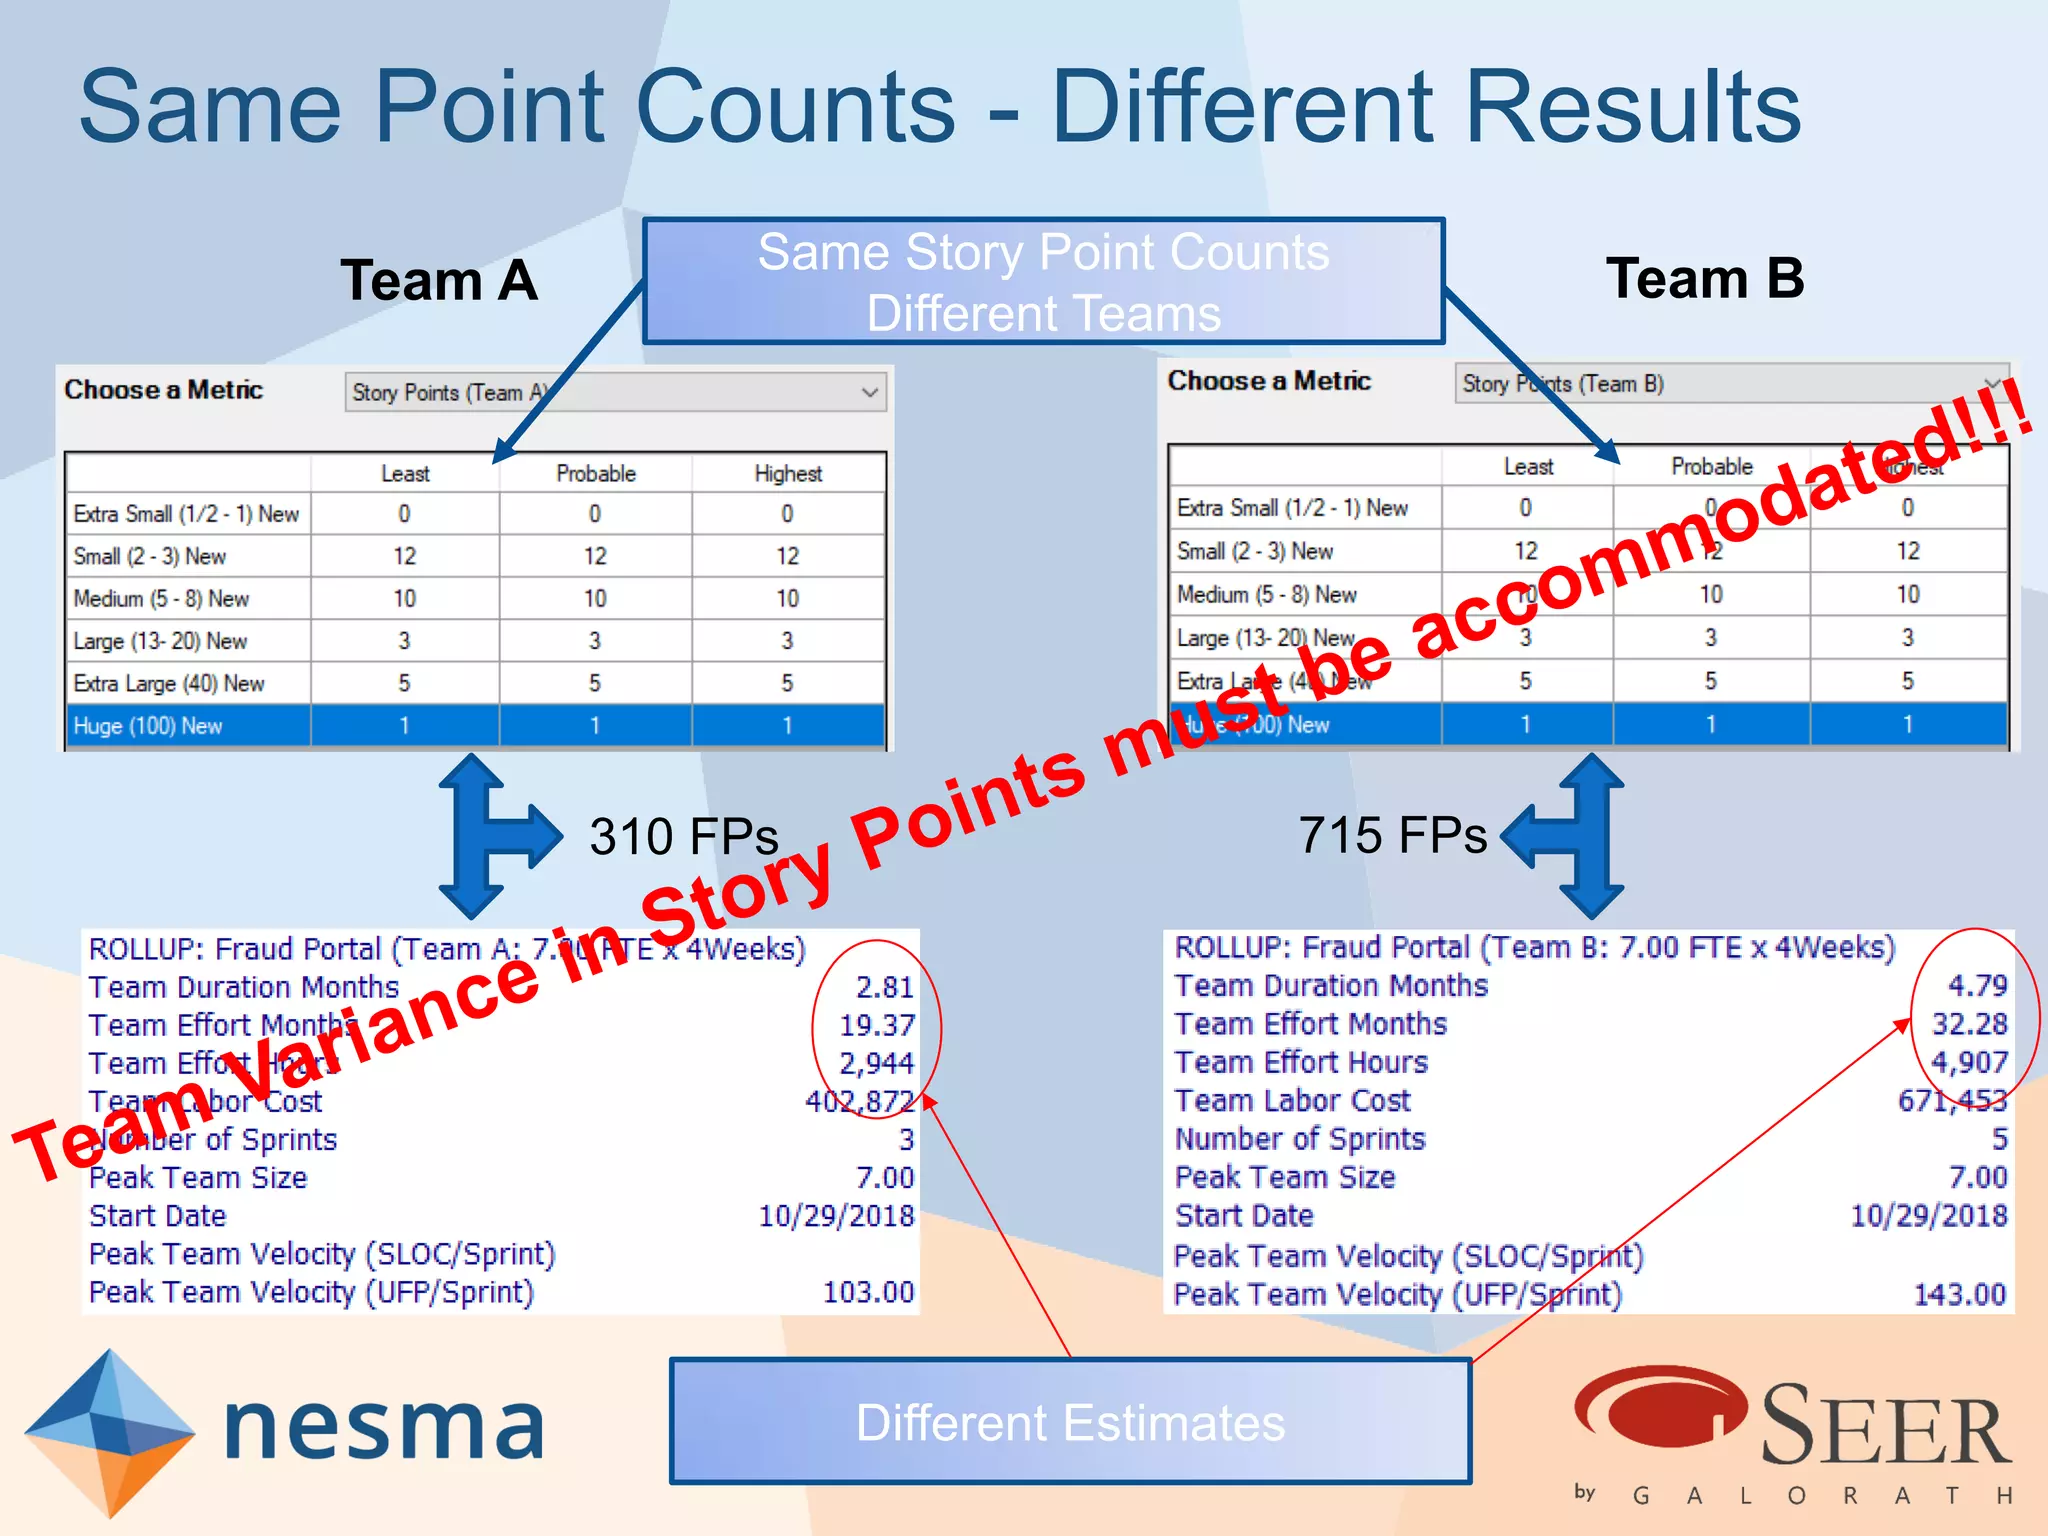

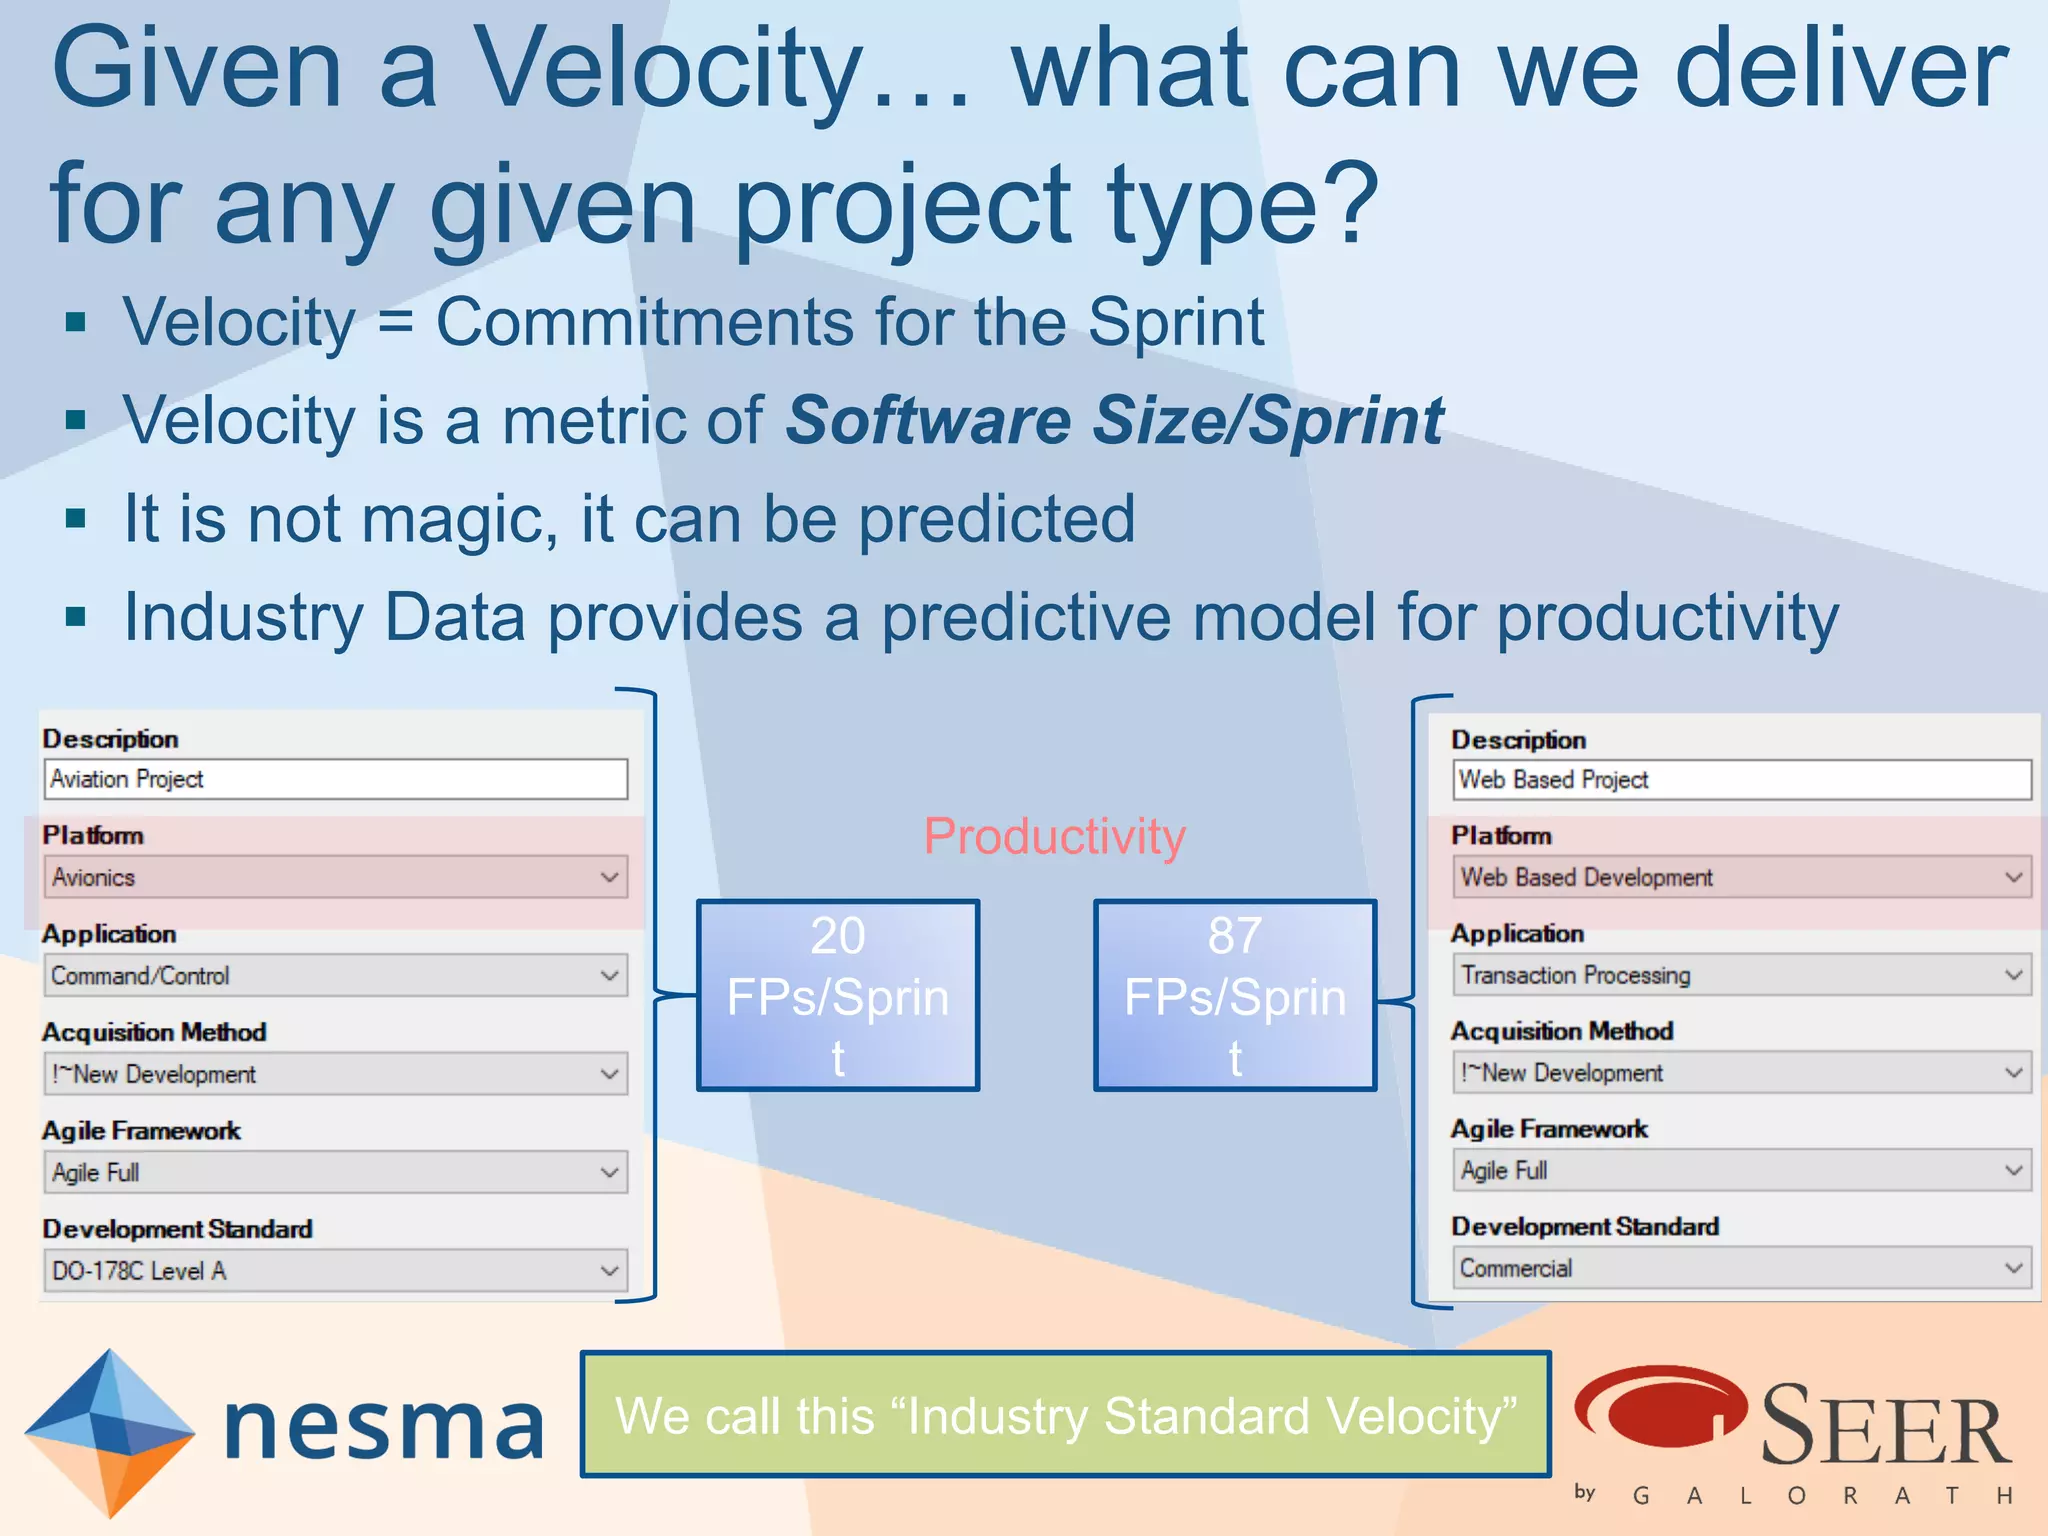


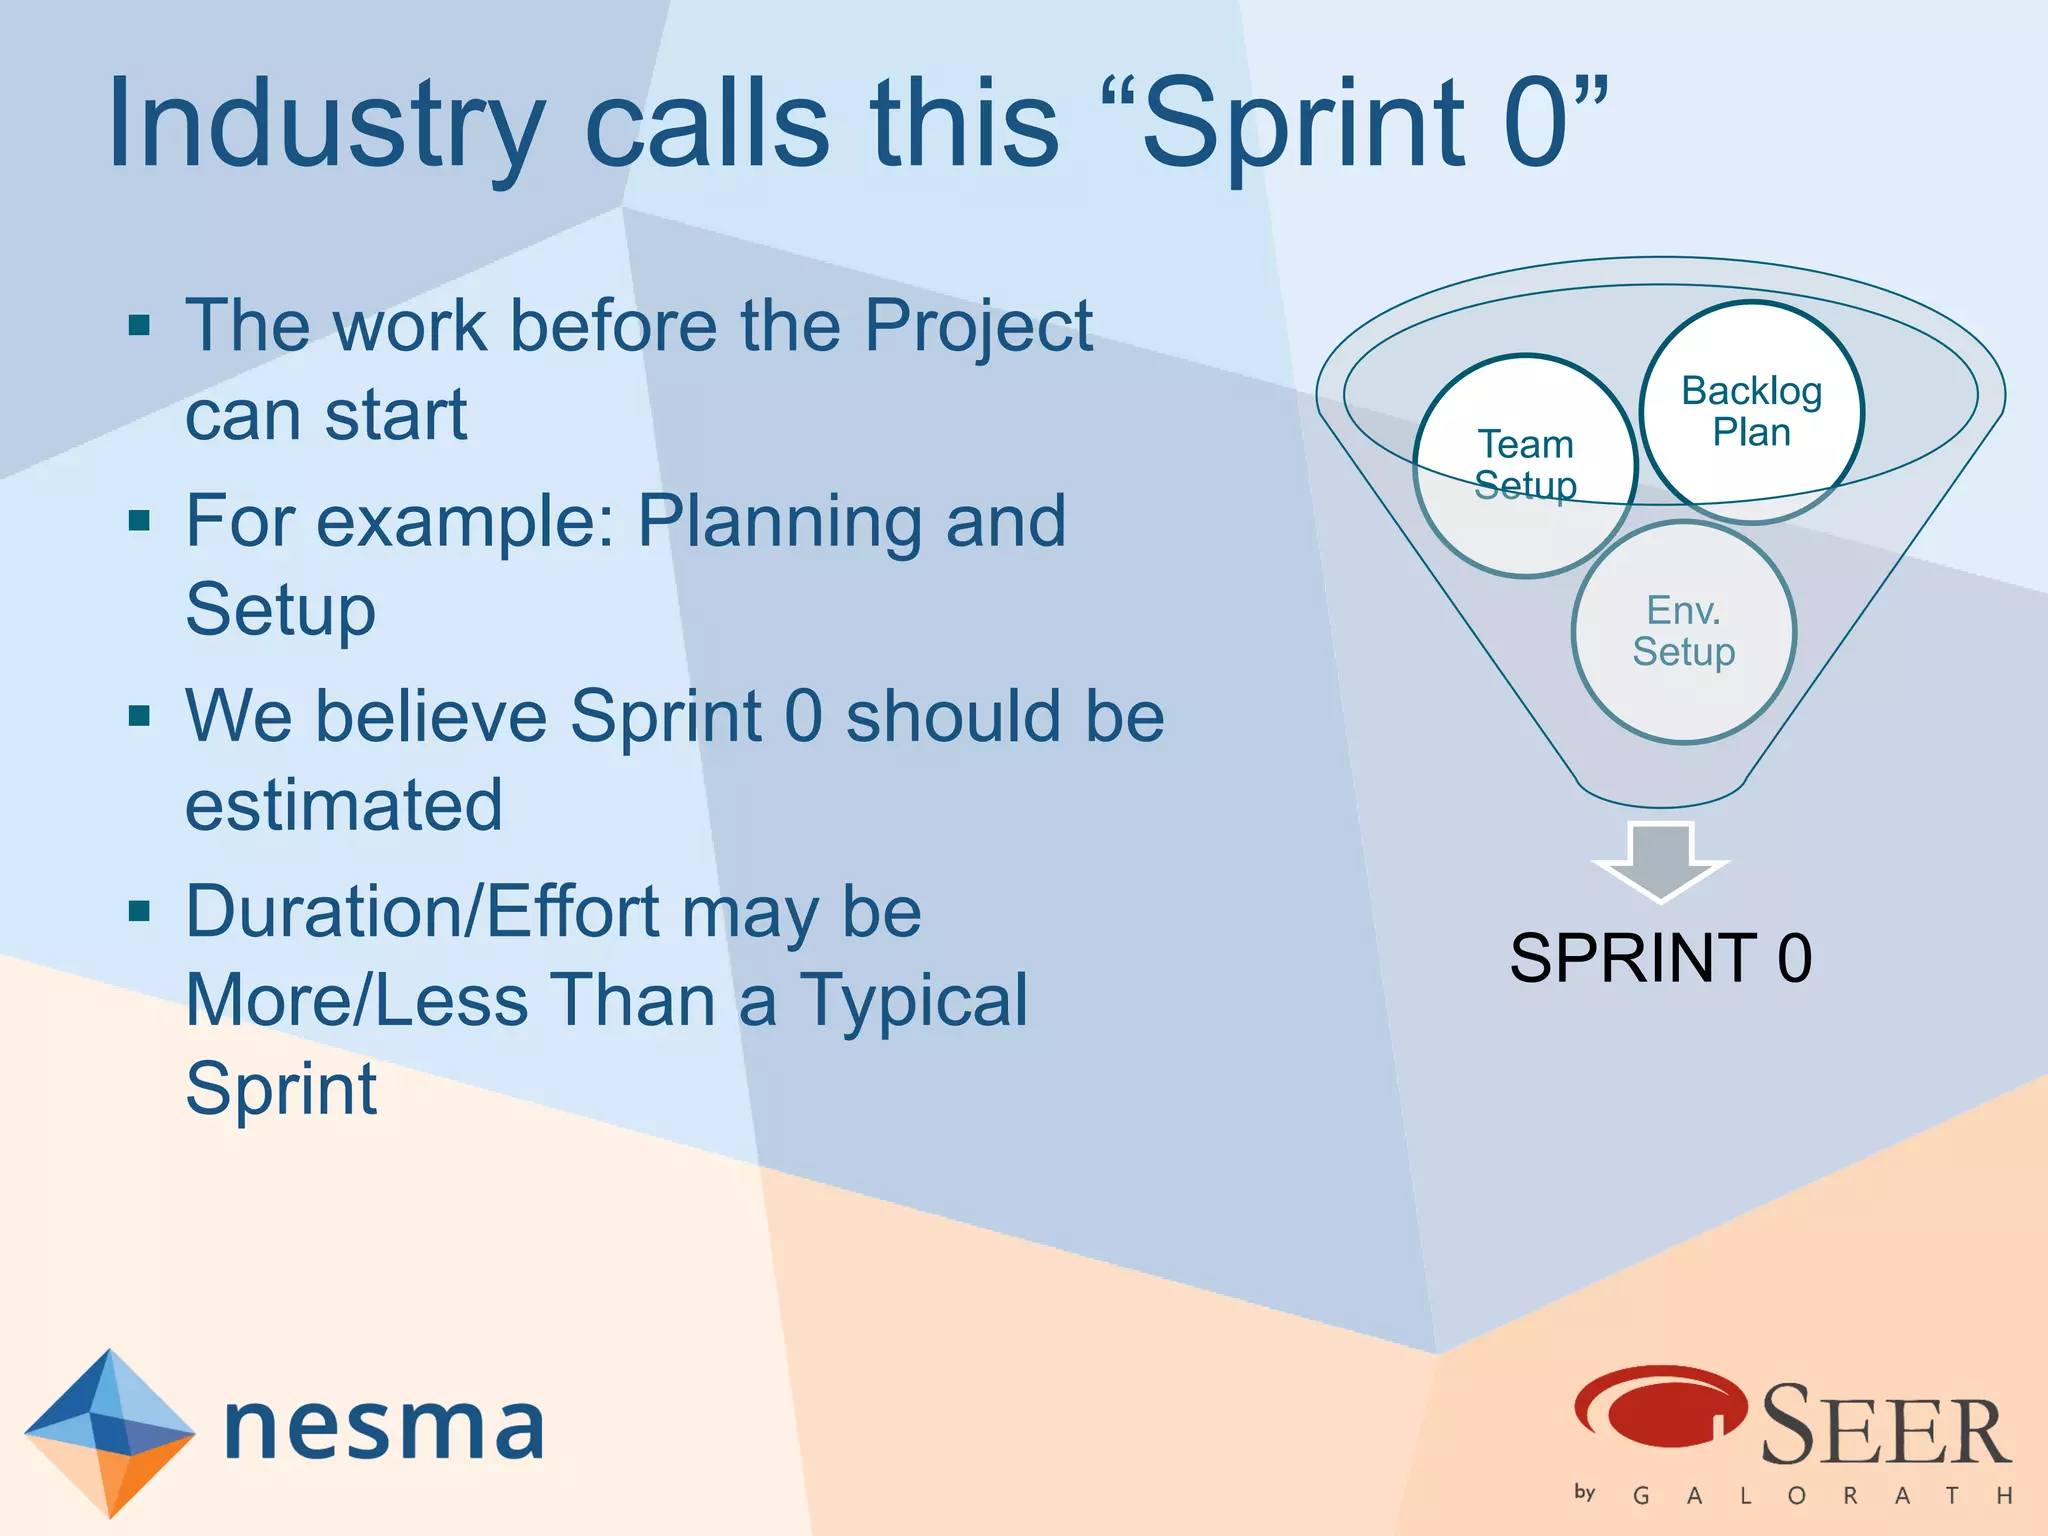
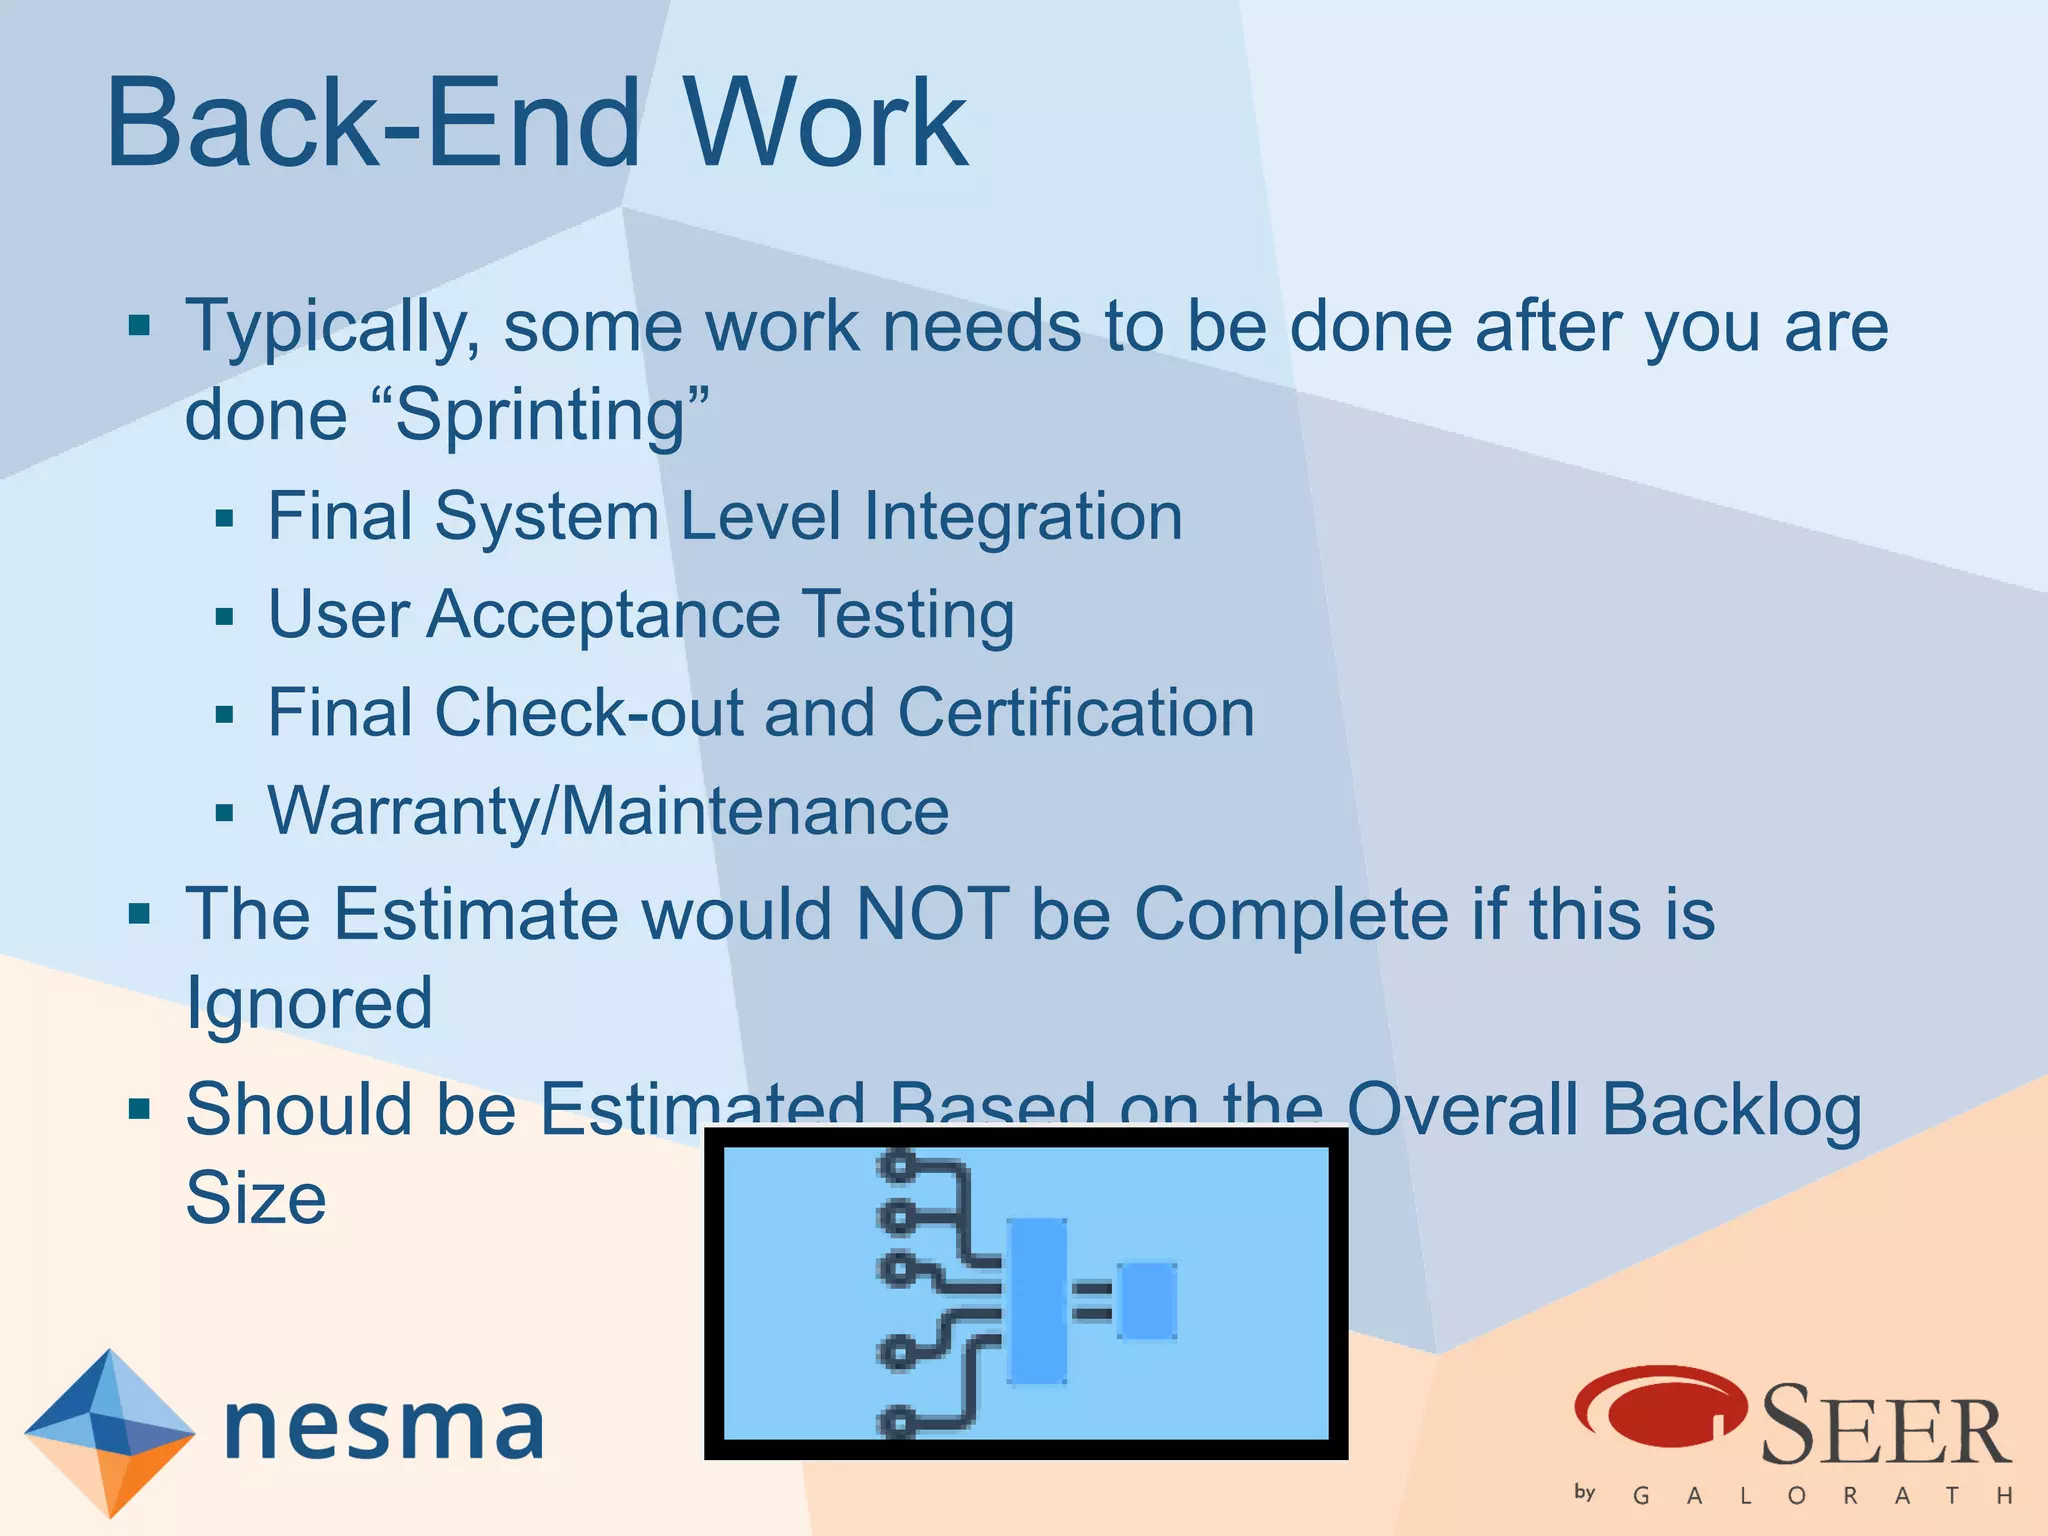
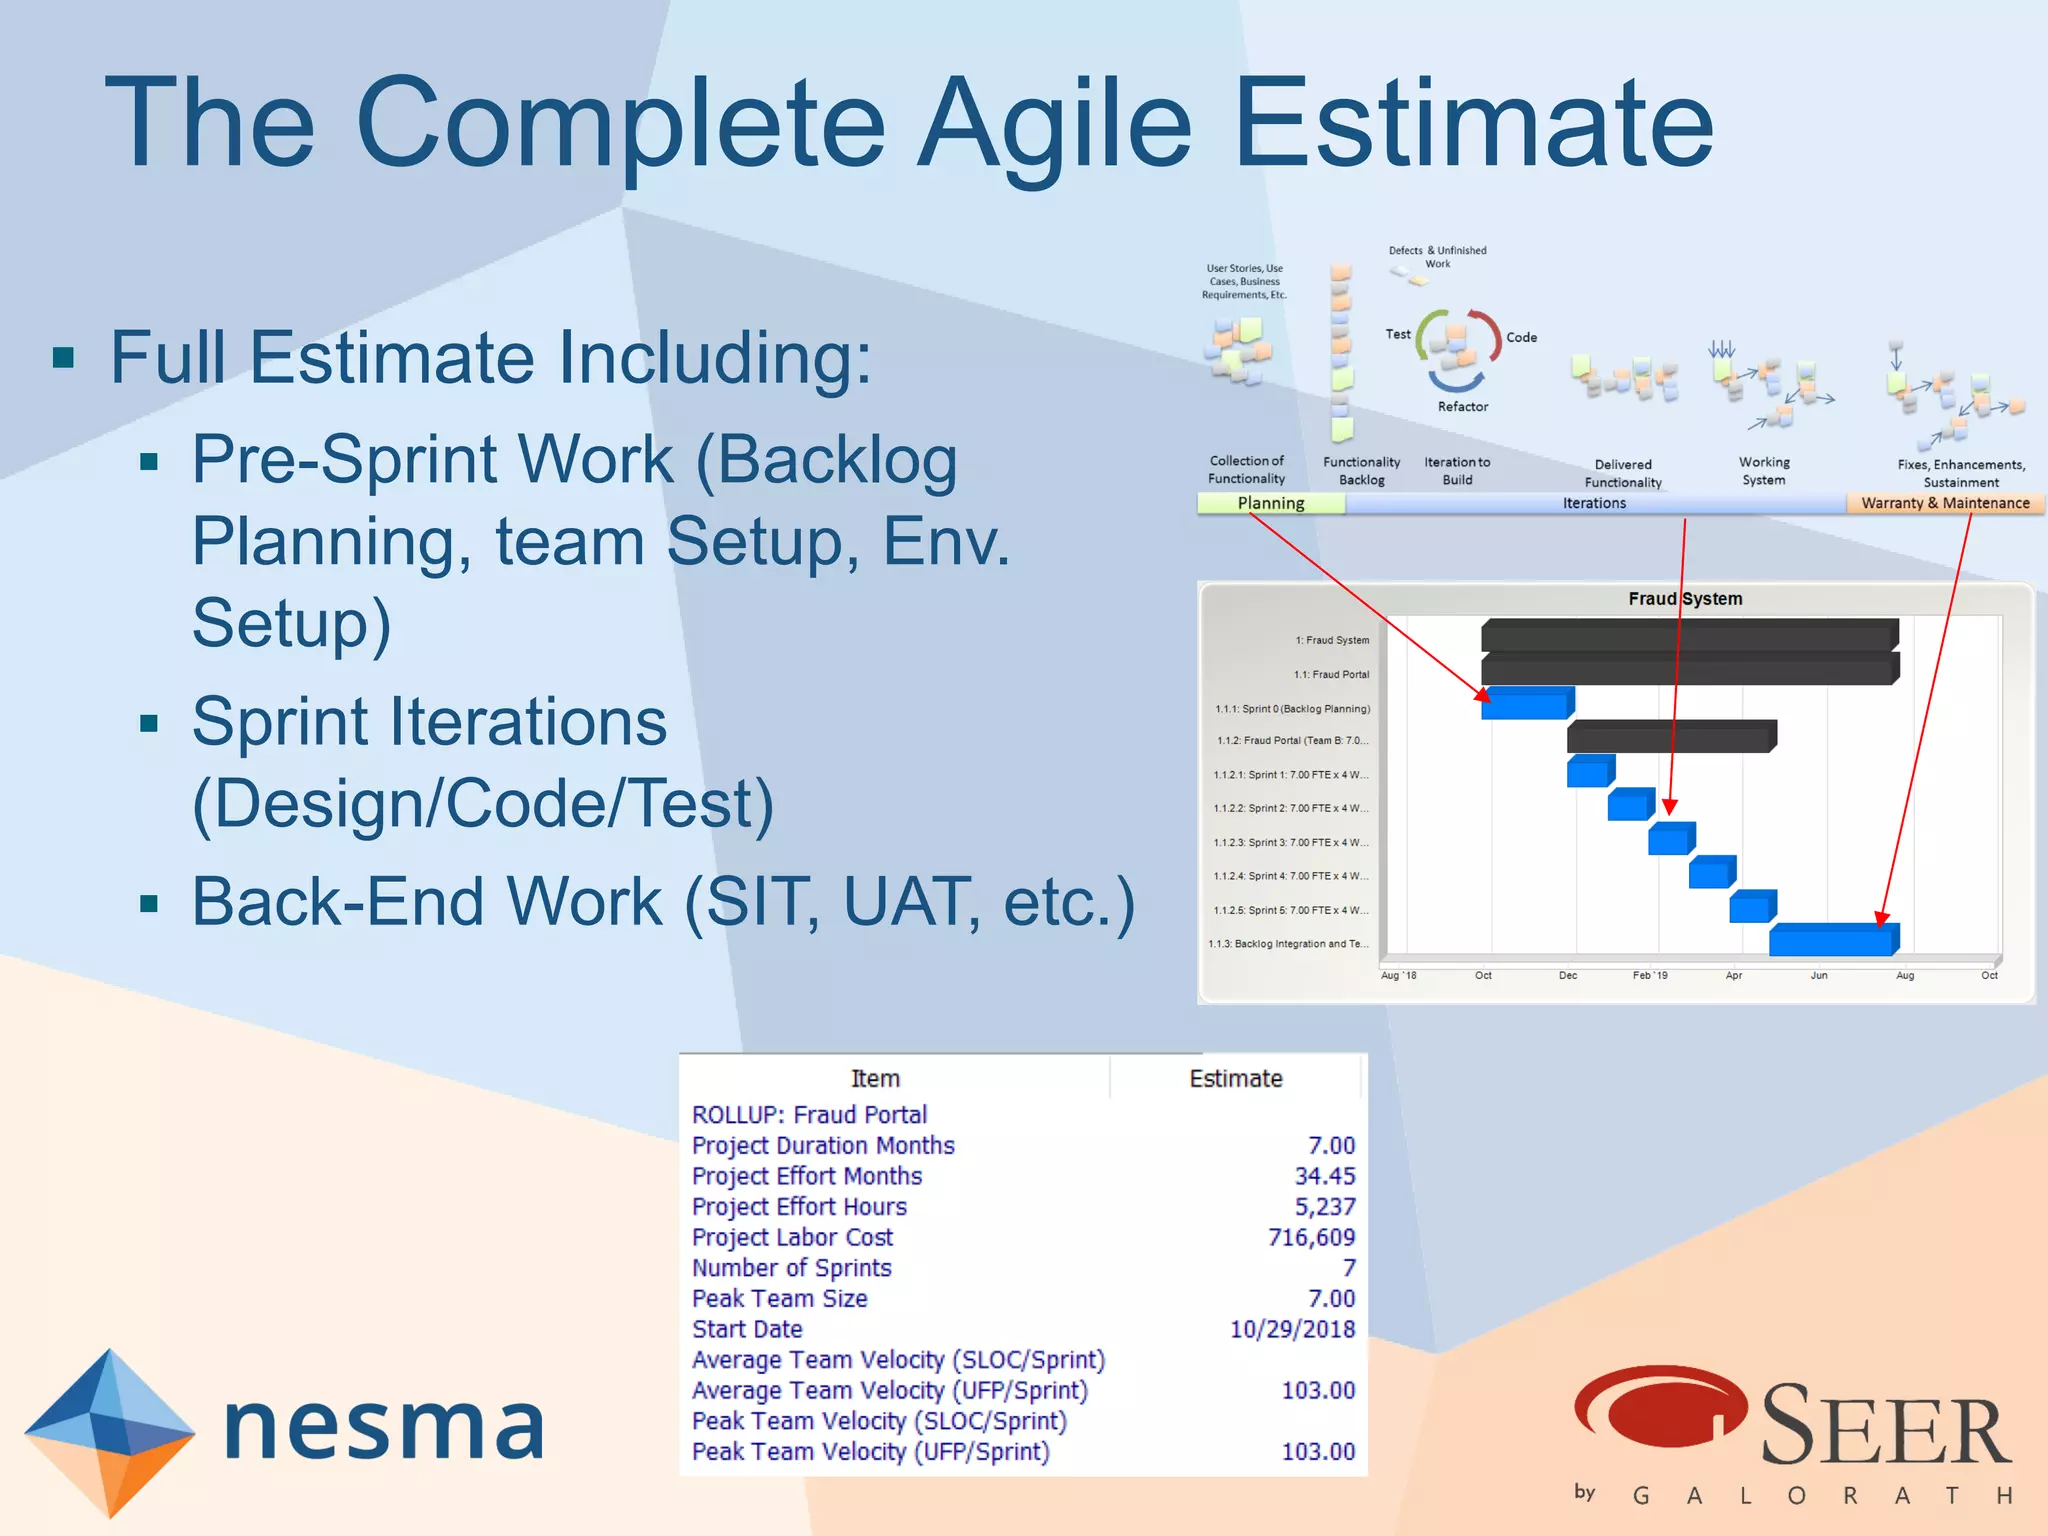


Esteban Sanchez from Galorath Incorporated gave a presentation on estimating agile software projects. He discussed that while some argue estimates provide little value, organizations need estimates for planning and accountability. He presented different types of estimates including backlog estimates for high-level analysis and sprint estimates for team planning. Key factors for estimates include size metrics, team dynamics like velocity, and project characteristics. Story points should be supplemented with a standard metric like function points. Sprint 0 and back-end work like integration and testing also need to be estimated for a complete agile project estimate.