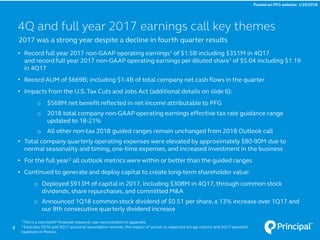
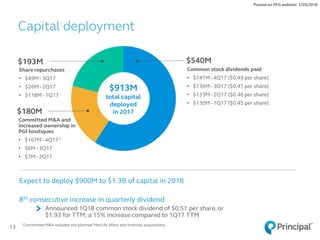
SlideShare a Scribd company logo
Principal Financial Group
®
Fourth Quarter 2017 Earnings Results
January 29, 2018
A non-GAAP financial measure is a numerical measure of performance,financial position, or
cash flows that includes adjustments from a comparable financial measure presented in
accordance with U.S. GAAP.
The company uses a number of non-GAAP financial measures management believes are useful
to investors because they illustrate the performance of the company’s normal, ongoing
operations which is important in understanding and evaluating the company’s financial
condition and results of operations. While such measures are also consistent with measures
utilized by investors to evaluate performance,they are not, however,a substitute for U.S. GAAP
financial measures.Therefore,the company has provided reconciliations of the non-GAAP
financial measures to the most directly comparable U.S. GAAP financial measure within the
slides. The company adjusts U.S. GAAP financial measures for items not directly related to
ongoing operations. However, it is possible these adjusting items have occurred in the past and
could recur in future reporting periods. Management also uses non-GAAP financial measures
for goal setting, as a basis for determining employee and senior management awards and
compensation, and evaluating performance on a basis comparable to that used by investors
and securities analysts.
The company also uses a variety of other operational measures that do not have U.S. GAAP
counterparts, and therefore do not fit the definition of non-GAAP financial measures. Assets
under management is an example of an operational measure that is not considered a non-
GAAP financial measure.
2
Use of non-GAAP financial measures
Posted on PFG website: 1/29/2018
Certain statements made by the company which are not historical facts may be considered forward-looking statements,
including, without limitation, statements as to non-GAAP operating earnings, net income available to common
stockholders, net cash flows, realized and unrealized gains and losses, capital and liquidity positions, sales and earnings
trends, and management’s beliefs, expectations, goals and opinions. The company does not undertake to update these
statements, which are based on a number of assumptions concerning future conditions that may ultimately prove to be
inaccurate. Future events and their effects on the company may not be those anticipated, and actual results may differ
materially from the results anticipated in these forward-looking statements. The risks, uncertainties and factors that could
cause or contribute to such material differences are discussed in the company’s annual report on Form 10-K for the year
ended Dec. 31, 2016, and in the company’s quarterly report on Form 10-Q for the quarter ended Sept. 30, 2017, filed by
the company with the U.S. Securities and Exchange Commission, as updated or supplemented from time to time in
subsequent filings. These risks and uncertainties include, without limitation: adverse capital and credit market conditions
may significantly affect the company’s ability to meet liquidity needs, access to capital and cost of capital; conditions in the
global capital markets and the economy generally; volatility or declines in the equity, bond or real estate markets; changes
in interest rates or credit spreads or a sustained low interest rate environment; the company’s investment portfolio is
subject to several risks that may diminish the value of its invested assets and the investment returns credited to
customers; the company’s valuation of investments and the determination of the amount of allowances and impairments
taken on such investments may include methodologies, estimations and assumptions that are subject to differing
interpretations; any impairments of or valuation allowances against the company’s deferred tax assets; the company’s
actual experience could differ significantly from its pricing and reserving assumptions; the pattern of amortizing the
company’s DAC and other actuarial balances on its universal life-type insurance contracts, participating life insurance
policies and certain investment contracts may change; changes in laws, regulations or accounting standards; the company
may not be able to protect its intellectual property and may be subject to infringement claims; the company’s ability to
pay stockholder dividends and meet its obligations may be constrained by the limitations on dividends Iowa insurance laws
impose on Principal Life; litigation and regulatory investigations; from time to time the company may become subject to
tax audits, tax litigation or similar proceedings, and as a result it may owe additional taxes, interest and penalties in
amounts that may be material; applicable laws and the company’s certificate of incorporation and by-laws may discourage
takeovers and business combinations that some stockholders might consider in their best interests; competition, including
from companies that may have greater financial resources, broader arrays of products, higher ratings and stronger
financial performance; a downgrade in the company’s financial strength or credit ratings; client terminations, withdrawals
or changes in investor preferences; inability to attract and retain qualified employees and sales representatives and
develop new distribution sources; an interruption in telecommunication, information technology or other systems, or a
failure to maintain the confidentiality, integrity or availability of data residing on such systems; international business risks;
fluctuations in foreign currency exchange rates; the company may need to fund deficiencies in its “Closed Block” assets;
the company’s reinsurers could default on their obligations or increase their rates; risks arising from acquisitions of
businesses; and loss of key vendor relationships or failure of a vendor to protect information of our customers or
employees.
Forward looking statements
3
Posted on PFG website: 1/29/2018
• Record full year 2017 non-GAAP operating earnings1 of $1.5B including $351M in 4Q17
and record full year 2017 non-GAAP operating earnings per diluted share1 of $5.04 including $1.19
in 4Q17
• Record AUM of $669B; including $1.4B of total company net cash flows in the quarter
• Impacts from the U.S. Tax Cuts and Jobs Act (additional details on slide 6):
o $568M net benefit reflected in net income attributable to PFG
o 2018 total company non-GAAP operating earnings effective tax rate guidance range
updated to 18-21%
o All other non-tax 2018 guided ranges remain unchanged from 2018 Outlook call
• Total company quarterly operating expenses were elevated by approximately $80-90M due to
normal seasonality and timing, one-time expenses, and increased investment in the business
• For the full year2 all outlook metrics were within or better than the guided ranges
• Continued to generate and deploy capital to create long-term shareholder value:
o Deployed $913M of capital in 2017, including $308M in 4Q17, through common stock
dividends, share repurchases, and committed M&A
o Announced 1Q18 common stock dividend of $0.51 per share, a 13% increase over 1Q17 and
our 8th consecutive quarterly dividend increase
2017 was a strong year despite a decline in fourth quarter results
4Q and full year 2017 earnings call key themes
4
1This is a non-GAAP financial measure; see reconciliation in appendix.
2 Excludes 3Q16 and 3Q17 actuarial assumption reviews, the impact of actual vs. expected encaje returns and 2Q17 elevated
expenses in Mexico.
Posted on PFG website: 1/29/2018
Percentage of Principal actively managed mutual funds, exchange traded funds (ETFs), insurance
separate accounts, and collective investment trusts (CITs)1 in the top two Morningstar quartiles
42%
73%
86%
69% 71%
88%
1-Year 3-Year 5-Year
Dec. 31, 2016
Sep. 30, 2017
Dec. 31, 2017
1Excludes Money Market, Stable Value, Liability Driven Investment (Short, Intermediate and Extended Duration),
Hedge Fund Separate Account, & US Property Separate Account.5
Strong investment performance continues
76%
Dec. 31 2017
69%
Dec. 31 2017
83%
Dec. 31 2017
Posted on PFG website: 1/29/2018
6
Impacts of U.S. Tax Cuts and Jobs Act
2018 effective tax rate guidance
Guidance provided
Dec. 12, 2017
Updated guidance
Total company U.S. GAAP net income effective
tax rate
16-18% 14-17%
Total company non-GAAP operating earnings effective
tax rate1 21-23% 18-21%
4Q17 impacts
Net income:
• $626M benefit from the re-measurement of our net deferred tax liability using the lower corporate tax rate
• $43M one-time deemed repatriation tax expense on foreign earnings
• $14M tax expense from other provisions
2017 estimated RBC ratio:
• Immaterial impact on the year-end 2017 estimated RBC ratio
1 The operating earnings effective tax rate is a non-GAAP measure and differs from the U.S. GAAP net income effective tax
rate primarily due to net realized capital gains and losses (NRCG).
$401 $413
4Q16
reported
4Q17
reported
Highlights
• Growth in pre-tax operating earnings was driven by higher net
revenue on increased account values partially offset by lower net
investment income and higher operating expenses
• Fundamentals remain strong; $11.8B in sales for 2017,up 9% from
prior year, full year recurring deposits grew 6%, and defined
contribution contract count increased by nearly 800 over prior year
• On a trailing twelve month basis1 net revenue growth and pre-tax
return on net revenue were at the top end or above the 2017
guidance ranges
7
1Excludes 3Q16 and 3Q17 actuarial assumption reviews.
All financial information rounded to the nearest million. Change and growth rates calculated
using data from financial supplement.
Retirement and Income Solutions – Fee (RIS – Fee)
Net revenue ($M)
Quarterly basis
increase in
net revenue
pre-tax return on
net revenue
Trailing twelve month basis1
5%
35%
Posted on PFG website: 1/29/2018
+3%
Reported
pre-tax operating earnings ($M)
4Q17 $127
4Q16 $124
Change +$3 (+2%)
$133 $124
4Q16
reported
4Q17
reported
Retirement and Income Solutions - Spread (RIS – Spread)
8
1Excludes higher variable investment income in 4Q16.
2Excludes 3Q16 and 3Q17 actuarial assumption reviews.
All financial information rounded to the nearest million. Change and growth rates
calculated using data from financial supplement.
Highlights
• Pre-tax operating earnings excluding significant variances1 were flat
as unfavorable mortality and higher operating expenses impacted
the current quarter
• Record full-year pension risk transfer sales of nearly $3B; pipeline
remains strong
• On a trailing twelve month basis2 net revenue growth and pre-tax
return on net revenue were at the top end or above the 2017
guidance ranges
Net revenue ($M)
Quarterly basis
Reported
pre-tax operating
earnings ($M)
Significant
variances1 ($M)
Pre-tax operating
earnings ex
significant
variances ($M)
4Q17 $75 $75
4Q16 $88 -$12 $75
Change -$12 (-14%) $0 (0%)
increase in
net revenue
pre-tax return on
net revenue
Trailing twelve month basis2
10%
65%
Posted on PFG website: 1/29/2018
-7%
$339 $335
4Q16
reported
4Q17
reported
Principal Global Investors
9
1This is a non-GAAP financial measure; see reconciliation in appendix.
All financial information rounded to the nearest million. Change and growth
rates calculated using data from financial supplement.
Highlights
• Pre-tax operating earnings declined as management fee growth of
10% was more than offset by lower performance fees
• Record AUM of $431B increased 10% compared to the year ago
quarter, including PGI sourced AUM of $219B
• On a trailing twelve month basis operating revenues less pass-
through commissions1 growth and pre-tax return on operating
revenues less pass-through commissions were within the 2017
guidance ranges
Operating revenues less
pass-through commissions ($M)
Quarterly basis
Reported
pre-tax operating earnings ($M)
4Q17 $124
4Q16 $134
Change -$10 (-7%)
increase in
operating revenues less
pass-through commissions
pre-tax return on
operating revenues less
pass-through commissions
Trailing twelve month basis
5%
37%
Posted on PFG website: 1/29/2018
-1%
$198
$238
4Q16
reported
4Q17
reported
Highlights
• Pre-tax operating earnings excluding significant variances1 improved
9% over the prior year quarter due to growth in the business
• Record reported AUM of $161B increased 17% over 4Q16, including
record AUM in Chile, Hong Kong and Southeast Asia
• $2.5B of net cash flows in the quarter, marking the 37th consecutive
quarter of positive net cash flows
• On a trailing twelve month combined2 basis3 (at PFG share) net
revenue4 growth and pre-tax return on net revenue were within the
2017 guidance ranges
Principal International
1Excludes the impact of actual vs. expected encaje returns.
2Combined basis includes all Principal International companies at 100%.
3Excludes 3Q16 and 3Q17 actuarial assumption reviews, the impact of actual vs. expected
encaje returns and 2Q17 elevated expenses in Mexico.
4This is a non-GAAP financial measure; see reconciliation in appendix.
All financial information rounded to the nearest million. Change and growth rates
calculated using data from financial supplement.
10
Combined net revenue
(at PFG share) ($M)
Quarterly basis
3%
35%
13%
38%
increase in net revenue
pre-tax return on
net revenue
Trailing twelve month combined basis3
(at PFG share)Reported
pre-tax operating
earnings ($M)
Significant
variances1 ($M)
Pre-tax operating
earnings ex
significant
variances ($M)
4Q17 $78 +$6 $84
4Q16 $66 +$11 $77
Change +$12 (+19%) +$7 (+9%)
Posted on PFG website: 1/29/2018
+20%
$479 $521
4Q16
reported
4Q17
reported
1Excludes higher variable investment income in 4Q16.
2Excludes 3Q16 and 3Q17 actuarial assumption reviews.
All financial information rounded to the nearest million. Change and growth rates
calculated using data from financial supplement.
Specialty Benefits
Highlights
• Pre-tax operating earnings excluding significant variances1
decreased over the prior year quarter due to growth in the business
being more than offset by higher operating expenses
• Premium and fees are up 9% over the prior year period reflecting
strong retention and employment growth
• On a trailing twelve month basis2 premium and fees growth, pre-tax
return on premium and fees, and loss ratio were within the 2017
guidance ranges
11
Quarterly basis
increase in
premium and fees
pre-tax return on
premium and fees
incurred loss ratio
Trailing twelve month basis2
9%
12%
Premium and fees ($M)
64%
Reported
pre-tax operating
earnings ($M)
Significant
variances1 ($M)
Pre-tax operating
earnings ex
significant
variances ($M)
4Q17 $63 $63
4Q16 $72 -$5 $67
Change -$9 (-13%) -$5 (-7%)
Posted on PFG website: 1/29/2018
+9%
$249 $268
4Q16
reported
4Q17
reported
1Excludes 3Q16 and 3Q17 actuarial assumption reviews.
All financial information rounded to the nearest million. Change and
growth rates calculated using data from financial supplement.
Individual Life
Highlights
• Pre-tax operating earnings increased primarily due to favorable
mortality in 4Q17 versus unfavorable mortality in 4Q16
• 8% increase in premium and fees driven by growth in the business
• On a trailing twelve month basis1 premium and fees growth and pre-
tax return on premium and fees were within the 2017 guidance
ranges
12
Quarterly basis
increase in
premium and fees
pre-tax return on
premium and fees
Trailing twelve month basis1
6%
16%
Premium and fees ($M)
Posted on PFG website: 1/29/2018
+8%
Reported
pre-tax operating earnings ($M)
4Q17 $48
4Q16 $35
Change +$13 (+38%)
Expect to deploy $900M to $1.3B of capital in 2018
8th consecutive increase in quarterly dividend
Announced 1Q18 common stock dividend of $0.51 per share, or
$1.93 for TTM; a 15% increase compared to 1Q17 TTM
13
Capital deployment
$913M
total capital
deployed
in 2017
Common stock dividends paid
• $141M- 4Q17 ($0.49 per share)
• $136M- 3Q17 ($0.47 per share)
• $133M- 2Q17 ($0.46 per share)
• $130M- 1Q17 ($0.45 per share)
Share repurchases
• $49M - 3Q17
• $26M - 2Q17
• $118M- 1Q17
$193M $540M
$180M
Committed M&A and
increased ownership in
PGI boutiques
• $167M- 4Q171
• $6M - 3Q17
• $7M - 2Q17
Posted on PFG website: 1/29/2018
1Committed M&A includes the planned MetLife Afore and Internos acquisitions.
14
(in millions)
Three Months Ended
Principal Global Investors Operating Revenues Less
Pass-Through Commissions
12/31/17 12/31/16
Principal Global Investors operating revenues $375.5 $380.1
Principal Global Investors commission expense (40.2) (41.0)
Principal Global Investors operating revenues less
pass-through commissions
$335.3 $339.1
Appendix
Non-GAAP financial measure reconciliations
(in millions)
Three Months Ended
Principal International Combined Net Revenue
(at PFG Share)
12/31/17 12/31/16
Principal International pre-tax operating earnings $78.3 $66.0
Principal International combined operating expenses
(at PFG share)
159.8 131.8
Principal International combined net revenue
(at PFG share)
$238.1 $197.8
(in millions)
Three Months Ended
Non-GAAP Operating Earnings (Losses) 12/31/17 12/31/16
Net income attributable to PFG $841.8 $318.0
Net realized capital (gains) losses, as adjusted 33.5 2.0
Other after-tax adjustments (524.5) 52.0
Non-GAAP operating earnings $350.8 $372.0
Per diluted share
Three Months Ended
Diluted Earnings Per Common Share 12/31/17 12/31/16
Net income $2.87 $1.09
Net realized capital (gains) losses, as adjusted 0.11 0.01
Other after-tax adjustments (1.79) 0.17
Non-GAAP operating earnings $1.19 $1.27
Weighted-average diluted common shares
outstanding (in millions) 293.5 292.0
Posted on PFG website: 1/29/2018
Definitions
Variable investment income includes certain types of investment returns such as prepayment
fees and income (loss) from certain elements of our alternative asset classes, including results of
value-add real estate sales activity.

More Related Content

What's hot

2Q 2018 Earnings Conference Call Presentation
2Q 2018 Earnings Conference Call Presentation 2Q 2018 Earnings Conference Call Presentation
2Q 2018 Earnings Conference Call Presentation
investors_principalfinancial
 
4Q 2013 Earnings Conference Call Presentation
4Q 2013 Earnings Conference Call Presentation4Q 2013 Earnings Conference Call Presentation
4Q 2013 Earnings Conference Call Presentation
investors_principalfinancial
 
1Q 2015 Earnings Conference Call Presentation
1Q 2015 Earnings Conference Call Presentation1Q 2015 Earnings Conference Call Presentation
1Q 2015 Earnings Conference Call Presentation
investors_principalfinancial
 
First Quarter 2014 Earnings Call Presentation - Principal Financial Group
First Quarter 2014 Earnings Call Presentation - Principal Financial GroupFirst Quarter 2014 Earnings Call Presentation - Principal Financial Group
First Quarter 2014 Earnings Call Presentation - Principal Financial Group
investors_principalfinancial
 
The Principal Financial Group 101
The Principal Financial Group 101The Principal Financial Group 101
The Principal Financial Group 101
investors_principalfinancial
 
3Q 2016 Earnings Conference Call Presentation
3Q 2016 Earnings Conference Call Presentation3Q 2016 Earnings Conference Call Presentation
3Q 2016 Earnings Conference Call Presentation
investors_principalfinancial
 
4Q 2014 Earnings Conference Call Presentation
4Q 2014 Earnings Conference Call Presentation4Q 2014 Earnings Conference Call Presentation
4Q 2014 Earnings Conference Call Presentation
investors_principalfinancial
 
3Q 2014 Earnings Conference Call Presentation
3Q 2014 Earnings Conference Call Presentation3Q 2014 Earnings Conference Call Presentation
3Q 2014 Earnings Conference Call Presentation
investors_principalfinancial
 
Aimia Q1 2017 Financial Results
Aimia Q1 2017 Financial ResultsAimia Q1 2017 Financial Results
Aimia Q1 2017 Financial Results
Aimia's Investor Presentations
 
Inv pres q2_2017_final
Inv pres q2_2017_finalInv pres q2_2017_final
Inv pres q2_2017_final
CNOServices
 
Q2 2017 Financial Highlights
Q2 2017 Financial HighlightsQ2 2017 Financial Highlights
Q2 2017 Financial Highlights
Aimia's Investor Presentations
 
3Q 2013 Earnings Conference Call Presentation
3Q 2013 Earnings Conference Call Presentation3Q 2013 Earnings Conference Call Presentation
3Q 2013 Earnings Conference Call Presentation
investors_principalfinancial
 
3Q 2015 Earnings Conference Call Presentation
3Q 2015 Earnings Conference Call Presentation3Q 2015 Earnings Conference Call Presentation
3Q 2015 Earnings Conference Call Presentation
investors_principalfinancial
 
2Q 2015 Earnings Conference Call Presentation
2Q 2015 Earnings Conference Call Presentation2Q 2015 Earnings Conference Call Presentation
2Q 2015 Earnings Conference Call Presentation
investors_principalfinancial
 
The Principal Financial Group 101
The Principal Financial Group 101The Principal Financial Group 101
The Principal Financial Group 101
investors_principalfinancial
 
Aimia Q4 2016 Financial Highlights Presentation
Aimia Q4 2016 Financial Highlights PresentationAimia Q4 2016 Financial Highlights Presentation
Aimia Q4 2016 Financial Highlights Presentation
Aimia's Investor Presentations
 
3Q 2017 Earnings Conference Call Presentation
3Q 2017 Earnings Conference Call Presentation 3Q 2017 Earnings Conference Call Presentation
3Q 2017 Earnings Conference Call Presentation
investors_principalfinancial
 
Sem group earnings presentation 4q and fy 2017 final
Sem group earnings presentation 4q and fy 2017 finalSem group earnings presentation 4q and fy 2017 final
Sem group earnings presentation 4q and fy 2017 final
SemGroupCorporation
 

What's hot (19)

2Q 2018 Earnings Conference Call Presentation
2Q 2018 Earnings Conference Call Presentation 2Q 2018 Earnings Conference Call Presentation
2Q 2018 Earnings Conference Call Presentation
 
4Q 2013 Earnings Conference Call Presentation
4Q 2013 Earnings Conference Call Presentation4Q 2013 Earnings Conference Call Presentation
4Q 2013 Earnings Conference Call Presentation
 
1Q 2015 Earnings Conference Call Presentation
1Q 2015 Earnings Conference Call Presentation1Q 2015 Earnings Conference Call Presentation
1Q 2015 Earnings Conference Call Presentation
 
First Quarter 2014 Earnings Call Presentation - Principal Financial Group
First Quarter 2014 Earnings Call Presentation - Principal Financial GroupFirst Quarter 2014 Earnings Call Presentation - Principal Financial Group
First Quarter 2014 Earnings Call Presentation - Principal Financial Group
 
The Principal Financial Group 101
The Principal Financial Group 101The Principal Financial Group 101
The Principal Financial Group 101
 
3Q 2016 Earnings Conference Call Presentation
3Q 2016 Earnings Conference Call Presentation3Q 2016 Earnings Conference Call Presentation
3Q 2016 Earnings Conference Call Presentation
 
4Q 2014 Earnings Conference Call Presentation
4Q 2014 Earnings Conference Call Presentation4Q 2014 Earnings Conference Call Presentation
4Q 2014 Earnings Conference Call Presentation
 
3Q 2014 Earnings Conference Call Presentation
3Q 2014 Earnings Conference Call Presentation3Q 2014 Earnings Conference Call Presentation
3Q 2014 Earnings Conference Call Presentation
 
Aimia Q1 2017 Financial Results
Aimia Q1 2017 Financial ResultsAimia Q1 2017 Financial Results
Aimia Q1 2017 Financial Results
 
Inv pres q2_2017_final
Inv pres q2_2017_finalInv pres q2_2017_final
Inv pres q2_2017_final
 
Q2 2017 Financial Highlights
Q2 2017 Financial HighlightsQ2 2017 Financial Highlights
Q2 2017 Financial Highlights
 
2 q13 earnings-call-slides
2 q13 earnings-call-slides2 q13 earnings-call-slides
2 q13 earnings-call-slides
 
3Q 2013 Earnings Conference Call Presentation
3Q 2013 Earnings Conference Call Presentation3Q 2013 Earnings Conference Call Presentation
3Q 2013 Earnings Conference Call Presentation
 
3Q 2015 Earnings Conference Call Presentation
3Q 2015 Earnings Conference Call Presentation3Q 2015 Earnings Conference Call Presentation
3Q 2015 Earnings Conference Call Presentation
 
2Q 2015 Earnings Conference Call Presentation
2Q 2015 Earnings Conference Call Presentation2Q 2015 Earnings Conference Call Presentation
2Q 2015 Earnings Conference Call Presentation
 
The Principal Financial Group 101
The Principal Financial Group 101The Principal Financial Group 101
The Principal Financial Group 101
 
Aimia Q4 2016 Financial Highlights Presentation
Aimia Q4 2016 Financial Highlights PresentationAimia Q4 2016 Financial Highlights Presentation
Aimia Q4 2016 Financial Highlights Presentation
 
3Q 2017 Earnings Conference Call Presentation
3Q 2017 Earnings Conference Call Presentation 3Q 2017 Earnings Conference Call Presentation
3Q 2017 Earnings Conference Call Presentation
 
Sem group earnings presentation 4q and fy 2017 final
Sem group earnings presentation 4q and fy 2017 finalSem group earnings presentation 4q and fy 2017 final
Sem group earnings presentation 4q and fy 2017 final
 

Similar to 4Q 2017 Earnings Conference Call Presentation

1Q 2019 Earnings Conference Call Presentation
1Q 2019 Earnings Conference Call Presentation 1Q 2019 Earnings Conference Call Presentation
1Q 2019 Earnings Conference Call Presentation
investors_principalfinancial
 
4Q 2015 Earnings Conference Call Presentation
4Q 2015 Earnings Conference Call Presentation4Q 2015 Earnings Conference Call Presentation
4Q 2015 Earnings Conference Call Presentation
investors_principalfinancial
 
1Q 2016 Earnings Conference Call Presentation
1Q 2016 Earnings Conference Call Presentation1Q 2016 Earnings Conference Call Presentation
1Q 2016 Earnings Conference Call Presentation
investors_principalfinancial
 
Sem group investor presentation november 2017 final
Sem group investor presentation november 2017 finalSem group investor presentation november 2017 final
Sem group investor presentation november 2017 final
SemGroupCorporation
 
Sem group earnings presentation 3q 2017 final
Sem group earnings presentation 3q 2017 finalSem group earnings presentation 3q 2017 final
Sem group earnings presentation 3q 2017 final
SemGroupCorporation
 
Sem group earnings presentation 3q 2017 final
Sem group earnings presentation 3q 2017 finalSem group earnings presentation 3q 2017 final
Sem group earnings presentation 3q 2017 final
SemGroupCorporation
 
First Quarter 2015 Earnings Call Presentation
First Quarter 2015 Earnings Call PresentationFirst Quarter 2015 Earnings Call Presentation
First Quarter 2015 Earnings Call Presentation
investors_principalfinancial
 
2Q 2017 Earnings Conference Call Presentation
2Q 2017 Earnings Conference Call Presentation 2Q 2017 Earnings Conference Call Presentation
2Q 2017 Earnings Conference Call Presentation
investors_principalfinancial
 
SemGroup Earnings Presentation First Quarter 2017
SemGroup Earnings Presentation First Quarter 2017 SemGroup Earnings Presentation First Quarter 2017
SemGroup Earnings Presentation First Quarter 2017
SemGroupCorporation
 
Sem group earnings-presentation-1q-2017-final
Sem group earnings-presentation-1q-2017-finalSem group earnings-presentation-1q-2017-final
Sem group earnings-presentation-1q-2017-final
SemGroupCorporation
 
Sem group investor presentation post 4Q and FY 2016 earnings final
Sem group investor presentation post 4Q and FY 2016 earnings finalSem group investor presentation post 4Q and FY 2016 earnings final
Sem group investor presentation post 4Q and FY 2016 earnings final
SemGroupCorporation
 
Sem group investor presentation february 2017 final
Sem group investor presentation february 2017 finalSem group investor presentation february 2017 final
Sem group investor presentation february 2017 final
SemGroupCorporation
 
Sem group investor-presentation-march-2018-final
Sem group investor-presentation-march-2018-finalSem group investor-presentation-march-2018-final
Sem group investor-presentation-march-2018-final
SemGroupCorporation
 
Sem group investor presentation march 2018 final
Sem group investor presentation march 2018 finalSem group investor presentation march 2018 final
Sem group investor presentation march 2018 final
SemGroupCorporation
 
Sem group earnings presentation 2q 2017 final
Sem group earnings presentation 2q 2017 finalSem group earnings presentation 2q 2017 final
Sem group earnings presentation 2q 2017 final
SemGroupCorporation
 
Sem group earnings presentation 1q 2018 final
Sem group earnings presentation 1q 2018 finalSem group earnings presentation 1q 2018 final
Sem group earnings presentation 1q 2018 final
SemGroupCorporation
 
The Principal Financial Group 101: May 2017
The Principal Financial Group 101: May 2017The Principal Financial Group 101: May 2017
The Principal Financial Group 101: May 2017
investors_principalfinancial
 
LendingClub Stockholder Outreach 2019 Presentation
LendingClub Stockholder Outreach 2019 PresentationLendingClub Stockholder Outreach 2019 Presentation
LendingClub Stockholder Outreach 2019 Presentation
Tearsheet
 

Similar to 4Q 2017 Earnings Conference Call Presentation (19)

1Q 2019 Earnings Conference Call Presentation
1Q 2019 Earnings Conference Call Presentation 1Q 2019 Earnings Conference Call Presentation
1Q 2019 Earnings Conference Call Presentation
 
4Q 2015 Earnings Conference Call Presentation
4Q 2015 Earnings Conference Call Presentation4Q 2015 Earnings Conference Call Presentation
4Q 2015 Earnings Conference Call Presentation
 
1Q 2016 Earnings Conference Call Presentation
1Q 2016 Earnings Conference Call Presentation1Q 2016 Earnings Conference Call Presentation
1Q 2016 Earnings Conference Call Presentation
 
Sem group investor presentation november 2017 final
Sem group investor presentation november 2017 finalSem group investor presentation november 2017 final
Sem group investor presentation november 2017 final
 
3 q14 earnings-call-presentation
3 q14 earnings-call-presentation3 q14 earnings-call-presentation
3 q14 earnings-call-presentation
 
Sem group earnings presentation 3q 2017 final
Sem group earnings presentation 3q 2017 finalSem group earnings presentation 3q 2017 final
Sem group earnings presentation 3q 2017 final
 
Sem group earnings presentation 3q 2017 final
Sem group earnings presentation 3q 2017 finalSem group earnings presentation 3q 2017 final
Sem group earnings presentation 3q 2017 final
 
First Quarter 2015 Earnings Call Presentation
First Quarter 2015 Earnings Call PresentationFirst Quarter 2015 Earnings Call Presentation
First Quarter 2015 Earnings Call Presentation
 
2Q 2017 Earnings Conference Call Presentation
2Q 2017 Earnings Conference Call Presentation 2Q 2017 Earnings Conference Call Presentation
2Q 2017 Earnings Conference Call Presentation
 
SemGroup Earnings Presentation First Quarter 2017
SemGroup Earnings Presentation First Quarter 2017 SemGroup Earnings Presentation First Quarter 2017
SemGroup Earnings Presentation First Quarter 2017
 
Sem group earnings-presentation-1q-2017-final
Sem group earnings-presentation-1q-2017-finalSem group earnings-presentation-1q-2017-final
Sem group earnings-presentation-1q-2017-final
 
Sem group investor presentation post 4Q and FY 2016 earnings final
Sem group investor presentation post 4Q and FY 2016 earnings finalSem group investor presentation post 4Q and FY 2016 earnings final
Sem group investor presentation post 4Q and FY 2016 earnings final
 
Sem group investor presentation february 2017 final
Sem group investor presentation february 2017 finalSem group investor presentation february 2017 final
Sem group investor presentation february 2017 final
 
Sem group investor-presentation-march-2018-final
Sem group investor-presentation-march-2018-finalSem group investor-presentation-march-2018-final
Sem group investor-presentation-march-2018-final
 
Sem group investor presentation march 2018 final
Sem group investor presentation march 2018 finalSem group investor presentation march 2018 final
Sem group investor presentation march 2018 final
 
Sem group earnings presentation 2q 2017 final
Sem group earnings presentation 2q 2017 finalSem group earnings presentation 2q 2017 final
Sem group earnings presentation 2q 2017 final
 
Sem group earnings presentation 1q 2018 final
Sem group earnings presentation 1q 2018 finalSem group earnings presentation 1q 2018 final
Sem group earnings presentation 1q 2018 final
 
The Principal Financial Group 101: May 2017
The Principal Financial Group 101: May 2017The Principal Financial Group 101: May 2017
The Principal Financial Group 101: May 2017
 
LendingClub Stockholder Outreach 2019 Presentation
LendingClub Stockholder Outreach 2019 PresentationLendingClub Stockholder Outreach 2019 Presentation
LendingClub Stockholder Outreach 2019 Presentation
 

More from investors_principalfinancial

3Q 2018 Earnings Conference Call Presentation
3Q 2018 Earnings Conference Call Presentation 3Q 2018 Earnings Conference Call Presentation
3Q 2018 Earnings Conference Call Presentation
investors_principalfinancial
 
Principal Investor Workshop 2017
Principal Investor Workshop 2017Principal Investor Workshop 2017
Principal Investor Workshop 2017
investors_principalfinancial
 
The Principal Financial Group 101
The Principal Financial Group 101The Principal Financial Group 101
The Principal Financial Group 101
investors_principalfinancial
 
Principal Financial Group 101
Principal Financial Group 101Principal Financial Group 101
Principal Financial Group 101
investors_principalfinancial
 
Principal Investor Day 2016
Principal Investor Day 2016Principal Investor Day 2016
Principal Investor Day 2016
investors_principalfinancial
 
Principal Financial Group Investor Workshop 2015
Principal Financial Group Investor Workshop 2015Principal Financial Group Investor Workshop 2015
Principal Financial Group Investor Workshop 2015
investors_principalfinancial
 
The Principal Financial Group 101
The Principal Financial Group 101The Principal Financial Group 101
The Principal Financial Group 101
investors_principalfinancial
 
The Principal Financial Group 101
The Principal Financial Group 101The Principal Financial Group 101
The Principal Financial Group 101
investors_principalfinancial
 

More from investors_principalfinancial (8)

3Q 2018 Earnings Conference Call Presentation
3Q 2018 Earnings Conference Call Presentation 3Q 2018 Earnings Conference Call Presentation
3Q 2018 Earnings Conference Call Presentation
 
Principal Investor Workshop 2017
Principal Investor Workshop 2017Principal Investor Workshop 2017
Principal Investor Workshop 2017
 
The Principal Financial Group 101
The Principal Financial Group 101The Principal Financial Group 101
The Principal Financial Group 101
 
Principal Financial Group 101
Principal Financial Group 101Principal Financial Group 101
Principal Financial Group 101
 
Principal Investor Day 2016
Principal Investor Day 2016Principal Investor Day 2016
Principal Investor Day 2016
 
Principal Financial Group Investor Workshop 2015
Principal Financial Group Investor Workshop 2015Principal Financial Group Investor Workshop 2015
Principal Financial Group Investor Workshop 2015
 
The Principal Financial Group 101
The Principal Financial Group 101The Principal Financial Group 101
The Principal Financial Group 101
 
The Principal Financial Group 101
The Principal Financial Group 101The Principal Financial Group 101
The Principal Financial Group 101
 

Recently uploaded

Corporate Presentation Probe June 2024.pdf
Corporate Presentation Probe June 2024.pdfCorporate Presentation Probe June 2024.pdf
Corporate Presentation Probe June 2024.pdf
Probe Gold
 
Investor Day 2024 Presentation Sysco 2024
Investor Day 2024 Presentation Sysco 2024Investor Day 2024 Presentation Sysco 2024
Investor Day 2024 Presentation Sysco 2024
Sysco_Investors
 
Collective Mining | Corporate Presentation - May 2024
Collective Mining | Corporate Presentation - May 2024Collective Mining | Corporate Presentation - May 2024
Collective Mining | Corporate Presentation - May 2024
CollectiveMining1
 
2024-deutsche-bank-global-consumer-conference.pdf
2024-deutsche-bank-global-consumer-conference.pdf2024-deutsche-bank-global-consumer-conference.pdf
2024-deutsche-bank-global-consumer-conference.pdf
Sysco_Investors
 
Snam 2023-27 Industrial Plan - Financial Presentation
Snam 2023-27 Industrial Plan - Financial PresentationSnam 2023-27 Industrial Plan - Financial Presentation
Snam 2023-27 Industrial Plan - Financial Presentation
Valentina Ottini
 
Osisko Development - Investor Presentation - June 24
Osisko Development - Investor Presentation - June 24Osisko Development - Investor Presentation - June 24
Osisko Development - Investor Presentation - June 24
Philip Rabenok
 
cyberagent_For New Investors_EN_240424.pdf
cyberagent_For New Investors_EN_240424.pdfcyberagent_For New Investors_EN_240424.pdf
cyberagent_For New Investors_EN_240424.pdf
CyberAgent, Inc.
 
一比一原版(UW毕业证)华盛顿大学毕业证成绩单专业办理
一比一原版(UW毕业证)华盛顿大学毕业证成绩单专业办理一比一原版(UW毕业证)华盛顿大学毕业证成绩单专业办理
一比一原版(UW毕业证)华盛顿大学毕业证成绩单专业办理
ybout
 

Recently uploaded (8)

Corporate Presentation Probe June 2024.pdf
Corporate Presentation Probe June 2024.pdfCorporate Presentation Probe June 2024.pdf
Corporate Presentation Probe June 2024.pdf
 
Investor Day 2024 Presentation Sysco 2024
Investor Day 2024 Presentation Sysco 2024Investor Day 2024 Presentation Sysco 2024
Investor Day 2024 Presentation Sysco 2024
 
Collective Mining | Corporate Presentation - May 2024
Collective Mining | Corporate Presentation - May 2024Collective Mining | Corporate Presentation - May 2024
Collective Mining | Corporate Presentation - May 2024
 
2024-deutsche-bank-global-consumer-conference.pdf
2024-deutsche-bank-global-consumer-conference.pdf2024-deutsche-bank-global-consumer-conference.pdf
2024-deutsche-bank-global-consumer-conference.pdf
 
Snam 2023-27 Industrial Plan - Financial Presentation
Snam 2023-27 Industrial Plan - Financial PresentationSnam 2023-27 Industrial Plan - Financial Presentation
Snam 2023-27 Industrial Plan - Financial Presentation
 
Osisko Development - Investor Presentation - June 24
Osisko Development - Investor Presentation - June 24Osisko Development - Investor Presentation - June 24
Osisko Development - Investor Presentation - June 24
 
cyberagent_For New Investors_EN_240424.pdf
cyberagent_For New Investors_EN_240424.pdfcyberagent_For New Investors_EN_240424.pdf
cyberagent_For New Investors_EN_240424.pdf
 
一比一原版(UW毕业证)华盛顿大学毕业证成绩单专业办理
一比一原版(UW毕业证)华盛顿大学毕业证成绩单专业办理一比一原版(UW毕业证)华盛顿大学毕业证成绩单专业办理
一比一原版(UW毕业证)华盛顿大学毕业证成绩单专业办理
 

4Q 2017 Earnings Conference Call Presentation

  • 1. Principal Financial Group ® Fourth Quarter 2017 Earnings Results January 29, 2018
  • 2. A non-GAAP financial measure is a numerical measure of performance,financial position, or cash flows that includes adjustments from a comparable financial measure presented in accordance with U.S. GAAP. The company uses a number of non-GAAP financial measures management believes are useful to investors because they illustrate the performance of the company’s normal, ongoing operations which is important in understanding and evaluating the company’s financial condition and results of operations. While such measures are also consistent with measures utilized by investors to evaluate performance,they are not, however,a substitute for U.S. GAAP financial measures.Therefore,the company has provided reconciliations of the non-GAAP financial measures to the most directly comparable U.S. GAAP financial measure within the slides. The company adjusts U.S. GAAP financial measures for items not directly related to ongoing operations. However, it is possible these adjusting items have occurred in the past and could recur in future reporting periods. Management also uses non-GAAP financial measures for goal setting, as a basis for determining employee and senior management awards and compensation, and evaluating performance on a basis comparable to that used by investors and securities analysts. The company also uses a variety of other operational measures that do not have U.S. GAAP counterparts, and therefore do not fit the definition of non-GAAP financial measures. Assets under management is an example of an operational measure that is not considered a non- GAAP financial measure. 2 Use of non-GAAP financial measures Posted on PFG website: 1/29/2018
  • 3. Certain statements made by the company which are not historical facts may be considered forward-looking statements, including, without limitation, statements as to non-GAAP operating earnings, net income available to common stockholders, net cash flows, realized and unrealized gains and losses, capital and liquidity positions, sales and earnings trends, and management’s beliefs, expectations, goals and opinions. The company does not undertake to update these statements, which are based on a number of assumptions concerning future conditions that may ultimately prove to be inaccurate. Future events and their effects on the company may not be those anticipated, and actual results may differ materially from the results anticipated in these forward-looking statements. The risks, uncertainties and factors that could cause or contribute to such material differences are discussed in the company’s annual report on Form 10-K for the year ended Dec. 31, 2016, and in the company’s quarterly report on Form 10-Q for the quarter ended Sept. 30, 2017, filed by the company with the U.S. Securities and Exchange Commission, as updated or supplemented from time to time in subsequent filings. These risks and uncertainties include, without limitation: adverse capital and credit market conditions may significantly affect the company’s ability to meet liquidity needs, access to capital and cost of capital; conditions in the global capital markets and the economy generally; volatility or declines in the equity, bond or real estate markets; changes in interest rates or credit spreads or a sustained low interest rate environment; the company’s investment portfolio is subject to several risks that may diminish the value of its invested assets and the investment returns credited to customers; the company’s valuation of investments and the determination of the amount of allowances and impairments taken on such investments may include methodologies, estimations and assumptions that are subject to differing interpretations; any impairments of or valuation allowances against the company’s deferred tax assets; the company’s actual experience could differ significantly from its pricing and reserving assumptions; the pattern of amortizing the company’s DAC and other actuarial balances on its universal life-type insurance contracts, participating life insurance policies and certain investment contracts may change; changes in laws, regulations or accounting standards; the company may not be able to protect its intellectual property and may be subject to infringement claims; the company’s ability to pay stockholder dividends and meet its obligations may be constrained by the limitations on dividends Iowa insurance laws impose on Principal Life; litigation and regulatory investigations; from time to time the company may become subject to tax audits, tax litigation or similar proceedings, and as a result it may owe additional taxes, interest and penalties in amounts that may be material; applicable laws and the company’s certificate of incorporation and by-laws may discourage takeovers and business combinations that some stockholders might consider in their best interests; competition, including from companies that may have greater financial resources, broader arrays of products, higher ratings and stronger financial performance; a downgrade in the company’s financial strength or credit ratings; client terminations, withdrawals or changes in investor preferences; inability to attract and retain qualified employees and sales representatives and develop new distribution sources; an interruption in telecommunication, information technology or other systems, or a failure to maintain the confidentiality, integrity or availability of data residing on such systems; international business risks; fluctuations in foreign currency exchange rates; the company may need to fund deficiencies in its “Closed Block” assets; the company’s reinsurers could default on their obligations or increase their rates; risks arising from acquisitions of businesses; and loss of key vendor relationships or failure of a vendor to protect information of our customers or employees. Forward looking statements 3 Posted on PFG website: 1/29/2018
  • 4. • Record full year 2017 non-GAAP operating earnings1 of $1.5B including $351M in 4Q17 and record full year 2017 non-GAAP operating earnings per diluted share1 of $5.04 including $1.19 in 4Q17 • Record AUM of $669B; including $1.4B of total company net cash flows in the quarter • Impacts from the U.S. Tax Cuts and Jobs Act (additional details on slide 6): o $568M net benefit reflected in net income attributable to PFG o 2018 total company non-GAAP operating earnings effective tax rate guidance range updated to 18-21% o All other non-tax 2018 guided ranges remain unchanged from 2018 Outlook call • Total company quarterly operating expenses were elevated by approximately $80-90M due to normal seasonality and timing, one-time expenses, and increased investment in the business • For the full year2 all outlook metrics were within or better than the guided ranges • Continued to generate and deploy capital to create long-term shareholder value: o Deployed $913M of capital in 2017, including $308M in 4Q17, through common stock dividends, share repurchases, and committed M&A o Announced 1Q18 common stock dividend of $0.51 per share, a 13% increase over 1Q17 and our 8th consecutive quarterly dividend increase 2017 was a strong year despite a decline in fourth quarter results 4Q and full year 2017 earnings call key themes 4 1This is a non-GAAP financial measure; see reconciliation in appendix. 2 Excludes 3Q16 and 3Q17 actuarial assumption reviews, the impact of actual vs. expected encaje returns and 2Q17 elevated expenses in Mexico. Posted on PFG website: 1/29/2018
  • 5. Percentage of Principal actively managed mutual funds, exchange traded funds (ETFs), insurance separate accounts, and collective investment trusts (CITs)1 in the top two Morningstar quartiles 42% 73% 86% 69% 71% 88% 1-Year 3-Year 5-Year Dec. 31, 2016 Sep. 30, 2017 Dec. 31, 2017 1Excludes Money Market, Stable Value, Liability Driven Investment (Short, Intermediate and Extended Duration), Hedge Fund Separate Account, & US Property Separate Account.5 Strong investment performance continues 76% Dec. 31 2017 69% Dec. 31 2017 83% Dec. 31 2017 Posted on PFG website: 1/29/2018
  • 6. Posted on PFG website: 1/29/2018 6 Impacts of U.S. Tax Cuts and Jobs Act 2018 effective tax rate guidance Guidance provided Dec. 12, 2017 Updated guidance Total company U.S. GAAP net income effective tax rate 16-18% 14-17% Total company non-GAAP operating earnings effective tax rate1 21-23% 18-21% 4Q17 impacts Net income: • $626M benefit from the re-measurement of our net deferred tax liability using the lower corporate tax rate • $43M one-time deemed repatriation tax expense on foreign earnings • $14M tax expense from other provisions 2017 estimated RBC ratio: • Immaterial impact on the year-end 2017 estimated RBC ratio 1 The operating earnings effective tax rate is a non-GAAP measure and differs from the U.S. GAAP net income effective tax rate primarily due to net realized capital gains and losses (NRCG).
  • 7. $401 $413 4Q16 reported 4Q17 reported Highlights • Growth in pre-tax operating earnings was driven by higher net revenue on increased account values partially offset by lower net investment income and higher operating expenses • Fundamentals remain strong; $11.8B in sales for 2017,up 9% from prior year, full year recurring deposits grew 6%, and defined contribution contract count increased by nearly 800 over prior year • On a trailing twelve month basis1 net revenue growth and pre-tax return on net revenue were at the top end or above the 2017 guidance ranges 7 1Excludes 3Q16 and 3Q17 actuarial assumption reviews. All financial information rounded to the nearest million. Change and growth rates calculated using data from financial supplement. Retirement and Income Solutions – Fee (RIS – Fee) Net revenue ($M) Quarterly basis increase in net revenue pre-tax return on net revenue Trailing twelve month basis1 5% 35% Posted on PFG website: 1/29/2018 +3% Reported pre-tax operating earnings ($M) 4Q17 $127 4Q16 $124 Change +$3 (+2%)
  • 8. $133 $124 4Q16 reported 4Q17 reported Retirement and Income Solutions - Spread (RIS – Spread) 8 1Excludes higher variable investment income in 4Q16. 2Excludes 3Q16 and 3Q17 actuarial assumption reviews. All financial information rounded to the nearest million. Change and growth rates calculated using data from financial supplement. Highlights • Pre-tax operating earnings excluding significant variances1 were flat as unfavorable mortality and higher operating expenses impacted the current quarter • Record full-year pension risk transfer sales of nearly $3B; pipeline remains strong • On a trailing twelve month basis2 net revenue growth and pre-tax return on net revenue were at the top end or above the 2017 guidance ranges Net revenue ($M) Quarterly basis Reported pre-tax operating earnings ($M) Significant variances1 ($M) Pre-tax operating earnings ex significant variances ($M) 4Q17 $75 $75 4Q16 $88 -$12 $75 Change -$12 (-14%) $0 (0%) increase in net revenue pre-tax return on net revenue Trailing twelve month basis2 10% 65% Posted on PFG website: 1/29/2018 -7%
  • 9. $339 $335 4Q16 reported 4Q17 reported Principal Global Investors 9 1This is a non-GAAP financial measure; see reconciliation in appendix. All financial information rounded to the nearest million. Change and growth rates calculated using data from financial supplement. Highlights • Pre-tax operating earnings declined as management fee growth of 10% was more than offset by lower performance fees • Record AUM of $431B increased 10% compared to the year ago quarter, including PGI sourced AUM of $219B • On a trailing twelve month basis operating revenues less pass- through commissions1 growth and pre-tax return on operating revenues less pass-through commissions were within the 2017 guidance ranges Operating revenues less pass-through commissions ($M) Quarterly basis Reported pre-tax operating earnings ($M) 4Q17 $124 4Q16 $134 Change -$10 (-7%) increase in operating revenues less pass-through commissions pre-tax return on operating revenues less pass-through commissions Trailing twelve month basis 5% 37% Posted on PFG website: 1/29/2018 -1%
  • 10. $198 $238 4Q16 reported 4Q17 reported Highlights • Pre-tax operating earnings excluding significant variances1 improved 9% over the prior year quarter due to growth in the business • Record reported AUM of $161B increased 17% over 4Q16, including record AUM in Chile, Hong Kong and Southeast Asia • $2.5B of net cash flows in the quarter, marking the 37th consecutive quarter of positive net cash flows • On a trailing twelve month combined2 basis3 (at PFG share) net revenue4 growth and pre-tax return on net revenue were within the 2017 guidance ranges Principal International 1Excludes the impact of actual vs. expected encaje returns. 2Combined basis includes all Principal International companies at 100%. 3Excludes 3Q16 and 3Q17 actuarial assumption reviews, the impact of actual vs. expected encaje returns and 2Q17 elevated expenses in Mexico. 4This is a non-GAAP financial measure; see reconciliation in appendix. All financial information rounded to the nearest million. Change and growth rates calculated using data from financial supplement. 10 Combined net revenue (at PFG share) ($M) Quarterly basis 3% 35% 13% 38% increase in net revenue pre-tax return on net revenue Trailing twelve month combined basis3 (at PFG share)Reported pre-tax operating earnings ($M) Significant variances1 ($M) Pre-tax operating earnings ex significant variances ($M) 4Q17 $78 +$6 $84 4Q16 $66 +$11 $77 Change +$12 (+19%) +$7 (+9%) Posted on PFG website: 1/29/2018 +20%
  • 11. $479 $521 4Q16 reported 4Q17 reported 1Excludes higher variable investment income in 4Q16. 2Excludes 3Q16 and 3Q17 actuarial assumption reviews. All financial information rounded to the nearest million. Change and growth rates calculated using data from financial supplement. Specialty Benefits Highlights • Pre-tax operating earnings excluding significant variances1 decreased over the prior year quarter due to growth in the business being more than offset by higher operating expenses • Premium and fees are up 9% over the prior year period reflecting strong retention and employment growth • On a trailing twelve month basis2 premium and fees growth, pre-tax return on premium and fees, and loss ratio were within the 2017 guidance ranges 11 Quarterly basis increase in premium and fees pre-tax return on premium and fees incurred loss ratio Trailing twelve month basis2 9% 12% Premium and fees ($M) 64% Reported pre-tax operating earnings ($M) Significant variances1 ($M) Pre-tax operating earnings ex significant variances ($M) 4Q17 $63 $63 4Q16 $72 -$5 $67 Change -$9 (-13%) -$5 (-7%) Posted on PFG website: 1/29/2018 +9%
  • 12. $249 $268 4Q16 reported 4Q17 reported 1Excludes 3Q16 and 3Q17 actuarial assumption reviews. All financial information rounded to the nearest million. Change and growth rates calculated using data from financial supplement. Individual Life Highlights • Pre-tax operating earnings increased primarily due to favorable mortality in 4Q17 versus unfavorable mortality in 4Q16 • 8% increase in premium and fees driven by growth in the business • On a trailing twelve month basis1 premium and fees growth and pre- tax return on premium and fees were within the 2017 guidance ranges 12 Quarterly basis increase in premium and fees pre-tax return on premium and fees Trailing twelve month basis1 6% 16% Premium and fees ($M) Posted on PFG website: 1/29/2018 +8% Reported pre-tax operating earnings ($M) 4Q17 $48 4Q16 $35 Change +$13 (+38%)
  • 13. Expect to deploy $900M to $1.3B of capital in 2018 8th consecutive increase in quarterly dividend Announced 1Q18 common stock dividend of $0.51 per share, or $1.93 for TTM; a 15% increase compared to 1Q17 TTM 13 Capital deployment $913M total capital deployed in 2017 Common stock dividends paid • $141M- 4Q17 ($0.49 per share) • $136M- 3Q17 ($0.47 per share) • $133M- 2Q17 ($0.46 per share) • $130M- 1Q17 ($0.45 per share) Share repurchases • $49M - 3Q17 • $26M - 2Q17 • $118M- 1Q17 $193M $540M $180M Committed M&A and increased ownership in PGI boutiques • $167M- 4Q171 • $6M - 3Q17 • $7M - 2Q17 Posted on PFG website: 1/29/2018 1Committed M&A includes the planned MetLife Afore and Internos acquisitions.
  • 14. 14 (in millions) Three Months Ended Principal Global Investors Operating Revenues Less Pass-Through Commissions 12/31/17 12/31/16 Principal Global Investors operating revenues $375.5 $380.1 Principal Global Investors commission expense (40.2) (41.0) Principal Global Investors operating revenues less pass-through commissions $335.3 $339.1 Appendix Non-GAAP financial measure reconciliations (in millions) Three Months Ended Principal International Combined Net Revenue (at PFG Share) 12/31/17 12/31/16 Principal International pre-tax operating earnings $78.3 $66.0 Principal International combined operating expenses (at PFG share) 159.8 131.8 Principal International combined net revenue (at PFG share) $238.1 $197.8 (in millions) Three Months Ended Non-GAAP Operating Earnings (Losses) 12/31/17 12/31/16 Net income attributable to PFG $841.8 $318.0 Net realized capital (gains) losses, as adjusted 33.5 2.0 Other after-tax adjustments (524.5) 52.0 Non-GAAP operating earnings $350.8 $372.0 Per diluted share Three Months Ended Diluted Earnings Per Common Share 12/31/17 12/31/16 Net income $2.87 $1.09 Net realized capital (gains) losses, as adjusted 0.11 0.01 Other after-tax adjustments (1.79) 0.17 Non-GAAP operating earnings $1.19 $1.27 Weighted-average diluted common shares outstanding (in millions) 293.5 292.0 Posted on PFG website: 1/29/2018 Definitions Variable investment income includes certain types of investment returns such as prepayment fees and income (loss) from certain elements of our alternative asset classes, including results of value-add real estate sales activity.