This document provides an introduction to the concept of green infrastructure as explored in the PAS Report. It defines green infrastructure as both a multifunctional open space network at the regional scale and as a stormwater management approach that mimics natural processes at local and site scales. The report examines green infrastructure through the unifying concept of landscape, viewing natural and built systems as interconnected networks that must be considered together to sustain communities. It represents a shift from past views that separated gray infrastructure from green natural systems.


![Chapter 3. Green Infrastructure in Practice 23
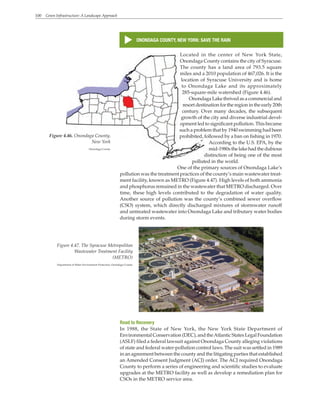
Regional Scale
At the scale of the metropolitan region, planning for green infrastructure can
make connections (e.g., regional greenway and trail systems) and address
natural landscape features (e.g., watersheds and ecological zones) across
jurisdictional boundaries. Planners and policy makers can promote green
infrastructure at the regional level by:
• Integrating green infrastructure with regional patterns of growth and
conservation
• Directing investments in regional systems such as transportation, storm-
water drainage, and open space toward green infrastructure
• Facilitating partnerships among public agencies, nonprofit land conserva-
tion organizations, institutions, businesses, and developers who stand to
benefit from green infrastructure solutions
• Leveraging resources for implementation (e.g., by tapping public and
private funding streams for green infrastructure projects and programs)
In the United States, regions are typically defined to include a core city
(or cities) and surrounding suburban and rural communities, with in some
cases a metropolitan planning organization (MPO) or council of govern-
ments serving as a regional planning agency. Formal regional governance
models are generally limited to combined city-county governments (e.g.,
Indianapolis and Marion County, Louisville Metro) and special legislative
entities established to manage land use and protect high-quality resources
within designated areas (e.g., the Lake Tahoe Regional PlanningAgency and
New Jersey Pinelands Commission). While MPOs focus on transportation
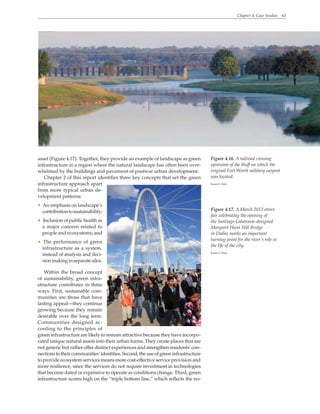
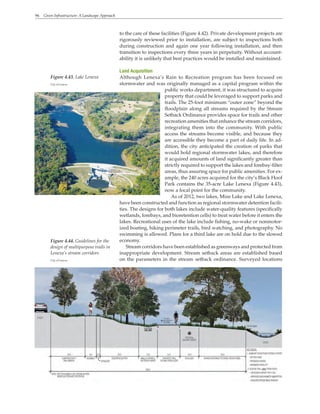
GREEN INFRASTRUCTURE AND THE TRANSECT
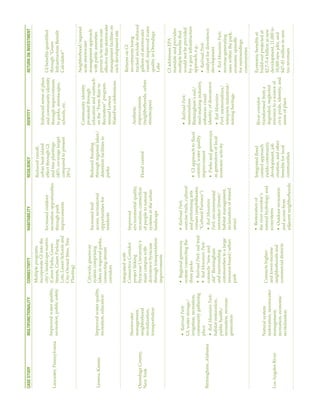
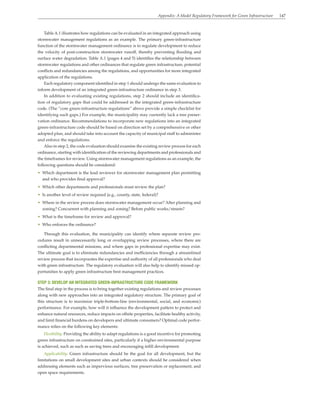
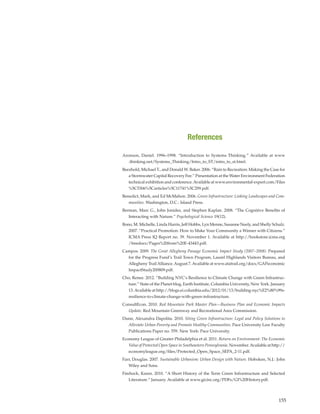
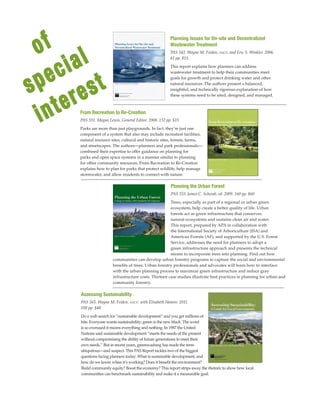
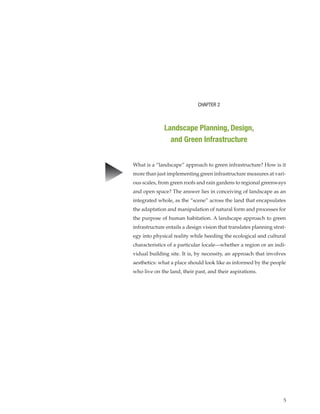
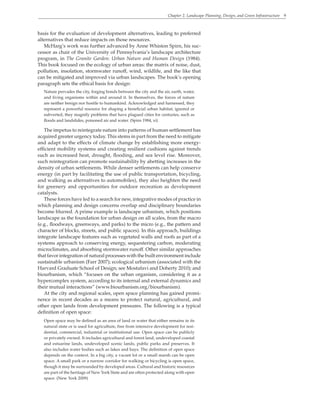
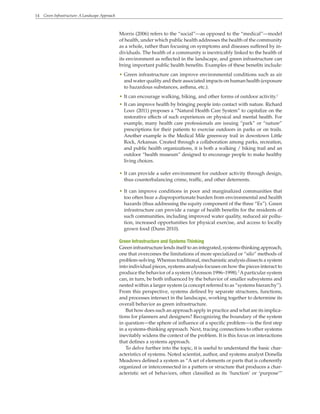
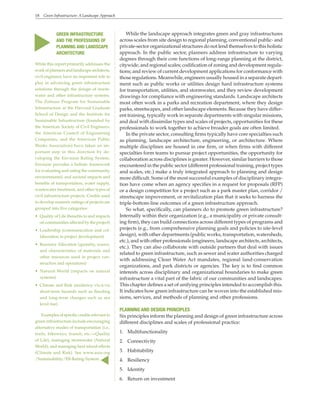
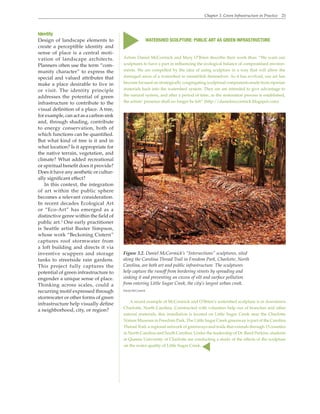
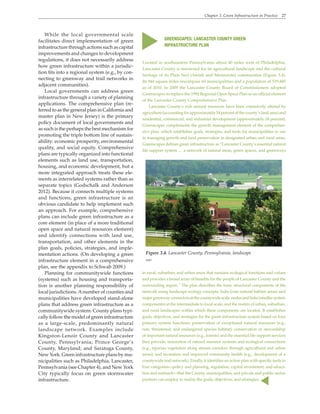
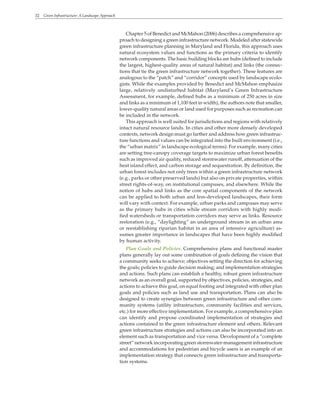
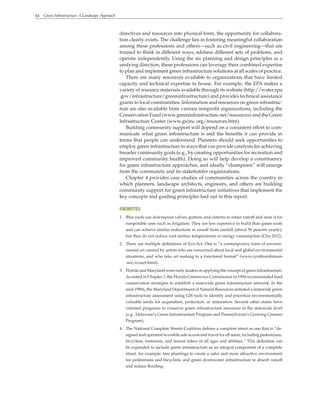
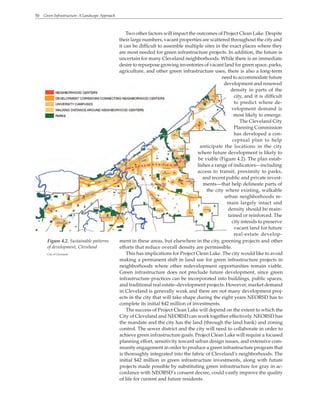
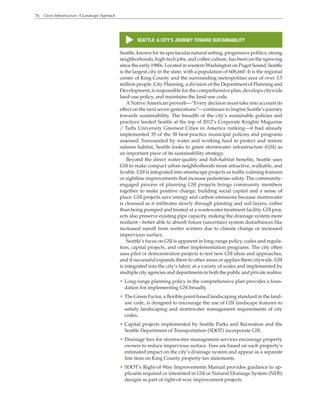
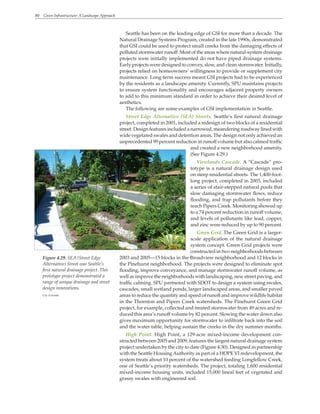
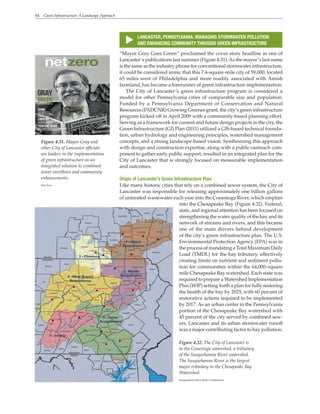
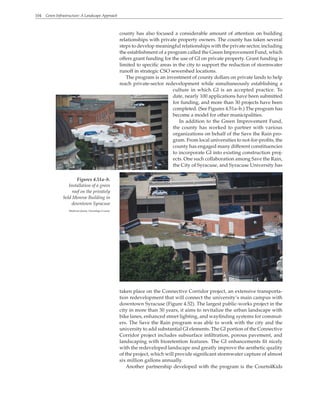
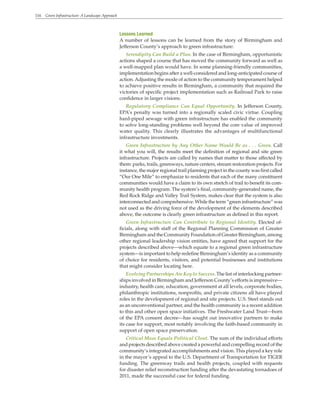
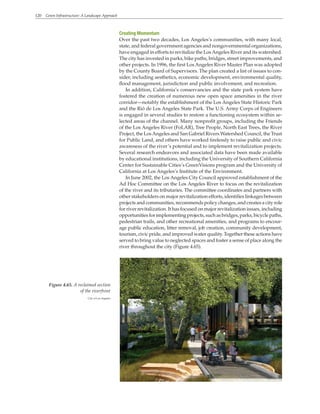
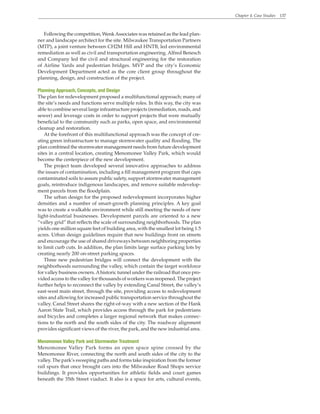
Under the landscape approach, green infrastructure assumes different typologies and physical characteristics in urban, suburban, and
rural contexts and the transitions among them. This continuum is analogous to the rural-to-urban transect planning model promulgated
by planning firm Duany Plater-Zyberk and Company (DPZ). The Transect consists of six zones of increasing density with associated
design standards: Rural Preserve, Rural Reserve, Sub-Urban, General Urban, Urban Center, and Urban Core (downtown or central
business district) (www.dpz.com/transect.aspx). Using this analogy, green infrastructure in rural contexts corresponds to either the
Rural Preserve (as wilderness) or to the Rural Reserve (as “working lands with conservation value” [Benedict and McMahon 2006]). In
more-developed suburban contexts, green infrastructure takes on forms such as nature preserves surrounded by development, parks
with active recreational facilities, and private gardens. Green infrastructure merges with the built environment in dense urban contexts
(Urban Center and Urban Core), where it is expressed in streetscapes, urban parks and public gathering spaces, green stormwater
infrastructure, and so on.
▲
▲
Figure 3.3. The Transect
Duany Plater-Zyberk and Company](https://image.slidesharecdn.com/46-230308195754-dbbf0447/85/46-GREEN-INFRAESTRUCTURE-david-rouse-2015-pdf-27-320.jpg)
![Chapter 3. Green Infrastructure in Practice 29
green infrastructure investments.5
In the current economic climate, where
priorities compete for scarce fiscal resources, the multifunctionality and
return-on-investment principles in particular can be used to justify and build
support for community green infrastructure initiatives.
One place where many municipalities can begin is with stormwater infra-
structure. For municipalities, institutions, and developers, federal, state, and
local regulatory requirements increasingly position green stormwater infra-
structure as a viable and preferable alternative to conventional engineering
solutions. The Federal Water Pollution ControlAmendments of 1972 and 1977
(the Clean Water Act) established a basic structure for regulating pollutant
discharges by “point” sources (e.g., pipes and drains) under the National
Pollutant Discharge Elimination System (NPDES). The Water Quality Act
of 1987 expanded the NPDES permit requirements to apply to “nonpoint”
(dispersed) sources. The requirements were issued in two parts. Phase 1
(1990) requires municipalities of 100,000 or more, industrial dischargers,
and construction sites of at least five acres to obtain NPDES permits. Phase 2
(1999) extends the requirements to municipalities with populations between
50,000 and 100,000 and a density of at least 1,000 persons per square mile,
construction sites of one or more acres, and large property owners such as
hospitals, universities, and school districts.
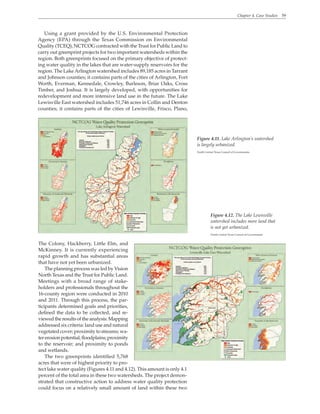
The Environmental Protection Agency (EPA), which is responsible for
Clean Water Act administration and enforcement, “strongly encourages”
the use of green infrastructure to fulfill NPDES permit requirements and to
address water-quality violations caused by combined sanitary and sewer
overflows (CSO; see the Cleveland and Philadelphia case studies in Chapter
4). The EPA has released a series of policy memos and fact sheets on incor-
porating green infrastructure into NPDES and CSO programs, and in July
2012 it announced the selection of 17 communities in 16 states to receive a
total of $950,000 in technical assistance for projects including code review,
green infrastructure design, and cost-benefit assessments (http://water.epa
.gov/infrastructure/greeninfrastructure/gi-support.cfm).
At the state and local levels, many jurisdictions have promulgated storm-
water regulations that encourage green infrastructure approaches, along
with code requirements protecting natural green infrastructure components
such as wetlands, floodplains, stream buffers, and mature trees. Maryland’s
Stormwater Management Act of 2007, for example, “requires that environ-
mental site design (ESD), through the use of nonstructural best management
practices and other better site design techniques, be implemented to the maxi-
mum extent practicable.” ESD is defined as “using small-scale stormwater
management practices, nonstructural techniques, and better site planning to
mimic natural hydrologic runoff characteristics and minimize the impacts
of land impact on water resources” (an approach commonly referred to as
“low-impact development”).
Abroader approach is also possible, such as in Atlanta, which has enacted
a suite of environmental regulations. Befitting a city that places a high value
on its urban forest as central to its identify and sense of place, Atlanta’s tree
ordinance is one of the strictest of any major American city. Administered
by the Arborist Division of the Department of Planning and Community
Development, the ordinance’s stated purpose is to achieve “no net loss” of
trees. Private property owners are required to obtain permits to remove trees
above a minimum size (six-foot diameter at breast height [dbh] for hardwoods
and12-inchdbhforpines).OtherenvironmentalregulationsinAtlantainclude:
• APostdevelopment Stormwater Management Ordinance that encourages the
use of nonstructural stormwater management and site design practices,
including “the preservation of greenspace and other conservation areas
to the maximum extent practicable.”](https://image.slidesharecdn.com/46-230308195754-dbbf0447/85/46-GREEN-INFRAESTRUCTURE-david-rouse-2015-pdf-33-320.jpg)

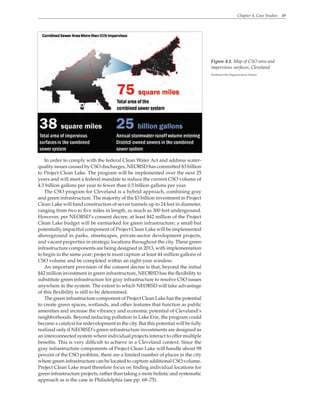
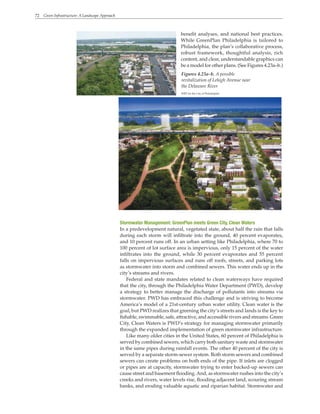
![Chapter 4. Case Studies 51
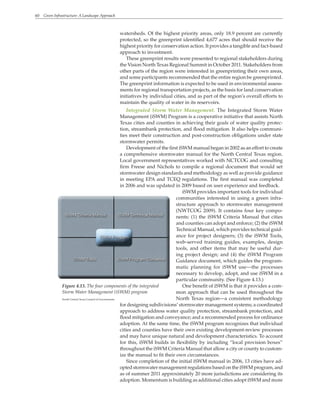
Regional Stormwater Management Program. In addition to Project Clean
Lake, NEORSD has established a new Regional Stormwater Management
Program to address some of the regional problems that occur when large
volumes of rain, melted snow, and ice flow from one community to another.
The program is designed to reduce flooding of homes and streets, erosion
of roads, bridges, and stream banks, and the flow of surface pollution into
Lake Erie and local creeks and streams. Property owners in NEORSD’s
service area will be assessed a fee based on the area of impervious surfaces
(roofs, pavement, driveways, etc.) found on their properties. Average home
owners will pay about $60 per year, but can reduce this amount by adopting
green infrastructure practices such as rain gardens, rain barrels, green roofs,
and other techniques. The fees for commercial, institutional, and industrial
properties will be significantly higher, based on their amount of impervi-
ous surface, since these uses tend to have parking lots and larger expanses
of roof area.
The Regional Stormwater Management Program has proven to be con-
troversial, however, and has been under appeal. NEORSD has prevailed
throughout the litigation and intends to begin billing for the program in
January 2013. The program will provide an estimated $35 million per year for
regional stormwater-management investments including stream restoration,
culvert repairs, technical guidance to communities, and public education.
The Regional Stormwater Management Program has the potential to
support green infrastructure investments for water quality improvements
throughout the region. It offers greater flexibility than Project Clean Lake
because it was created in response to local conditions and concerns rather
than as a result of a federal mandate to mitigate CSOs. Local officials and
community residents will have a greater say in determining how green
infrastructure practices will be deployed in their neighborhoods, as 25
percent of the revenues derived from the program will be available to mu-
nicipalities and townships for community-specific projects. The remainder
of the funds will be used by NEORSD to address regional issues affecting
multiple communities.
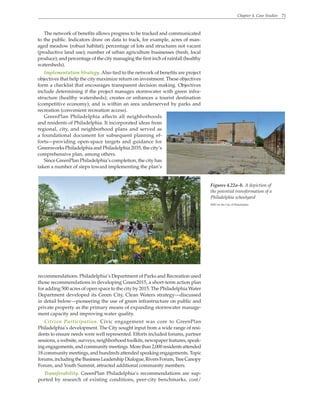
Re-imagining a [Greater] Cleveland
Re-imagining a [Greater] Cleveland is a strategy for the management and reuse
of vacant properties in Cleveland and Cuyahoga County. It has become a
nationally recognized model for the ecological, economic, and social regen-
eration of older industrial cities. Its primary partners include the City of
Cleveland, LAND Studio, Neighborhood Progress, Inc., and the Kent State
University Cleveland Urban Design Collaborative. The Re-imagining effort
aims to transform the growing liability of vacant land into a regional asset
by stabilizing an increasingly dysfunctional regional real-estate market;
creating new opportunities for economic development; restoring damaged
urban ecosystems; and improving the health and well-being of residents in
the City of Cleveland and throughout Cuyahoga County.
The Re-imagining initiative identifies a series of principles to promote the
strategic reuse of vacant urban land and defines three broad categories of
vacant land reuse: (1) stabilization and holding strategies for areas of the
city where new development is anticipated; (2) green space expansion and
green infrastructure to improve ecological systems, increase access to parks
and amenities, and improve public health; and (3) productive strategies
(including urban agriculture and the generation of alternative energy) as a
means to extract an economic benefit from vacant land.
To test these principles, in 2010 and 2011 the City of Cleveland and
Neighborhood Progress, Inc. (NPI), funded 56 vacant-land pilot projects
across the city, chosen through a competitive, neighborhood-based review](https://image.slidesharecdn.com/46-230308195754-dbbf0447/85/46-GREEN-INFRAESTRUCTURE-david-rouse-2015-pdf-55-320.jpg)
![Chapter 4. Case Studies 53
Northeast Ohio Ecological Consortium / Urban Long Term Research Area
Exploratory Program
The Northeast Ohio Ecological Consortium (NEO ECO) was created through
funding from the National Science Foundation as part of the Urban Long
Term ResearchArea Exploratory (ULTRAEx) program. NEO ECO is a group
of scientists, researchers, and planners building research capacity in order
to better understand the potential of vacant urban land to provide a range
of ecosystem services. The work of NEO ECO also examines the effective-
ness and social acceptance of green infrastructure in an urban context, in
conjunction with Project Clean Lake and Re-imagining a [Greater] Cleveland.
The scientific research supported through NEO ECO examines the reemer-
gence of biophysical controls in natural processes and ways to harness them
for the benefit of people in cities. The organizing idea is that the restoration
of healthy urban ecosystems will support stable and resilient urban com-
munities. NEO ECO research includes vacant land stabilization practices,
vacant site restoration and landscape succession in Cleveland’s Slavic Village
neighborhood, assessment of the quality and quantity of ecosystem services
in support of urban agriculture on vacant lots, and development of a Vacant
Land Rapid Assessment Procedure.
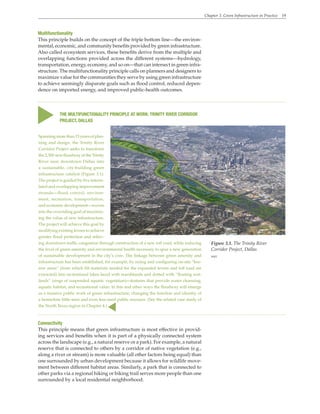
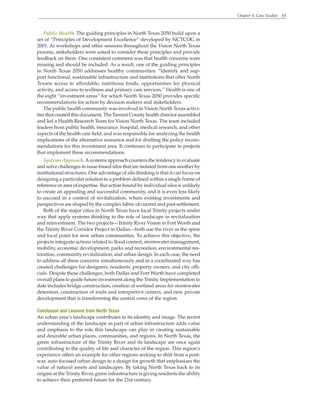
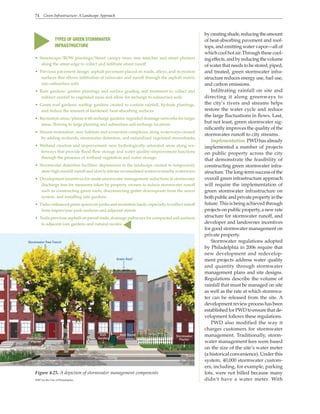
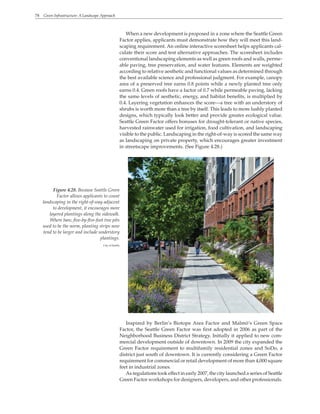
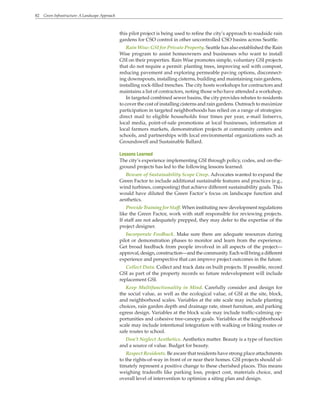
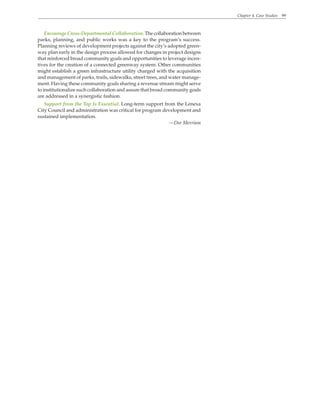
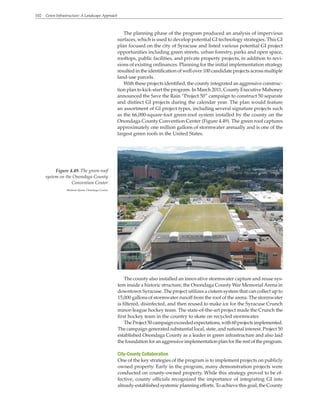
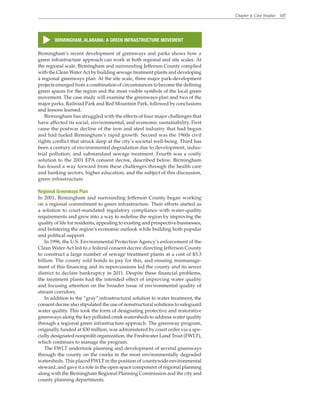
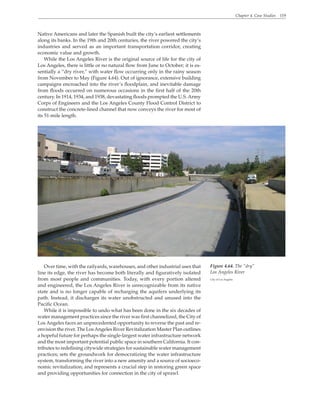
Of these research efforts, the Vacant Land Rapid Assessment Procedure
(VL-RAP) has the most direct implications for green infrastructure policies.
The VL-RAP offers a way to screen and evaluate vacant sites using basic
ecological and ecosystem principles to determine their potentials for green
infrastructure uses such as wildlife habitat, stormwater management, parks,
and gardens. This provides a counterpoint to more typical site-assessment
procedures that evaluate the potential of a site primarily from the perspec-
tive of traditional real-estate development.
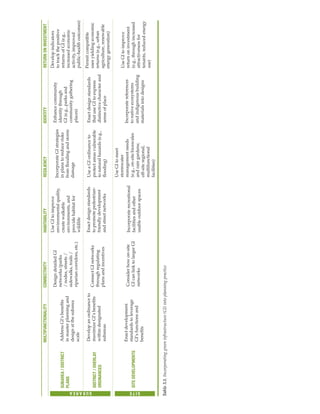
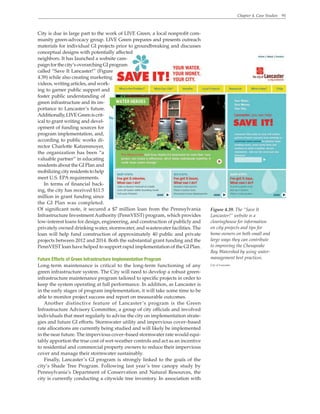
The VL-RAP is a user-friendly questionnaire that evaluates five metrics:
(1) existing and realistic potential size of the site, (2) landscape position and
connectivity to existing habitats, (3) soil as a dominant factor in the potential
for the reuse of urban vacant land, (4) existing economic redevelopment po-
tential, and (5) current and potential ecological condition of the vacant land
if passive uses are implemented. Upon completion, the VL-RAP provides a
single score designed to help users make relative comparisons and decide
whether a lot should be considered for green infrastructure uses rather than
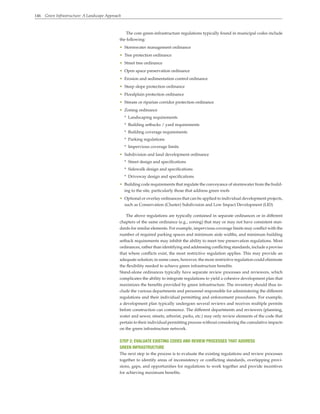
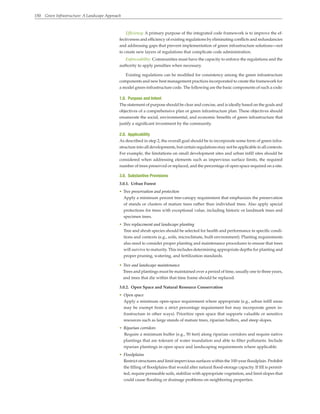
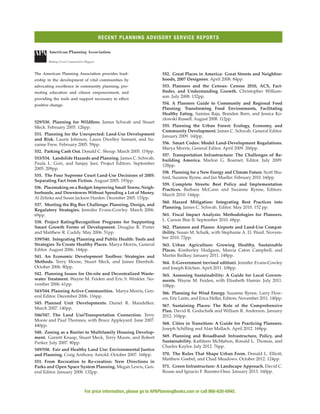
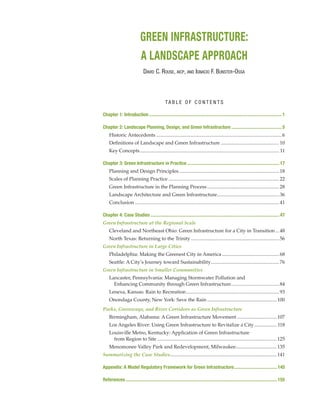
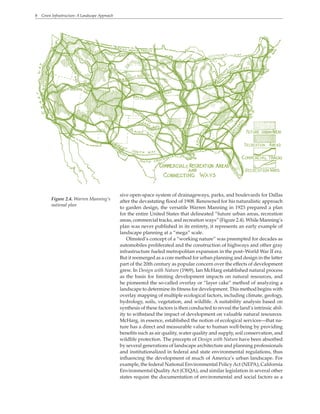
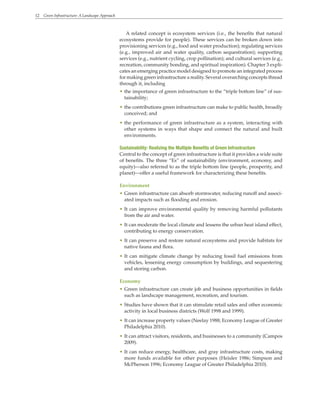
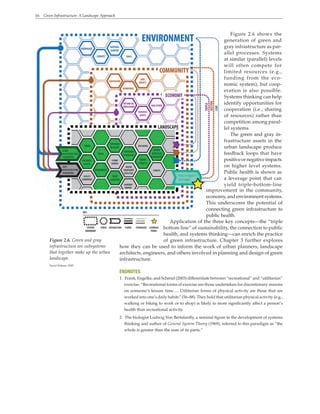
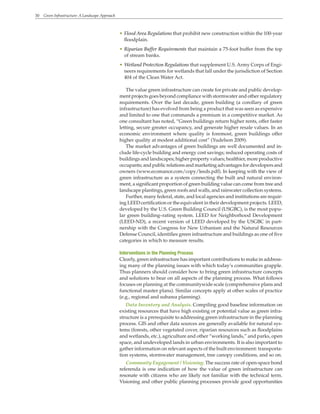
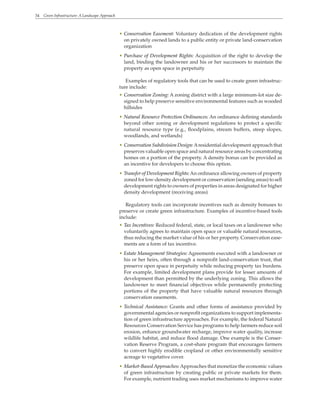
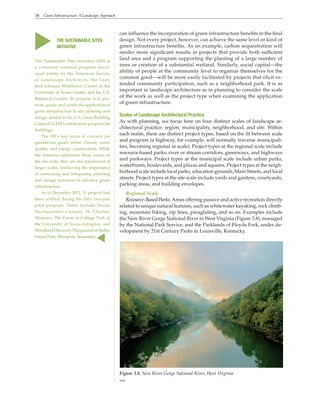
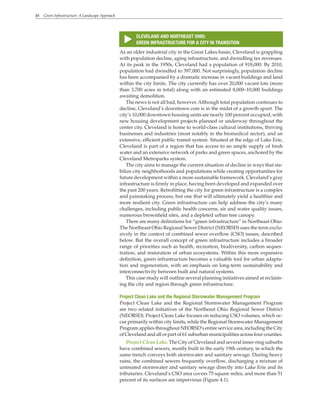
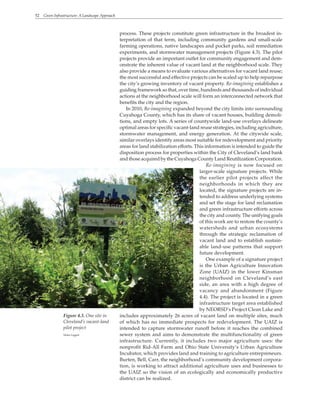
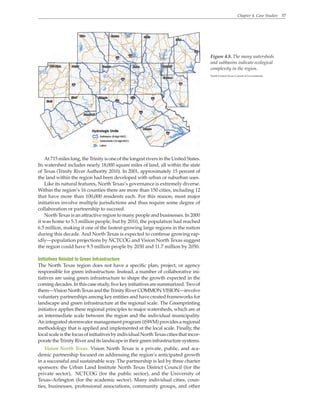
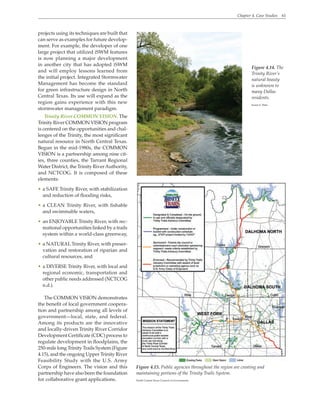
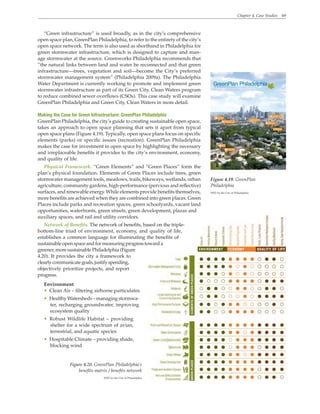
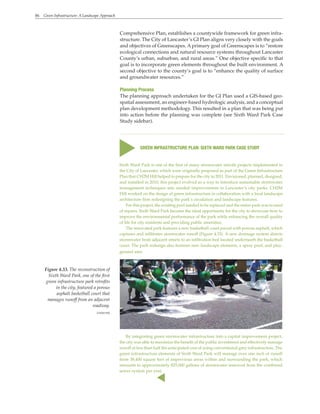
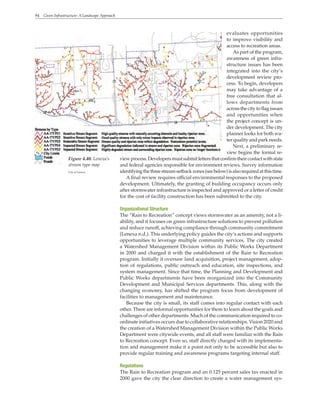
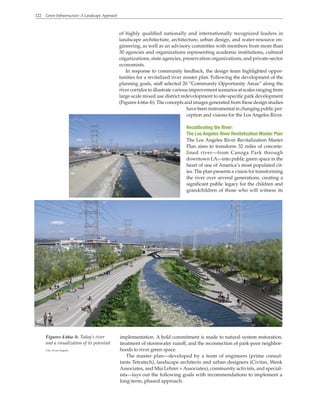
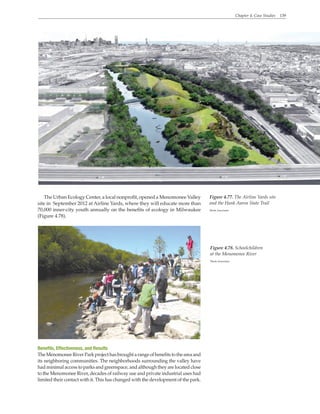
Figure 4.4. Urban Agriculture
Innovation Zone, preliminary
concept plan
Northeast Ohio Regional Sewer District](https://image.slidesharecdn.com/46-230308195754-dbbf0447/85/46-GREEN-INFRAESTRUCTURE-david-rouse-2015-pdf-57-320.jpg)

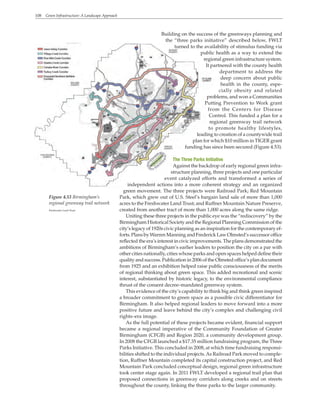
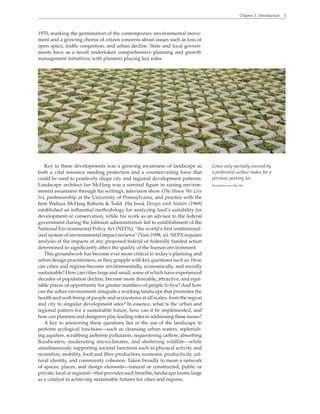
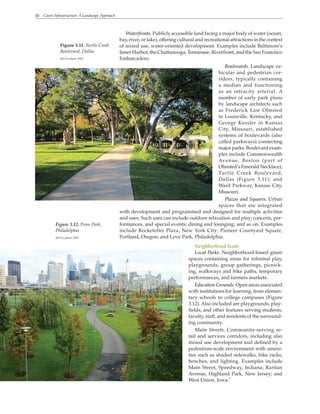
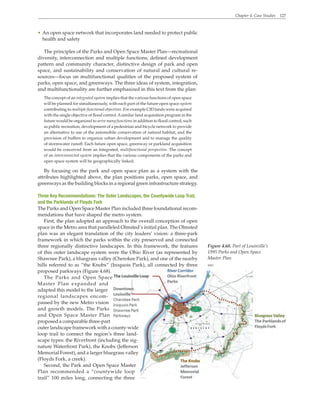
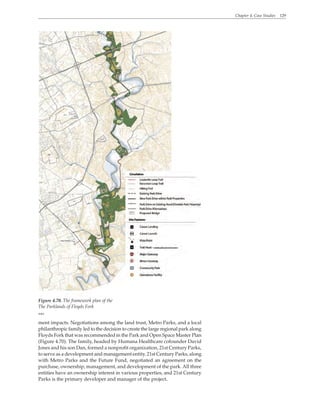
![126 Green Infrastructure: A Landscape Approach
for nearby residents. Responding to postwar growth directed toward the sub-
urbs, other large parks were developed in the surrounding Jefferson County
area by the county and state.
As the park system increased focus on delivery of recreation services and
parks outside of the city’s historic core, concern for historic preservation led to
increased care for Olmsted’s legacy. Moreover, the environmental movement
of the 1970s focused attention on water quality and resource protection along
waterways. This interest in the environmental quality of open space, coupled
with the rails-to-trails movement and federal funding for trails as transpor-
tation enhancements, evolved into the greenway movement that informed
plans for the Ohio River and stream corridors in the region. In recognition
of the value of cultural landscapes, Metro Parks prepared a master plan for
the Olmsted parks in 1994. Together the actions resulting from these various
park and open space movements led to the beginnings of a connected regional
green infrastructure system.
In 1993, Louisville and Jefferson County began the process of merging
into a single metropolitan government. This triggered the need to develop
a comprehensive plan to guide the integration of planning efforts. As with
the 1897 parks plan, it was a chance to reflect on how best to provide green
space in the coming century for a community in the process of change.
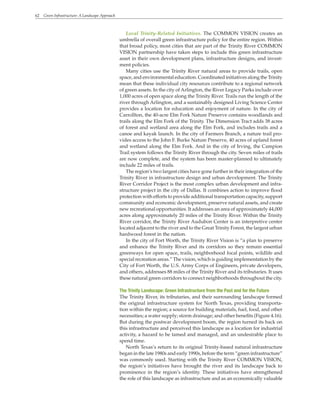
Cornerstone 2020: Contemporary Regional Green Infrastructure Planning
The Cornerstone 2020 comprehensive plan, adopted in 2000, integrated the
ingredients of green infrastructure in its Livability Strategy and the elements
of Community Form and Livability and the Environment. Two master plans
grew out of the Cornerstone 2020 process: the Parks and Open Space Master
Plan (July 1995) and the Multi-objective Greenway and Stream Corridor
Plan. These plans provided the opportunity to consolidate the Olmsted
parks legacy with the various park and open space developments that had
evolved since. The Parks and Open Space Master Plan critically assessed
the state of Metro’s collected parks and open spaces:
The concept of an open space system is not one which has guided the development of Jefferson
County [author’s emphasis]. Olmsted laid out a system consisting of three major
parks and connecting parkways which helped define the recreational and aesthetic
qualities of part of the City of Louisville. However, the parks and linking parkway
approach was not extended out into Jefferson County. Parkland acquisition in the
County during the 1960’s was guided by the “Chain of Rainbow Parks” concept…
but the chain concept reflected the idea of a ring of parks in the urbanizing fringe
rather than one of physical linkage by parkways, greenways or other open space. The
County has accomplished important parkland acquisitions, including the Jefferson
County Memorial Forest, but the only major open space program implemented in
the County was the acquisition by the Community Improvement District (CID).
(Wallace Roberts & Todd 1995)
This set the stage for the new park and open space plan to take a broad
systemwide approach with the vision and ambition of the Olmsted plan. The
goals of the resulting plan, listed below, reflect the systems-based thinking
of the landscape approach to green infrastructure described in Chapter 3
of this report:
• Asystem of well-maintained parks and recreation facilities that meets the
needs of the residents of Louisville and Jefferson County
• Anetwork of open spaces and greenway corridors that protects significant
natural resources
• Aparks and open space system that preserves and enhances visual quality,
protects historic and archaeological resources, and provides opportunities
for education](https://image.slidesharecdn.com/46-230308195754-dbbf0447/85/46-GREEN-INFRAESTRUCTURE-david-rouse-2015-pdf-130-320.jpg)
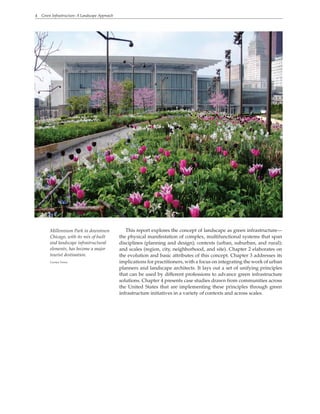
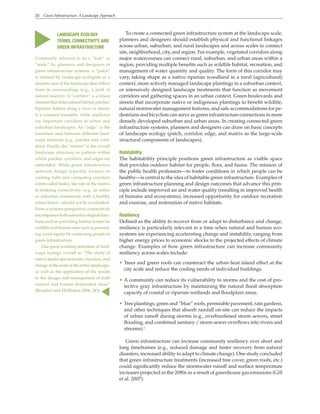
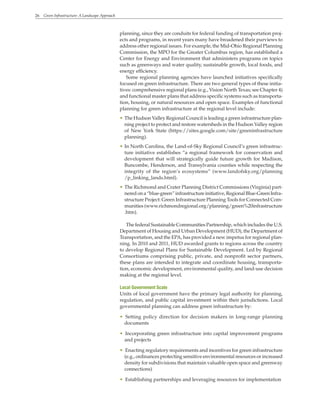
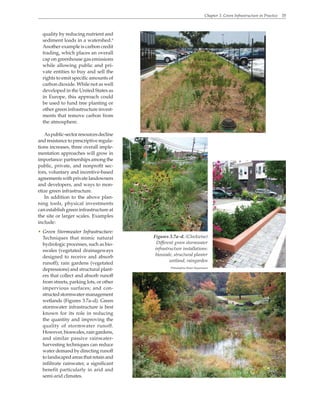
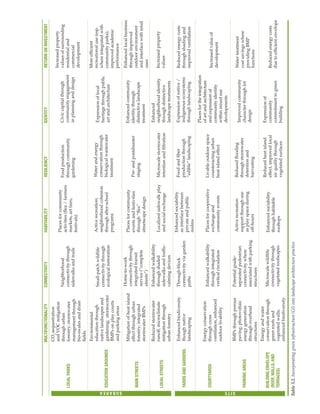
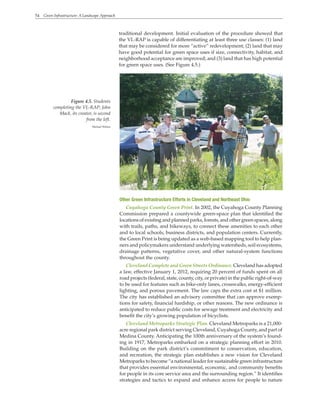
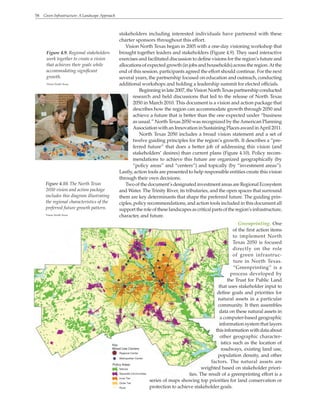
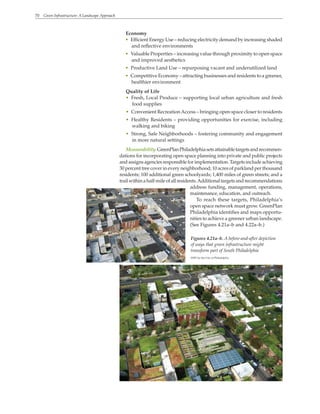
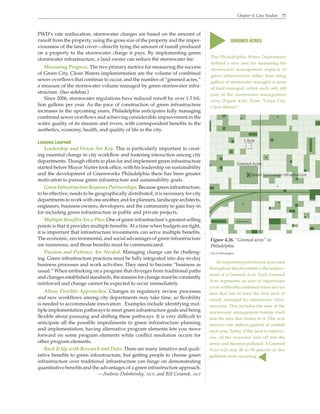
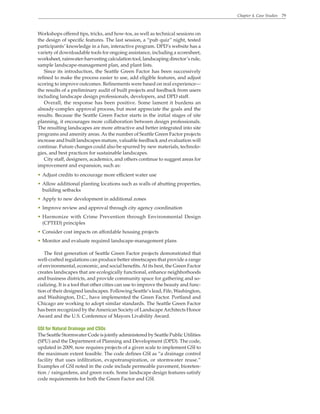
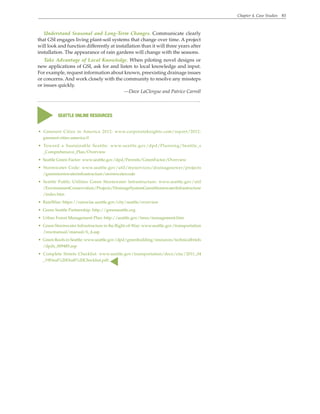
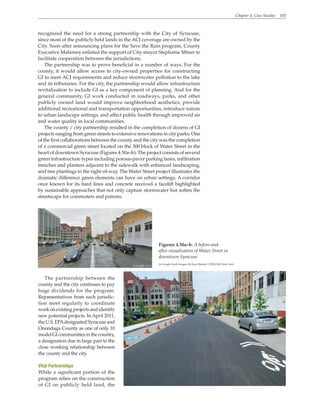
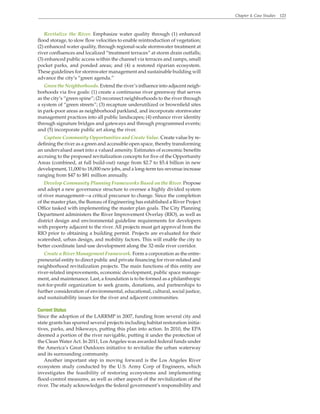
![CASE
STUDY
MULTIFUNCTIONALITY
CONNECTIVITY
HABITABILITY
RESILIENCY
IDENTITY
RETURN
ON
INVESTMENT
Cleveland
and
Northeast
Ohio
Multiple
functions
come
together
in
landscape-scale
GI
–
environmental
improvement
(water
quality,
habitat,
etc.),
recreation,
transportation,
etc.
•
Cuyahoga
County
Green
Print,
Cleveland
Metroparks
Strategic
Plan:
regional/county
GI
system
•
Re-imagining
a
[Greater]
Cleveland,
Cleveland
Complete
and
Green
Streets
Ordinance:
integrate
GI
into
Cleveland’s
urban
fabric
Improved
environmental
quality,
outdoor
recreation,
and
restoration
of
native
habitats
through
GI
Re-imagining
a
[Greater]
Cleveland:
urban
agriculture
Re-imagining
a
[Greater]
Cleveland:
vacant
land
pilot
projects
provide
a
catalyst
for
building
neighborhood-level
capacity
and
identity
•
Re-imagining
a
[Greater]
Cleveland:
economic
development/
real
estate
market
stabilization
•
Cleveland
Metroparks
Strategic
Plan:
identifies
economic
benefits
provided
by
GI
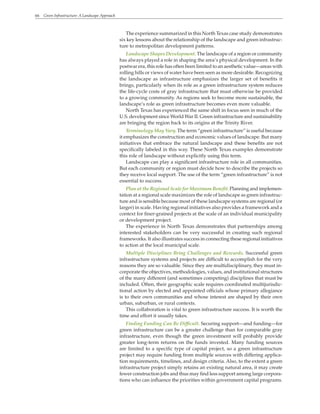
North
Texas
Environmental
restoration,
recreation,
mobility,
community
revitalization,
etc.
Trinity
River
corridor
as
the
“spine”
of
a
regional
GI
system
Trinity
River
COMMON
VISION
and
related
initiatives:
natural
habitat
restoration,
environmental
restoration,
outdoor
recreation
opportunities
•
Flood
control
•
Cost
effectiveness
of
GI
compared
to
technologies
that
become
outdated
and
expensive
to
operate
and
maintain
over
time
Trinity
River
COMMON
VISION
and
related
initiatives:
create
a
new
source
of
community
identity
through
an
environmental
and
recreational
resource
connected
to
adjacent
development
Trinity
River
Corridor
in
Dallas
as
a
catalyst
for
up
to
$8
billion
in
redevelopment
of
mostly
older
industrial/
warehouse
uses
(more
than
10x
return
on
investment
in
GI
improvements)
Philadelphia
GreenPlan
Philadelphia,
Green
City,
Clean
Waters:
define
benefits
based
on
the
triple
bottom
line,
e.g.:
clean
air
and
water,
climate
amelioration
(environment);
increased
property
values,
job
creation
(economy);
and
improved
public
health,
recreation
(community).
GI
incorporated
into
the
city’s
landscape
matrix
through
multiple
interventions
•
GreenPlan
Philadelphia:
tree
planting,
green
schoolyards,
parks
and
recreation
spaces,
etc.
•
Green
City,
Clean
Waters:
green
streets,
rain
gardens,
stormwater
wetlands,
etc.
Environmental
quality
(air
and
water),
recreation,
and
public
health
improvement
Reduced
energy
consumption,
locally
based
jobs
Contributions
to
community
and
sense
of
place
at
the
neighborhood
scale
Green
City,
Clean
Waters:
projects
$2.2
billion
return
on
investment
from
$1.01
billion
spent
on
GI
over
a
40-year
period
Seattle
•
Multifunctional
open
spaces
integrate
stormwater
management
with
recreational
use
•
Streets
integrate
stormwater
management
with
traffic
calming/
improved
public
safety
and
an
enhanced
pedestrian
realm
GI
incorporated
into
the
city’s
landscape
matrix
through
multiple
interventions
(landscape
treatments
per
the
Green
Factor,
“Green
Grid”,
green
streets,
rain
gardens,
etc.)
Improved
environmental
quality,
more
attractive
neighborhoods
and
business
districts
Flood
control
•
GI’s
contributions
to
attractive,
walkable
neighborhoods
and
business
districts
•
Improved
aesthetics
as
an
important
GI
outcome
Reduced
stormwater
runoff,
improved
water
quality
quantified
for
GI
projects](https://image.slidesharecdn.com/46-230308195754-dbbf0447/85/46-GREEN-INFRAESTRUCTURE-david-rouse-2015-pdf-146-320.jpg)