Download to read offline

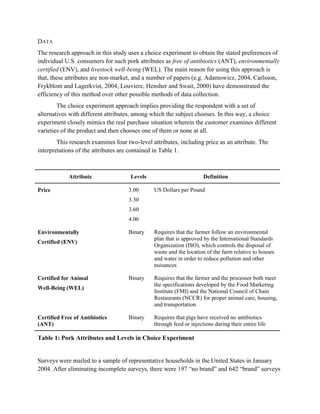
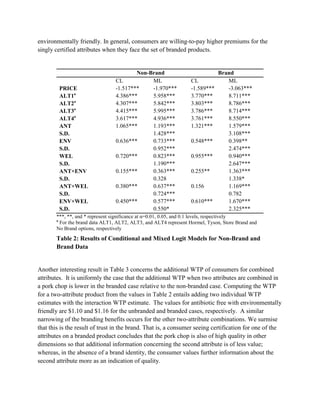

This document summarizes a study that examines consumer preferences for certified pork chops when presented with branded versus non-branded options. The study uses choice experiment surveys and conditional and mixed logit regression models to analyze how branding influences willingness to pay for certification attributes. The results suggest consumers are willing to pay more for certification when products are branded, and there is greater variation in willingness to pay for non-branded products. This may be due to increased uncertainty about quality consistency without brand information. The findings have implications for producers, retailers, and policymakers regarding branding strategies and credence attributes.