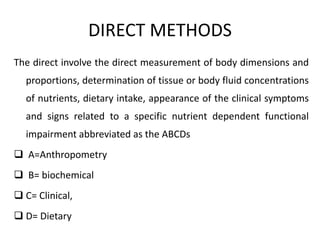
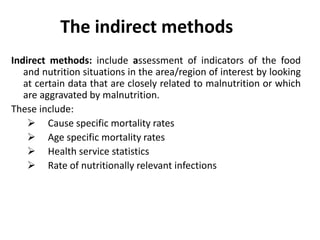
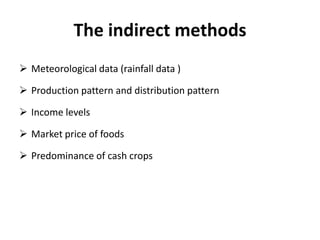
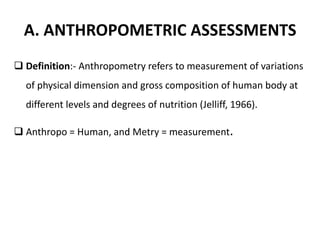
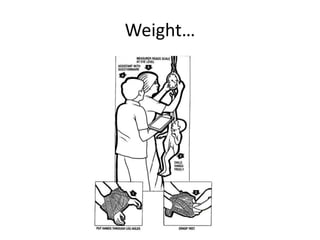
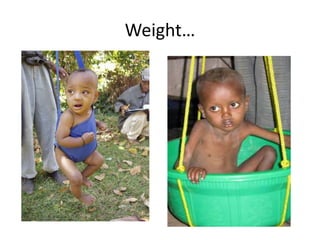
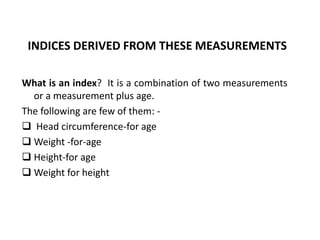
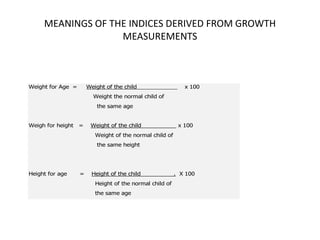
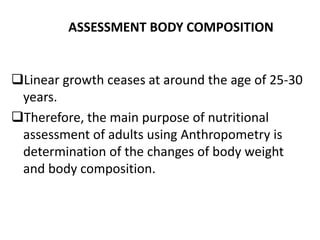
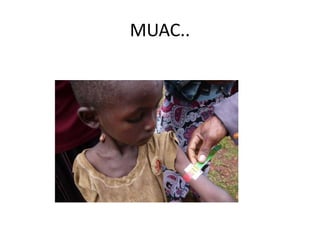
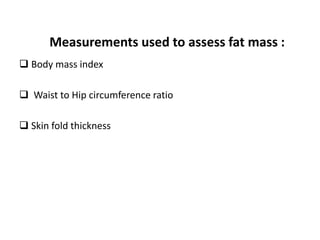
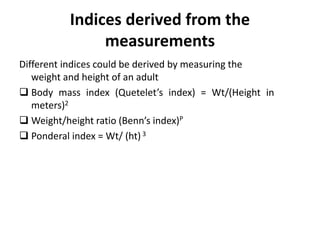
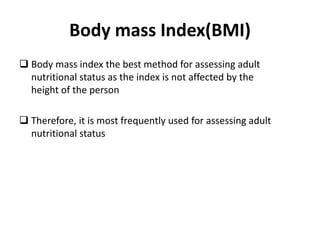
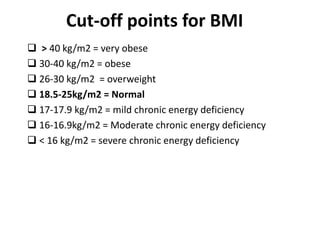
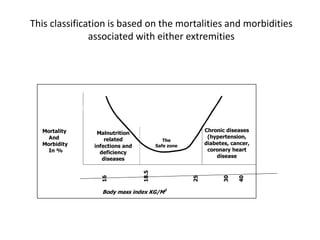
DEPARTMENT OF PUBLIC HEALTH
AFOMIA T. (BSC, MPH/NUTRITION)
Nutritional Assessment
2
Outline
• Definition of nutritional assessment
• Types of nutritional assessment
• Purpose of Anthropometric assessment
• Meaning and purpose of biochemical assessment
Definition
Nutritional assessment is an interpretation of
anthropometric, biochemical (laboratory), clinical and dietary
survey data to tell whether a person/ group of people is well
nourished or malnourished (Over nourished or under
nourished).
There are direct and indirect methods of assessing
Nutritional status
4
DIRECT METHODS
The direct involve the direct measurement of body dimensions and
proportions, determination of tissue or body fluid concentrations
of nutrients, dietary intake, appearance of the clinical symptoms
and signs related to a specific nutrient dependent functional
impairment abbreviated as the ABCDs
 A=Anthropometry
 B= biochemical
 C= Clinical,
 D= Dietary
5
The indirect methods
Indirect methods: include assessment of indicators of the food
and nutrition situations in the area/region of interest by looking
at certain data that are closely related to malnutrition or which
are aggravated by malnutrition.
These include:
 Cause specific mortality rates
 Age specific mortality rates
 Health service statistics
 Rate of nutritionally relevant infections
6
The indirect methods
 Meteorological data (rainfall data )
 Production pattern and distribution pattern
 Income levels
 Market price of foods
 Predominance of cash crops
7
A. ANTHROPOMETRIC ASSESSMENTS
 Definition:- Anthropometry refers to measurement of variations
of physical dimension and gross composition of human body at
different levels and degrees of nutrition (Jelliff, 1966).
 Anthropo = Human, and Metry = measurement.
8
Purposes of Anthropometric measurements
Anthropometric measurements are performed with two major
purposes in mind:
 IN CHILDREN: to assess physical growth
 IN ADULTS: to assess changes in body composition or weight
9
ANTHROPOMETRIC MEASUREMENTS OF
GROWTH
 Growth performance of children is an excellent reflection of
their underlying nutritional status.
 Children adapt to the chronic nutritional insult by either
reducing their rate of growth or by totally failing to grow.
10
HEAD CIRCUMFERENCE (HC):
 Measured using flexible measuring tape around 0.6cm wide to
the nearest 1mm.
 It is the circumference of the head along the supra orbital ridge
anteriorly and occipital prominence posteriorly.
 HC is useful in assessing chronic nutritional problems in under
two children.
 But after 2 years as the growth of the brain is sluggish it is not
useful.
11
LENGTH
 A wooden measuring board (also called sliding board) is
used for measuring length.
 It is measured in recumbent position in children <2 yrs old
to the nearest 1mm.
 It is always > height by 1-2cm.
 One assistant is needed in taking the measurement
 Measurement is read to the nearest mm
12
Length…
13
HEIGHT
 Is measured in children > 2 yrs and a adults in standing
position to the nearest 0.1 cm.
 The head should be in the Frankfurt plane during
measurement, knees should be straight and the heels buttocks
and the shoulders blades, should touch the vertical surface of
the stadio-meter ( anthropometer) or wall.
14
Height…
15
WEIGHT
 Weighing sling (spring balance) also called salter scale is
used for measurement of weight in children < 2 years.
 In children the measurement is performed to the nearest
10g.
 In adults and children >2 years, beam balance is used and
the measurement is performed to the nearest 0.1 kg.
16
Weight…
17
Weight…
18
INDICES DERIVED FROM THESE MEASUREMENTS
What is an index? It is a combination of two measurements
or a measurement plus age.
The following are few of them: -
 Head circumference-for age
 Weight -for-age
 Height-for age
 Weight for height
19
MEANINGS OF THE INDICES DERIVED FROM GROWTH
MEASUREMENTS
Weight for Age = Weight of the child x 100
Weight the normal child of
the same age
Weigh for height = Weight of the child x 100
Weight of the normal child of
the same height
Height for age = Height of the child . X 100
Height of the normal child of
the same age
20
 both weigh for age and weight for height are indices sensitive
to acute changes to nutritional status
 Height for age of children in a given population indicates their
nutritional status in the long run.
21
Indicator
An indicator is an index + a cut-off point.
E.g.
 W F A < 60% = is indicator of severe malnutrition
 MBI < 16 kg/m2 = indicator of severe chronic energy
deficiency
 W F H < 7o% = is indicator of severe wasting
22
Relationship of conventional cut-off points for diagnosing
moderate malnutrition
Type of
standard
Height for
age
Weight for
height
Weight for
age
Z-score -2 -2 -2
Standard
deviation
-2 -2 -2
Centile 3rd
3rd
3rd
Percent of the
median
90% 80% 80%
23
EXPRESSING ANTHROPOMETRIC
MEASUREMENTS
A. Z- score which is expressed as,
Z = median of the reference population---subject’s value X100
Standard deviation of the reference
-2 Z is a cut-off point for under nutrition
B. Standard deviation score which could be expressed as,
SD =(subject’s value -- the mean of the group) 2
Number of subjects—1
- 2 SD if a cut-off point for under nutrition
24
EXPRESSING ANTHROPOMETRIC MEASUREMENTS
#2
C. Percent of the median expressed as,
P = Weight or height Value of the subject X 100
(Median height or weight value of the reference of the same age)
80 % of the median is a cut-off point for under nutrition
D. Centiles, Expressed according to the value of the subject in reference to
the NCHS’s 3rd
,
5tyh, 10th
and 90th
centiles
Usually the 3rd
centiles is taken as a cut off point for labeling
malnourished
subject.
25
26
We use SD in Ethiopia
27
ASSESSMENT BODY COMPOSITION
Linear growth ceases at around the age of 25-30
years.
Therefore, the main purpose of nutritional
assessment of adults using Anthropometry is
determination of the changes of body weight
and body composition.
28
ASSESSMENT BODY COMPOSITION
Using Anthropometry
 Whole body level assessment is used
 In assessing body composition we consider the body to made
up of two compartments:
 The fat mass and the fat free mass. Total body mass= Fat
mass + fat free Mass.
 Therefore different measurements are used to assess these
two compartments:
29
Measurements used for assessing fat free mass:
Mid upper arm circumference***
Mid upper arm Muscle area
Mid thigh circumference
Mid thigh muscle area
Mid calf circumference
Mid calf muscle area
30
Mid upper arm circumference (MUAC)
 Is used for screening purposes especially in emergency
situations where there shortage of human resource, time and
other resources as it is less sensitive as compared to the other
indices.
 It is measured half way between the olecranon process and
acromion process using non stretchable tap
 In children the cut-off points are:
 Normal > 12.5 cm
 Mild to moderate malnutrition 11.5-12.5cm
 Severe malnutrition < 11.5cm
31
MUAC…
 It is a sensitive indicator of risk of mortality.
 Useful for screening of children for community based
nutrition interventions.
 Useful for the assessment of nutritional status of
pregnant women.
32
MUAC..
33
Measurements used to assess fat mass :
 Body mass index
 Waist to Hip circumference ratio
 Skin fold thickness
34
Indices derived from the
measurements
Different indices could be derived by measuring the
weight and height of an adult
 Body mass index (Quetelet’s index) = Wt/(Height in
meters)2
 Weight/height ratio (Benn’s index)P
 Ponderal index = Wt/ (ht)3
35
Body mass Index(BMI)
 Body mass index the best method for assessing adult
nutritional status as the index is not affected by the
height of the person
 Therefore, it is most frequently used for assessing adult
nutritional status
36
Cut-off points for BMI
 > 40 kg/m2 = very obese
 30-40 kg/m2 = obese
 26-30 kg/m2 = overweight
 18.5-25kg/m2 = Normal
 17-17.9 kg/m2 = mild chronic energy deficiency
 16-16.9kg/m2 = Moderate chronic energy deficiency
 < 16 kg/m2 = severe chronic energy deficiency
37
This classification is based on the mortalities and morbidities
associated with either extremities
The
Safe zone
Chronic diseases
(hypertension,
diabetes, cancer,
coronary heart
disease
Malnutrition
related
infections and
deficiency
diseases
Mortality
And
Morbidity
In %
16
18.5
25
30
40
Body mass index KG/M2
38
Arm span, Demi-span and Knee height
#1
 When it is not possible to measure height as in the case
of :
Elderly people
Kyphosis / Scoliosis
People unable to assume erect position
 Height can be estimated from arm span or demi-span
39
Arm span and Demi-span and Knee
height #2
• Arm span is the distance between the two tallest fingers
when a person stretches his/her arm on straight line
• Demi-span is the distance between the roots of the two
tallest fingers when a person stretches his/her arm on
straight line
• Knee height is the distance measured from the heel to
the top of the knee
40
Estimating height from knee height
 Height(men)= 64.19-(0.4Xage) + (2.02 X knee height)
 Height(women)=84.88-(0.24Xage) +(1.83 x knee height)
41
SKIN FOLD THICKNESSES #1
Skin fold thickness is done at the following
anatomical sights:
Biceps skin fold
Triceps skin fold
Subscapular skin fold
Suprailliac skin fold
Mid axillary skin fold
Thigh skin fold
Calf skin fold
42
SKIN FOLD THICKNESSES # 3
Skin fold should be read to the nearest 0.5 mm
after 2-3 seconds of caliper application
Measurements are made in triplicate until
readings agree within ± 1.0 mm
All the measurements should be made on the
left side
43
WAIST TO HIP CIRCUMFERENCE RATIO
It is the circumference of the waist measured mid-
way between the lowest rib cage and anterior
superior iliac spine divided by the circumference
of the hip measured at the level of the greater
trochantor off the fumer( both are measured to
the nearest 0.5 cm)
If the ratio is > 1 in male, and > 0.87 in female
there is high risk of coronary heart disease.
44
B. BIOCHEMICAL (LABORATORY) METHODS
• This involves measurement of either total amount of the nutrient
in the body, or its concentration in a particular storage site
(organ) in the body or in the body fluids.
• This group includes those that are indicative of defect in
intermediary metabolism in other words they occur when there
is a biochemical lesion (Depletion).
• The depletion could be detected by biochemical tests and/or by
tests that measure physiological or behavioral functions
dependent on specific nutrient.
45
Static biochemical tests:-
This involves measurement a nutrient or its metabolites in pre-
Selected biological material (blood, body fluids, urine, hair,
fingernails etc.)
Biochemical Tests (laboratory)
1. Serum ferritin level
2. Serum HDL
3. Erythrocyte Folate
4. Tissue stores of Vit. A, Vit D,
46
C. CLINICAL METHODS #1
• This are detection of deviations from the normal state of
nutrition just by observing and interpreting clinical signs and
symptoms of deficiency or under intake, for instance, see the
following
47
CLINICAL METHODS #2
Sign/ symptom Nutritional abnormality
 Inability to see during the evening or dim
light (Night blindness also called nyctalopia)
 Bitot’s spots
Vitamin A deficiency:
 Easy bruising of skin
 Spongy bleeding gums
Scurvy (vitamin C deficiency)
 Pale: palms, conjunctiva, tongue
 Easy fatigability, loss of appetite shortness
of breath
Anemia: Which may herald,
deficiency of: Iron, Vitamin
B12, Folic acid, copper,
protein (main causes of
nutritional anemia)
48
ii. DIETARY METHODS
These methods include assessment of past or current
intakes of nutrients from food by individuals or a group in
order to know their nutritional status.
At national level:-
Food balance Sheet
Also called National food disappearance data or
food going in to consumption
Market data bases( for fortified foods by FDA)
At a household level
 Weighed record method
 Observed weighed method
Food Diary method
Household food record method
49
Methods used to assess current intake
(at a group or individual level)
I. Weighed record method: In this method the
subject will be asked to weigh whatever he/she
consumes including drinks both before cooking
and after cooking and the portion sizes he
consumed and the left over.
50
ii. Observed weighed method
In this method the investigator him/herself records
the amount and type of food consumed by the study
subjects over specified period of time.
This method is usually applied for disabled people,
infants and small children, mentally ill people or
institutionalized elderly people or patients admitted
to a hospital.
51
III. Food Diary method
• In this method the subject/s are asked to record what
ever they eat including beverages for specified period
of time with estimation of the portion sizes
consumed.
52
II. Methods Used to assess past intake
24 hours dietary recall
• In this method, the subjects are requested to remember
whatever they consumed within the last 24 hours.
• This involves all beverages, snacks deserts etc. That have
been ingested from x time yesterday to x time today.
• The portion sizes consumed during this time should also
be determined by the respondents by assessing them to
use either photographs or the common food being
consumed at different sizes or by using a line graph etc.
• Currently- Multiple pass 24 hours is used to improve the
quality
53
Dietary history
This method is used to assess the nutrient intake
of an individual or a group from food over a
longer period of time, usually to see the
association between diet and disease.
54
Food frequency questionnaire
• This method is based on the preparation of a food
frequency questionnaire, which is based on the local
staple diet to determine the frequency of
consumption of a particular nutrient.
• This could be achieved through self or interviewer
administration of the questionnaire.
• Sometimes the quantities consumed could be
included, in such circumstances, the FFQ is called semi
quantitative FFQ.
• The following table indicates the frame of a food
frequency questionnaire.
55
Example of semi quantitative FFQ for Vitamin A
friendly foods
Frequency of consumption
Food list
Daily
Every
other
day
Once
per
week
Once
per
month
Portion size
consumed
Carrot
Cabbage
Papaya
Mango
Cod liver oil
Liver
56
Stages of development of nutritional deficiency
STAGE DEPLETION STATUS METHOD OF
ASSESSMENT
One: Dietary inadequacy Dietary
Two: Decreased level in
the tissue reserves
Biochemical
Three: Decreased level in
the body fluids
Biochemical
Four: Decreased
functional level in
the tissues
Biochemical
Five: Decreased activity of
nutrient dependent
enzymes
Biochemical/Biophysi
cal
Six: Functional changes Clinical/biophysical/
Anthropometric
Seven: Clinical symptoms Clinical
Eight Anatomical signs Clinical
57
Thank you !
58

4$5 nutritional assessmenteeeedeeee.pptx

  • 1.
    DEPARTMENT OF PUBLICHEALTH AFOMIA T. (BSC, MPH/NUTRITION)
  • 2.
  • 3.
    Outline • Definition ofnutritional assessment • Types of nutritional assessment • Purpose of Anthropometric assessment • Meaning and purpose of biochemical assessment
  • 4.
    Definition Nutritional assessment isan interpretation of anthropometric, biochemical (laboratory), clinical and dietary survey data to tell whether a person/ group of people is well nourished or malnourished (Over nourished or under nourished). There are direct and indirect methods of assessing Nutritional status 4
  • 5.
    DIRECT METHODS The directinvolve the direct measurement of body dimensions and proportions, determination of tissue or body fluid concentrations of nutrients, dietary intake, appearance of the clinical symptoms and signs related to a specific nutrient dependent functional impairment abbreviated as the ABCDs  A=Anthropometry  B= biochemical  C= Clinical,  D= Dietary 5
  • 6.
    The indirect methods Indirectmethods: include assessment of indicators of the food and nutrition situations in the area/region of interest by looking at certain data that are closely related to malnutrition or which are aggravated by malnutrition. These include:  Cause specific mortality rates  Age specific mortality rates  Health service statistics  Rate of nutritionally relevant infections 6
  • 7.
    The indirect methods Meteorological data (rainfall data )  Production pattern and distribution pattern  Income levels  Market price of foods  Predominance of cash crops 7
  • 8.
    A. ANTHROPOMETRIC ASSESSMENTS Definition:- Anthropometry refers to measurement of variations of physical dimension and gross composition of human body at different levels and degrees of nutrition (Jelliff, 1966).  Anthropo = Human, and Metry = measurement. 8
  • 9.
    Purposes of Anthropometricmeasurements Anthropometric measurements are performed with two major purposes in mind:  IN CHILDREN: to assess physical growth  IN ADULTS: to assess changes in body composition or weight 9
  • 10.
    ANTHROPOMETRIC MEASUREMENTS OF GROWTH Growth performance of children is an excellent reflection of their underlying nutritional status.  Children adapt to the chronic nutritional insult by either reducing their rate of growth or by totally failing to grow. 10
  • 11.
    HEAD CIRCUMFERENCE (HC): Measured using flexible measuring tape around 0.6cm wide to the nearest 1mm.  It is the circumference of the head along the supra orbital ridge anteriorly and occipital prominence posteriorly.  HC is useful in assessing chronic nutritional problems in under two children.  But after 2 years as the growth of the brain is sluggish it is not useful. 11
  • 12.
    LENGTH  A woodenmeasuring board (also called sliding board) is used for measuring length.  It is measured in recumbent position in children <2 yrs old to the nearest 1mm.  It is always > height by 1-2cm.  One assistant is needed in taking the measurement  Measurement is read to the nearest mm 12
  • 13.
  • 14.
    HEIGHT  Is measuredin children > 2 yrs and a adults in standing position to the nearest 0.1 cm.  The head should be in the Frankfurt plane during measurement, knees should be straight and the heels buttocks and the shoulders blades, should touch the vertical surface of the stadio-meter ( anthropometer) or wall. 14
  • 15.
  • 16.
    WEIGHT  Weighing sling(spring balance) also called salter scale is used for measurement of weight in children < 2 years.  In children the measurement is performed to the nearest 10g.  In adults and children >2 years, beam balance is used and the measurement is performed to the nearest 0.1 kg. 16
  • 17.
  • 18.
  • 19.
    INDICES DERIVED FROMTHESE MEASUREMENTS What is an index? It is a combination of two measurements or a measurement plus age. The following are few of them: -  Head circumference-for age  Weight -for-age  Height-for age  Weight for height 19
  • 20.
    MEANINGS OF THEINDICES DERIVED FROM GROWTH MEASUREMENTS Weight for Age = Weight of the child x 100 Weight the normal child of the same age Weigh for height = Weight of the child x 100 Weight of the normal child of the same height Height for age = Height of the child . X 100 Height of the normal child of the same age 20
  • 21.
     both weighfor age and weight for height are indices sensitive to acute changes to nutritional status  Height for age of children in a given population indicates their nutritional status in the long run. 21
  • 22.
    Indicator An indicator isan index + a cut-off point. E.g.  W F A < 60% = is indicator of severe malnutrition  MBI < 16 kg/m2 = indicator of severe chronic energy deficiency  W F H < 7o% = is indicator of severe wasting 22
  • 23.
    Relationship of conventionalcut-off points for diagnosing moderate malnutrition Type of standard Height for age Weight for height Weight for age Z-score -2 -2 -2 Standard deviation -2 -2 -2 Centile 3rd 3rd 3rd Percent of the median 90% 80% 80% 23
  • 24.
    EXPRESSING ANTHROPOMETRIC MEASUREMENTS A. Z-score which is expressed as, Z = median of the reference population---subject’s value X100 Standard deviation of the reference -2 Z is a cut-off point for under nutrition B. Standard deviation score which could be expressed as, SD =(subject’s value -- the mean of the group) 2 Number of subjects—1 - 2 SD if a cut-off point for under nutrition 24
  • 25.
    EXPRESSING ANTHROPOMETRIC MEASUREMENTS #2 C.Percent of the median expressed as, P = Weight or height Value of the subject X 100 (Median height or weight value of the reference of the same age) 80 % of the median is a cut-off point for under nutrition D. Centiles, Expressed according to the value of the subject in reference to the NCHS’s 3rd , 5tyh, 10th and 90th centiles Usually the 3rd centiles is taken as a cut off point for labeling malnourished subject. 25
  • 26.
  • 27.
    We use SDin Ethiopia 27
  • 28.
    ASSESSMENT BODY COMPOSITION Lineargrowth ceases at around the age of 25-30 years. Therefore, the main purpose of nutritional assessment of adults using Anthropometry is determination of the changes of body weight and body composition. 28
  • 29.
    ASSESSMENT BODY COMPOSITION UsingAnthropometry  Whole body level assessment is used  In assessing body composition we consider the body to made up of two compartments:  The fat mass and the fat free mass. Total body mass= Fat mass + fat free Mass.  Therefore different measurements are used to assess these two compartments: 29
  • 30.
    Measurements used forassessing fat free mass: Mid upper arm circumference*** Mid upper arm Muscle area Mid thigh circumference Mid thigh muscle area Mid calf circumference Mid calf muscle area 30
  • 31.
    Mid upper armcircumference (MUAC)  Is used for screening purposes especially in emergency situations where there shortage of human resource, time and other resources as it is less sensitive as compared to the other indices.  It is measured half way between the olecranon process and acromion process using non stretchable tap  In children the cut-off points are:  Normal > 12.5 cm  Mild to moderate malnutrition 11.5-12.5cm  Severe malnutrition < 11.5cm 31
  • 32.
    MUAC…  It isa sensitive indicator of risk of mortality.  Useful for screening of children for community based nutrition interventions.  Useful for the assessment of nutritional status of pregnant women. 32
  • 33.
  • 34.
    Measurements used toassess fat mass :  Body mass index  Waist to Hip circumference ratio  Skin fold thickness 34
  • 35.
    Indices derived fromthe measurements Different indices could be derived by measuring the weight and height of an adult  Body mass index (Quetelet’s index) = Wt/(Height in meters)2  Weight/height ratio (Benn’s index)P  Ponderal index = Wt/ (ht)3 35
  • 36.
    Body mass Index(BMI) Body mass index the best method for assessing adult nutritional status as the index is not affected by the height of the person  Therefore, it is most frequently used for assessing adult nutritional status 36
  • 37.
    Cut-off points forBMI  > 40 kg/m2 = very obese  30-40 kg/m2 = obese  26-30 kg/m2 = overweight  18.5-25kg/m2 = Normal  17-17.9 kg/m2 = mild chronic energy deficiency  16-16.9kg/m2 = Moderate chronic energy deficiency  < 16 kg/m2 = severe chronic energy deficiency 37
  • 38.
    This classification isbased on the mortalities and morbidities associated with either extremities The Safe zone Chronic diseases (hypertension, diabetes, cancer, coronary heart disease Malnutrition related infections and deficiency diseases Mortality And Morbidity In % 16 18.5 25 30 40 Body mass index KG/M2 38
  • 39.
    Arm span, Demi-spanand Knee height #1  When it is not possible to measure height as in the case of : Elderly people Kyphosis / Scoliosis People unable to assume erect position  Height can be estimated from arm span or demi-span 39
  • 40.
    Arm span andDemi-span and Knee height #2 • Arm span is the distance between the two tallest fingers when a person stretches his/her arm on straight line • Demi-span is the distance between the roots of the two tallest fingers when a person stretches his/her arm on straight line • Knee height is the distance measured from the heel to the top of the knee 40
  • 41.
    Estimating height fromknee height  Height(men)= 64.19-(0.4Xage) + (2.02 X knee height)  Height(women)=84.88-(0.24Xage) +(1.83 x knee height) 41
  • 42.
    SKIN FOLD THICKNESSES#1 Skin fold thickness is done at the following anatomical sights: Biceps skin fold Triceps skin fold Subscapular skin fold Suprailliac skin fold Mid axillary skin fold Thigh skin fold Calf skin fold 42
  • 43.
    SKIN FOLD THICKNESSES# 3 Skin fold should be read to the nearest 0.5 mm after 2-3 seconds of caliper application Measurements are made in triplicate until readings agree within ± 1.0 mm All the measurements should be made on the left side 43
  • 44.
    WAIST TO HIPCIRCUMFERENCE RATIO It is the circumference of the waist measured mid- way between the lowest rib cage and anterior superior iliac spine divided by the circumference of the hip measured at the level of the greater trochantor off the fumer( both are measured to the nearest 0.5 cm) If the ratio is > 1 in male, and > 0.87 in female there is high risk of coronary heart disease. 44
  • 45.
    B. BIOCHEMICAL (LABORATORY)METHODS • This involves measurement of either total amount of the nutrient in the body, or its concentration in a particular storage site (organ) in the body or in the body fluids. • This group includes those that are indicative of defect in intermediary metabolism in other words they occur when there is a biochemical lesion (Depletion). • The depletion could be detected by biochemical tests and/or by tests that measure physiological or behavioral functions dependent on specific nutrient. 45
  • 46.
    Static biochemical tests:- Thisinvolves measurement a nutrient or its metabolites in pre- Selected biological material (blood, body fluids, urine, hair, fingernails etc.) Biochemical Tests (laboratory) 1. Serum ferritin level 2. Serum HDL 3. Erythrocyte Folate 4. Tissue stores of Vit. A, Vit D, 46
  • 47.
    C. CLINICAL METHODS#1 • This are detection of deviations from the normal state of nutrition just by observing and interpreting clinical signs and symptoms of deficiency or under intake, for instance, see the following 47
  • 48.
    CLINICAL METHODS #2 Sign/symptom Nutritional abnormality  Inability to see during the evening or dim light (Night blindness also called nyctalopia)  Bitot’s spots Vitamin A deficiency:  Easy bruising of skin  Spongy bleeding gums Scurvy (vitamin C deficiency)  Pale: palms, conjunctiva, tongue  Easy fatigability, loss of appetite shortness of breath Anemia: Which may herald, deficiency of: Iron, Vitamin B12, Folic acid, copper, protein (main causes of nutritional anemia) 48
  • 49.
    ii. DIETARY METHODS Thesemethods include assessment of past or current intakes of nutrients from food by individuals or a group in order to know their nutritional status. At national level:- Food balance Sheet Also called National food disappearance data or food going in to consumption Market data bases( for fortified foods by FDA) At a household level  Weighed record method  Observed weighed method Food Diary method Household food record method 49
  • 50.
    Methods used toassess current intake (at a group or individual level) I. Weighed record method: In this method the subject will be asked to weigh whatever he/she consumes including drinks both before cooking and after cooking and the portion sizes he consumed and the left over. 50
  • 51.
    ii. Observed weighedmethod In this method the investigator him/herself records the amount and type of food consumed by the study subjects over specified period of time. This method is usually applied for disabled people, infants and small children, mentally ill people or institutionalized elderly people or patients admitted to a hospital. 51
  • 52.
    III. Food Diarymethod • In this method the subject/s are asked to record what ever they eat including beverages for specified period of time with estimation of the portion sizes consumed. 52
  • 53.
    II. Methods Usedto assess past intake 24 hours dietary recall • In this method, the subjects are requested to remember whatever they consumed within the last 24 hours. • This involves all beverages, snacks deserts etc. That have been ingested from x time yesterday to x time today. • The portion sizes consumed during this time should also be determined by the respondents by assessing them to use either photographs or the common food being consumed at different sizes or by using a line graph etc. • Currently- Multiple pass 24 hours is used to improve the quality 53
  • 54.
    Dietary history This methodis used to assess the nutrient intake of an individual or a group from food over a longer period of time, usually to see the association between diet and disease. 54
  • 55.
    Food frequency questionnaire •This method is based on the preparation of a food frequency questionnaire, which is based on the local staple diet to determine the frequency of consumption of a particular nutrient. • This could be achieved through self or interviewer administration of the questionnaire. • Sometimes the quantities consumed could be included, in such circumstances, the FFQ is called semi quantitative FFQ. • The following table indicates the frame of a food frequency questionnaire. 55
  • 56.
    Example of semiquantitative FFQ for Vitamin A friendly foods Frequency of consumption Food list Daily Every other day Once per week Once per month Portion size consumed Carrot Cabbage Papaya Mango Cod liver oil Liver 56
  • 57.
    Stages of developmentof nutritional deficiency STAGE DEPLETION STATUS METHOD OF ASSESSMENT One: Dietary inadequacy Dietary Two: Decreased level in the tissue reserves Biochemical Three: Decreased level in the body fluids Biochemical Four: Decreased functional level in the tissues Biochemical Five: Decreased activity of nutrient dependent enzymes Biochemical/Biophysi cal Six: Functional changes Clinical/biophysical/ Anthropometric Seven: Clinical symptoms Clinical Eight Anatomical signs Clinical 57
  • 58.