Download as PDF, PPTX


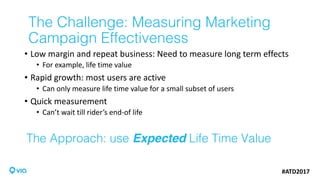


The document discusses the transformation of transportation through the emergence of on-demand shuttle networks facilitated by software and smartphone apps, projecting significant growth from 2017 to 2030. It emphasizes the importance of measuring the expected lifetime value (ELTV) of users and the effectiveness of marketing campaigns in a low-margin, high-volume business model. The challenges of estimating ELTV components such as life expectancy and revenue streams are highlighted, along with the use of machine learning to improve accuracy in these measurements.