The study compared gene expression profiles between breast and prostate tumor stromas using microarray data and gene set enrichment analysis (GSEA). GSEA identified pathways that were commonly up-regulated or down-regulated in both tumor stromas, as well as pathways that were differentially regulated between them. Specifically, 9 pathways showed common regulation, while others like ABC transporters and oxidative phosphorylation differed in their regulation between tumor types. Certain genes and transcription factors also demonstrated heterogeneous expression patterns between breast and prostate tumor stroma. The results reveal genomic heterogeneity between tumor microenvironments and identify candidate signatures relevant to cancer progression.
![Oncotarget8687www.impactjournals.com/oncotarget
www.impactjournals.com/oncotarget/ Oncotarget, Vol. 6, No. 11
The stromal genome heterogeneity between breast and prostate
tumors revealed by a comparative transcriptomic analysis
Kan He1,*
, Wenwen Lv1,*
, Dongni Zheng1,*
, Fei Cheng1,*
, Tao Zhou1
, Shoudong
Ye1,2,3
, Qian Ban1
, Qilong Ying2
, Bei Huang1
, Lei Chen1
, Guohua Wu4
and Dahai Liu1
1
Center for Stem Cell and Translational Medicine, School of Life Sciences, Anhui University, Hefei City, Anhui, China
2
Eli and Edythe Broad Center for Regenerative Medicine and Stem Cell Research, Department of Cell and Neurobiology, Keck
School of Medicine, University of Southern California, Los Angeles, California, USA
3
Department of Molecular Genetics, Shanghai Medical School, Fudan University, Shanghai, China
4
Laboratory of Quality & Safety Risk Assessment for Sericultural Products and Edible Insects, Ministry of Agriculture, College
of Biotechnology and Sericultural Research Institute, Jiangsu University of Science and Technology, Zhenjiang, China
*
These authors have contributed equally to this work
Correspondence to: Kan He, email: hekan_803@163.com
Correspondence to: Dahai Liu, email: seansean2014@126.com
Keywords: heterogeneity, breast tumor, prostate tumor, GSEA, pathway
Received: January 12, 2015 Accepted: February 12, 2015 Published: March 04, 2015
This is an open-access article distributed under the terms of the Creative Commons Attribution License, which permits unrestricted use,
distribution, and reproduction in any medium, provided the original author and source are credited.
Abstract
Stromal microenvironment increases tumor cell survival, proliferation and
migration, and promotes angiogenesis. In order to provide comprehensive information
on the stromal heterogeneity of diverse tumors, here we employed the microarray
datasets of human invasive breast and prostate cancer-associated stromals and
applied Gene Set Enrichment Analysis (GSEA) to compare the gene expression profiles
between them. As a result, 8 up-regulated pathways and 73 down-regulated pathways
were identified in the breast tumor stroma, while 32 up-regulated pathways and
18 down-regulated pathways were identified in the prostate tumor stroma. Only 9
pathways such as tryptophan metabolism were commonly up or down regulated,
but most of them (including ABC transporters) were specific for these two tumors.
Several essential tumors stromal marker genes were also significantly identified.
For example, CDH3 was significantly up-regulated in the stromals of both breast and
prostate tumors, however EGFR was only significantly down-regulated in the stromal
of breast tumor. Our study would be helpful for future therapeutic and predictive
applications in breast and prostate cancers.
INTRODUCTION
Cancer is not a single disease but includes numerous
subtypes, each of which has its distinct histopathological
and biological features [1]. Cancer heterogeneity refers to
the distinction among different cancer cells in the aspects
of morphology, phenotype and function, which includes
the diversities in cellular morphology, gene expression,
metabolism, motility, proliferation, and metastatic
potential [2, 3]. The extensive heterogeneity exists both
between tumors (inter-tumor heterogeneity) and within
tumors (intra-tumor heterogeneity) [4]. The heterogeneity
of cancer cells has been recognized as early as 1930s when
the experiment showed that only a part of mouse tumors
cells could give rise to new tumors when transplanted [5].
Although certain genetic similarities are shared
between the primary and metastatic tumor cells, there are
also some additional mutations in metastases. For both
prostate cancer [6, 7] and breast cancer [8, 9], a number
of mutations had been found which are different between
the primary tumors and metastases. It suggests the
presence of certain genetic diversity between them, and
also reveals the evolution of tumor heterogeneity. A recent
study analyzed primary tumors and metastases of invasive
lobular breast cancer at single nucleotide resolution, which
revealed mutations that only occur in metastases, and more
metastasis loci lead to greater amount of mutations [10].
It is now widely recognized that cancer progression](https://image.slidesharecdn.com/b0221b1e-684c-4fbf-bda6-0a21b50f2a8c-161105064720/85/3478-43782-3-PB-1-320.jpg)
![Oncotarget8687www.impactjournals.com/oncotarget
www.impactjournals.com/oncotarget/ Oncotarget, Vol. 6, No. 11
The stromal genome heterogeneity between breast and prostate
tumors revealed by a comparative transcriptomic analysis
Kan He1,*
, Wenwen Lv1,*
, Dongni Zheng1,*
, Fei Cheng1,*
, Tao Zhou1
, Shoudong
Ye1,2,3
, Qian Ban1
, Qilong Ying2
, Bei Huang1
, Lei Chen1
, Guohua Wu4
and Dahai Liu1
1
Center for Stem Cell and Translational Medicine, School of Life Sciences, Anhui University, Hefei City, Anhui, China
2
Eli and Edythe Broad Center for Regenerative Medicine and Stem Cell Research, Department of Cell and Neurobiology, Keck
School of Medicine, University of Southern California, Los Angeles, California, USA
3
Department of Molecular Genetics, Shanghai Medical School, Fudan University, Shanghai, China
4
Laboratory of Quality & Safety Risk Assessment for Sericultural Products and Edible Insects, Ministry of Agriculture, College
of Biotechnology and Sericultural Research Institute, Jiangsu University of Science and Technology, Zhenjiang, China
*
These authors have contributed equally to this work
Correspondence to: Kan He, email: hekan_803@163.com
Correspondence to: Dahai Liu, email: seansean2014@126.com
Keywords: heterogeneity, breast tumor, prostate tumor, GSEA, pathway
Received: January 12, 2015 Accepted: February 12, 2015 Published: March 04, 2015
This is an open-access article distributed under the terms of the Creative Commons Attribution License, which permits unrestricted use,
distribution, and reproduction in any medium, provided the original author and source are credited.
Abstract
Stromal microenvironment increases tumor cell survival, proliferation and
migration, and promotes angiogenesis. In order to provide comprehensive information
on the stromal heterogeneity of diverse tumors, here we employed the microarray
datasets of human invasive breast and prostate cancer-associated stromals and
applied Gene Set Enrichment Analysis (GSEA) to compare the gene expression profiles
between them. As a result, 8 up-regulated pathways and 73 down-regulated pathways
were identified in the breast tumor stroma, while 32 up-regulated pathways and
18 down-regulated pathways were identified in the prostate tumor stroma. Only 9
pathways such as tryptophan metabolism were commonly up or down regulated,
but most of them (including ABC transporters) were specific for these two tumors.
Several essential tumors stromal marker genes were also significantly identified.
For example, CDH3 was significantly up-regulated in the stromals of both breast and
prostate tumors, however EGFR was only significantly down-regulated in the stromal
of breast tumor. Our study would be helpful for future therapeutic and predictive
applications in breast and prostate cancers.
INTRODUCTION
Cancer is not a single disease but includes numerous
subtypes, each of which has its distinct histopathological
and biological features [1]. Cancer heterogeneity refers to
the distinction among different cancer cells in the aspects
of morphology, phenotype and function, which includes
the diversities in cellular morphology, gene expression,
metabolism, motility, proliferation, and metastatic
potential [2, 3]. The extensive heterogeneity exists both
between tumors (inter-tumor heterogeneity) and within
tumors (intra-tumor heterogeneity) [4]. The heterogeneity
of cancer cells has been recognized as early as 1930s when
the experiment showed that only a part of mouse tumors
cells could give rise to new tumors when transplanted [5].
Although certain genetic similarities are shared
between the primary and metastatic tumor cells, there are
also some additional mutations in metastases. For both
prostate cancer [6, 7] and breast cancer [8, 9], a number
of mutations had been found which are different between
the primary tumors and metastases. It suggests the
presence of certain genetic diversity between them, and
also reveals the evolution of tumor heterogeneity. A recent
study analyzed primary tumors and metastases of invasive
lobular breast cancer at single nucleotide resolution, which
revealed mutations that only occur in metastases, and more
metastasis loci lead to greater amount of mutations [10].
It is now widely recognized that cancer progression](https://image.slidesharecdn.com/b0221b1e-684c-4fbf-bda6-0a21b50f2a8c-161105064720/75/3478-43782-3-PB-1-2048.jpg)
![Oncotarget8688www.impactjournals.com/oncotarget
is not exclusively regulated by intra-tumor heterogeneity
but also depends on the heterogeneity of tumor
microenvironment, in which the stroma compartment plays
an important role [11]. This suggests that understanding
cancer by tumor cell genomic analysis is not sufficient,
while analyzing tumor cells together with stromal cells
may provide more comprehensive and meaningful data
[12].
The tumor stroma is the complex arrangement of
various stromal cells and extracellular matrix, which act
in a coordinated manner to regulate cell function and
maintain overall tissue homeostasis. In order to maintain
homeostasis, the host tissue stroma interacts with
carcinoma in a process similar to the tissue remodeling
in wound repair [11, 13]. This process builds a new
tumorigenesis-promoting stromal microenvironment,
which supports tumor cell survival, proliferation and
migration, and promotes angiogenesis [14].
One important reason why gene expression of
cancer stroma has potential for cancer treatment and
prediction is that cancer stroma maintains a normal
genotype, because stromal reactions in response to
cancer epithelium mostly only alter gene expression,
without drastic and stochastic genomic changes [15, 16].
In addition, due to coevolution of cancer and stroma in
the process of cancer progression, many genes were
commonly expressed in stroma and cancer cells [17].
Active tumor evolution leads to therapeutic resistance,
which is illustrative of dynamic interplay between tumor
cells and their microenvironments when the selective
pressure of drug therapy is applied. Despite obtained
success in targeting tumor microenvironment, significant
challenges still lie ahead for the implementation of stromal
targeting in clinical practice [18]. Both the composition
of tumor stroma and the stromal response to cancer are
heterogeneous, while one stromal molecular signature
correlates positively with survival in one tumor type, it
may correlate inversely with survival of another tumor
type, or it may be irrelevant at all. This heterogeneity
leads to the complexity in clinical application of stromal
molecular signatures and further studies of the stromal
heterogeneity need to be done.
In the present study, we employed and reanalyzed
the published microarray datasets of human breast and
prostate cancer stroma from the public database library of
GEO. Gene Set Enrichment Analysis (GSEA) was applied
to compare the gene expression profiles between these two
different invasive cancer types, especially in an effort to
indicate the degree of stromal heterogeneity between them
and identify candidate stromal gene expression signatures
relevant to cancer progression. GSEA has the advantage
to highlight genes weakly connected to the phenotype
through pathway analysis which may be difficult to detect
by using classical univariate statistics [19-23]. Through
GSEA analysis, the critical pathways that were up- or
down-regulated in the stroma of two types of cancer were
identified, and we then constructed coexpression networks
of related pathways with the significantly core genes and
transcription factors. Our study would be helpful for
future therapeutic and predictive applications in breast and
prostate cancer.
RESULTS AND DISCUSSION
Comparison of results between GSEA and DEGA
According to the approach of differentially
expressed gene analysis (DEGA) studied by Planche et
al., 643 and 319 differentially expressed genes between
tumor and normal stroma were identified for breast cancer
and prostate cancer, respectively (shown in Supplementary
File 1)[24]. The DEGA approach was based on a paired
analysis of differential expression using the package of
limma with the cutoff of false positive rate (FDR) as 0.01.
Here, we used standardized microarray preprocessing and
GSEA with comprehensive expression profiles in order to
find greater data convergence and provide a systematic
insight into the associated pathways in both human breast
and prostate tumor stromals. In our study, 8 up-regulated
and 73 down-regulated pathways were significantly
identified in breast tumor stromal, while 32 up-regulated
and 18 down-regulated pathways were significantly
identified in prostate tumor stromal based on the approach
of GSEA. Totally, 3337 and 2145 genes were dysregulated
in breast and prostate tumor stromal, respectively (shown
in Supplementary File 2). By comparison, there were 84
common genes between DEGA and GSEA results for
breast tumor stromal. The significance of overlapping was
p=2.95E-11 (Figure 1A). For prostate tumor, the common
genes number was 17 with the overlapping significance
of p=4.65E-02 (Figure 1B). It indicated that our GSEA
results would be not only consistent with the previous
DEGA results but also more comprehensive. In addition,
360 and 342 dysregulated transcription factors (TFs)
were further identified in breast tumor and prostate tumor
stromal, respectively (shown in Supplementary File 3).
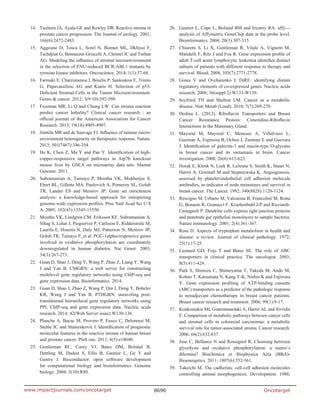
The stromal genome heterogeneity in multiple
pathways level
Firstly, the common GSEA method was applied to
the stromal regions of human breast and prostate tumors.
For individual analysis, we obtained the significant
pathways in each dataset, which were summarized in
Figure 2A and Supplementary File 2. Firstly, we compared
the up-regulated and down-regulated pathways in the
stromals of both tumor types, respectively. Interestingly, 9
highly common pathways were identified, including only
1 up-regulated and 8 down-regulated pathways common
to the breast tumor and prostate tumor stromal (shown](https://image.slidesharecdn.com/b0221b1e-684c-4fbf-bda6-0a21b50f2a8c-161105064720/85/3478-43782-3-PB-2-320.jpg)
![Oncotarget8689www.impactjournals.com/oncotarget
in Table 1 and Figure 2B). The most down-regulated
pathways were metabolism related pathway, such as
amino sugar and nucleotide sugar metabolism, riboflavin
metabolism, mucin type O-glycan biosynthesis, and
glycosphingolipid biosynthesis-lacto and neolacto series
identified in both breast and prostate tumor stromal [29-
31]. Besides, cell adhesion molecules (CAMs) are related
to environmental information processing, which have
a crucial role in tumor progression, in particular during
invasion and metastasis [32]. The pathway of leukocyte
transendothelial migration is associated with organismal
systems. The pathway of phagosome is cellular processes
related. Bacterial invasion of epithelial cells, one part
of human diseases, which has reported that induction of
inflammation by bacteria and viral infections increases
cancer risk [33]. The only one upregulated pathway was
tryptophan metabolism, which is metabolism related and
altered in patients suffering from gynecological cancer
compared to healthy controls (shown in Figure 3) [34].
In addition, there were several tissue-specially
identified pathways. 2 pathways were up-regulated in
breast tumor stromal and down-regulated in prostate
tumor stromal, such as the pathways of taste transduction
and ABC transporters (Table 1). ATP-binding cassette
Table 1: The dysregulated pathways identified in both human breast and prostate tumor stromal
Regulation Pathways Groups
Commonly
up-regulated
(1)
00380: Tryptophan metabolism Metabolism
Commonly down-regulated
(8)
04514: Cell adhesion molecules (CAMs) Environmental Information
Processing
00512: Mucin type O-Glycan biosynthesis Metabolism
04670: Leukocyte transendothelial migration Organismal Systems
00740: Riboflavin metabolism Metabolism
04145: Phagosome Cellular Processes
00601: Glycosphingolipid biosynthesis - lacto and
neolacto series
Metabolism
00520: Amino sugar and nucleotide sugar
metabolism
Metabolism
05100: Bacterial invasion of epithelial cells
Human Diseases
Up-regulated in BTS
and down-regulated
in PTS
(2)
02010: ABC transporters Environmental Information
Processing
04742: Taste transduction
Organismal Systems
Down-regulated
in BTS and
up-regulated in PTS
(10)
00250: Alanine, aspartate and glutamate metabolism Metabolism
04110: Cell cycle Cellular Processes
00860: Porphyrin and chlorophyll metabolism Metabolism
00670: One carbon pool by folate Metabolism
05012: Parkinson's disease Human Diseases
00190: Oxidative phosphorylation Metabolism
03020: RNA polymerase
Genetic Information
Processing
00450: Selenocompound metabolism Metabolism
03030: DNA replication
Genetic Information
Processing
03022: Basal transcription factors Genetic Information
Processing
9 highly common pathways were identified, including only 1 up-regulated and 8 down-regulated pathways common to
the breast tumor and prostate tumor stromal. 2 pathways were up-regulated in breast tumor stromal and down-regulated
in prostate tumor stromal, but 10 pathways were down-regulated in breast tumor stromal and up-regulated in prostate
tumor stromal.](https://image.slidesharecdn.com/b0221b1e-684c-4fbf-bda6-0a21b50f2a8c-161105064720/85/3478-43782-3-PB-3-320.jpg)
![Oncotarget8690www.impactjournals.com/oncotarget
(ABC) transporters are a family of transporter proteins
that contribute to drug resistance via ATP-dependent
drug efflux pumps[35]. Recent studies suggested that
many ABC transporter superfamily members are highly
expressed in breast cancer, which could be molecular
target for the treatment of breast cancer [36]. The pathway
of ABC transporters in human prostate cancer has little
reported (shown in Figure 4).
Moreover, 10 pathways were down-regulated in
breast tumor stromal and up-regulated in prostate tumor
stromal, such as oxidative phosphorylation. Cancer is a
heterogeneous class of diseases, each of which has its own
metabolic characteristics, even if each of the tumor, which
includes different cell constituted a difference in the mode
of metabolism [37]. Owing to differences in tumor size,
hypoxia, and the sequence of oncogenes activated, some
studies illustrate a reduction of oxidative phosphorylation
(OXPHOS) capacity in different types of cancer cells,
other investigations revealed contradictory modifications
with the upregulation of OXPHOS components and a
larger dependency of cancer cells on oxidative energy
substrates for anabolism and energy production[38]. Our
research found that Oxidative phosphorylation is down-
regulated in breast tumor stromal and up-regulated in
prostate tumor stromal.
The stromal genome heterogeneity in the levels of
target gene and TFs
Our analysis revealed that 447 up-regulated
genes and 449 down-regulated genes were common
in the stromals of both tumor types, which were shown
in Figure 2C. For individual analysis, we obtained the
significant TFs in each dataset, which were summarized
in Supplementary File 3. Furthermore, our research also
found that some specific genes and transcriptional factors
were heterogeneously regulated in breast and prostate
tumor stromal, such as CDH3, EGFR, UCHL1 and CLDN.
The expression patterns of these target genes were shown
in Figure 5.
P-cadherin, a classical cadherin encoded by the
CDH3 gene [39], are engaged in various cellular activities
including motility, invasion, and signaling of tumor cells,
in addition to cell adhesion. Regarding other classic
cadherins, placental (P)-cadherin was first shown in mouse
placenta [40], in humans its expression is not identified in
placenta but is present in a few organs such as mammary
gland and prostate [41]. In breast cancer, P-cadherin is
Figure 1: Comparison of stromal related genes between DEGAand GSEAresults for breast tumor and prostate tumor.
(A) Venn diagram showing the overlapping significantly identified genes by the comparison of stromal related genes between DEGA and
GSEA results for breast cancer. By comparison, there were 84 common genes between DEGA and GSEA results for breast tumor stromal.
The significance of overlapping was p=2.95E-11. (B) Comparison of stromal related genes between DEGA and GSEA results for prostate
cancer. Venn diagram showing the overlapping significantly identified genes by the comparison of stromal related genes between DEGAand
GSEA results for prostate cancer. For prostate tumor, the common genes number was 17 with the overlapping significance of p=4.65E-02.](https://image.slidesharecdn.com/b0221b1e-684c-4fbf-bda6-0a21b50f2a8c-161105064720/85/3478-43782-3-PB-4-320.jpg)

![Oncotarget8693www.impactjournals.com/oncotarget
frequently overexpressed in high-grade tumours and is
extensively associated with tumour aggressiveness and
poor patient prognosis [42]. In prostate cancer, CDH3 is
an important cell-cell adhesion molecule and is a prostate
cancer susceptibility candidate gene [43]. Expression of
the CDH3 gene in the tumor cell compartment of prostate
and breast cancer samples and its increase with the degree
of tumor progression were accordant with its implication
in tumor development[44]. Surprisingly, whereas most
researches have reported its expression to be limited to the
tumor cell compartment, CDH3 gene was also identified to
expression in stromal compartments of invasive cancers in
our study. The expression of CDH3 gene was significantly
up-regulated both in breast tumor stromal (p= 4.69E-03)
and in prostate tumor stromal (p=2.66E-02) (Figure 5A).
Elucidation of the role of CDH3 in the tumor stromal will
be of interest. It is attractive to speculate, for example,
that CDH3-positive stromal cells reflect an active state that
may contribute to tumor aggressiveness.
It has been long established that the epidermal
growth factor receptor (EGFR) and the EGF-family
of peptide growth factor play an important role in the
pathogenesis and progression of different carcinoma types.
The proteins of EGF ligand/receptor system are found to be
frequently expressed in the majority of human carcinomas.
In this study, EGFR was identified to be heterogeneously
regulated in breast and prostate cancer. The expression of
EGFR was significantly down-regulated in breast tumor
stromal (p=2.70E-03), but remained the same level in
prostate tumor stromal compared to the normal stromal
(Figure 5B). The binding of EGF to EGFR leads to the
phosphorylation of EGFR, which then stimulates the
signaling pathways that promoting cell proliferation,
adhesion, and resistance to apoptosis. It has been showed
that EGFR signaling regulates angiogenesis both directly
and indirectly [45]. Tumor progression is a complex
process that involves the interaction of tumor cells with
surrounding stromal. Almost all types of cells in stromal
have the expression of EGFR. Therefore, when studying
the effect of EGFR signaling in cancer progression, it
is important that we take into consideration of EGFR
signaling not only in tumor cells but also in surrounding
stromal cell populations. This may accounts for some
failures in targeting EGFR signaling only in tumor cells
without considering the stromal EGFR regulation. Even in
tumors with EGFR-independent growth, EGFR signaling
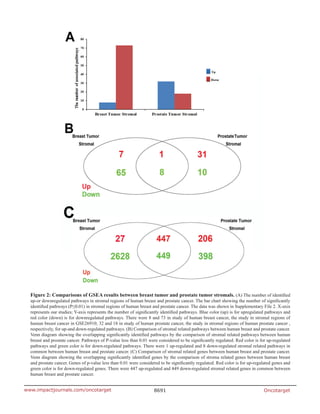
Figure 5: The expression patterns of some target genes for breast and prostate tumor stromals. (A) The expression of CDH3
gene was significantly up-regulated both in breast tumor stromal (BTS) (p=4.69E-03) and in prostate tumor stromal (PTS) (p=2.66E-02)
compared to the normal stromals (BNS or PNS). (B) The expression of EGFR was significantly down-regulated in breast tumor stromal
(BTS) (p=2.70E-03), but remained the same level in prostate tumor stromal (PTS) compared to the normal stromals (BNS or PNS). (C) The
expression patterns of UCHL1. The expression of UCHL1 was significantly up-regulated in breast tumor stromal (BTS) (p=2.21E-02), but
was significantly down-regulated in prostate tumor stromal (PTS) (p=3.51E-02) compared to the normal stromals (BNS or PNS). (D) The
expression patterns of CLDN5. In breast tumor stromal (BTS), the expression of CLDN5 was significantly down-regulated (p=8.91E-05),
but was significantly up-regulated in prostate tumor stromal (PTS) (p=3.65E-02) compared to the normal stromals (BNS or PNS).](https://image.slidesharecdn.com/b0221b1e-684c-4fbf-bda6-0a21b50f2a8c-161105064720/85/3478-43782-3-PB-7-320.jpg)
![Oncotarget8694www.impactjournals.com/oncotarget
in the tumor stromal may indirectly promote tumor
progression by mediating complex interactions between
tumor and stomal [46].
The critical roles played by protein ubiquitination in
various biological processes including cell proliferation,
cell cycle, apoptosis, signal transduction, while its
deregulation contributes to tumor initiation and
progression [47, 48]. Ubiquitin carboxyl- terminal esterase
L1 (UCHL1) is a member of a gene family whose products
transfer ubiquitin directly to protein substrates and release
ubiquitin from tandemly conjugated ubiquitin monomers
[49, 50]. Deregulation of UCHL1 has been observed in
solid tumors such as pancreatic cancer [51], non-small cell
lung cancer [52], colorectal cancer [53], osteosarcoma[54],
and oesophageal cancer [55]. Expression profiling data
from various tumor types demonstrated that UCHL1 is
either up- or downregulated owing to promoter hypo- or
hypermethylation depending on the type of malignant
tissue. In this research, UCHL1 was identified to be
heterogeneously regulated in breast and prostate tumor
stromal. The expression of UCHL1 was significantly up-
regulated in breast tumor stromal (p=2.21E-02), but was
significantly down-regulated in prostate tumor stromal
(p=3.51E-02) compared to the normal stromals (Figure
5C).
The claudin (CLDN) genes encode a family
of highly related proteins important in tight junction
formation and function. Recently, it has become obvious
that CLDN gene expression is frequently altered in various
cancers [56, 57]. Specifically, CLDN1,3,4,5,7,10,16
have been found altered in several human tumors
[56]. The first vascular-specific claudin identified was
CLDN5, also known as transmembrane protein deleted
in velocardiofacial syndrome (TMVCF) [58, 59]. Recent
research reported that CLDN5 was highly expressed
in vascular endothelial cells, suggesting a new target
for antiangiogenic therapy [60]. Our research indicates
that, depending on the type of neoplasia, CLDN5 may
be diminished, elevated or mislocated in tumor stromal
compared to normal stromal. In breast tumor stromal, the
expression of CLDN5 was significantly down-regulated
(p=8.91E-05), but was significantly up-regulated in
prostate tumor stromal (p=3.65E-02) compared to the
normal stromals (Figure 5D). Overall, a better knowledge
of claudin expression in normal and neoplastic tissues may
have applications in the detection, prognosis and therapy
of several human cancers.
METHODS
Microarray data collection and preprocessing
The gene expression profiling studies related to
stromal regions of human breast and prostate cancer were
searched in GEO (www.ncbi.nlm.nih.gov/geo/). Data sets
were reanalyzed if they met the following conditions:
(1) the data were genome-wide, (2) comparison was
conducted in the stromal regions between breast tumors
and prostate tumors, and (3) complete microarray raw
or normalized data were available. The data set of
GSE26910, contributed by Paolo Provero, was finally
chosen for our re-analysis [24]. In this data set, a total of
24 RNA samples were tested for RNA quality and each
of the 24 sample targets was hybridized to Affymetrix
Human Genome U133 Plus2.0 GeneChip arrays. There
were six biological replicates for prostate normal stromals
(GSM662756, GSM662758, GSM662760, GSM662762,
GSM662764, GSM662766, the group named as PNS), six
for prostate tumor stromals (GSM662757, GSM662759,
GSM662761, GSM662763, GSM662765, GSM662767,
the group named as PTS), six for breast normal stromals
(GSM662768, GSM662770, GSM662772, GSM662774,
GSM662776, GSM662778, the group named as BNS) and
six for breast tumor stromals (GSM662769, GSM662771,
GSM662773, GSM662775, GSM662777, GSM662779,
the group named as BTS).
For the purpose of evaluating the effect of
reprocessing on the comparison, the data were reprocessed
using software packages developed in version 2.6.0 of
Bioconductor and R version 2.10.1 [25]. Each Affymetrix
data set was background-adjusted and normalized and
log2 probe-set intensities were calculated using the
Robust Multichip Averaging (RMA) algorithm in the Affy
package [26].
Gene set enrichment analysis
Here, our gene set enrichment analysis was
performed on each study above to identify significantly
related pathways and genes to either stromal regions of
breast cancer or stromal regions of prostate cancer by
using Category package in Bioconductor ver. 2.6.0 [27].
GSEA is aimed at determining whether the members of
a gene set S are randomly spread throughout the entire
reference gene list L or are found primarily at the top
or bottom of L. One of the advantages of GSEA is the
relative robustness to noise and outliers in the data. In our
research, the gene sets showed by less than 10 genes were
excluded. The t-statistic mean of the genes was computed
in each KEGG (Kyoto Encyclopedia of Genes and
Genomes) pathway. Using a permutation test with 1,000
times, 0.01 was chosen as the significance level p values
of the cutoff for the most significant pathways related to
stromal tumor. Consequently, the significant pathways and
genes between tumor and normal were indicated in breast
or prostate. Subsequently, based on the datasets between
in breast cancer and in prostate cancer, the comparison of
GSEA results was performed to demonstrate the regulatory
mechanisms of gene expression by stromal regions of each
other. The following classification of identified pathways](https://image.slidesharecdn.com/b0221b1e-684c-4fbf-bda6-0a21b50f2a8c-161105064720/85/3478-43782-3-PB-8-320.jpg)
![Oncotarget8695www.impactjournals.com/oncotarget
was based on the KEGG pathway map br08901 of BRITE
Functional Hierarchies in the database of KEGG (http://
www.genome.jp/kegg-bin/get_htext?br08901.keg). The
annotation of significant genes in each pathway was
performed by using the biomaRt package (http://www.
biomart.org/) BioMart ver. 0.8 rc3 (version 0.8 of release
candidate 3). Next, for each significant pathway, through
hierarchical clustering with Euclidean distance, clustering
on groups or genes was performed based on the identified
genes’ expression.
Regulatory elements and transcription factors of
coregulated genes
A web server called DiRE (Distant Regulatory
Elements of coexpressed genes, http://dire.dcode.
org/) were also used, which is based on the Enhancer
Identification (EI) method, to predict common regulatory
elements (REs) for our input genes that have a cofunction
in each identified significantly related pathway[28]. It
predicts function-specific REs consisting of clusters
of specifically associated transcription factor binding
sites (TFBSs), and scores the association of individual
transcription factors (TFs) with the biological function
shared by the group of input genes. We selected a random
set of 5000 genes in the genome of homo sapiens as
the source of background genes. There were two major
parameters of our predicted TFs: (1) TF occurrence for the
percentage of candidate regulatory elements containing
a conserved binding site for a particular TF and (2) TF
importance for the product of TF occurrence and TF
weight. To be included in our candidate associated TFs
with input gene sets, the value of TF importance should
be more than 0.05.
Acknowledgements
We acknowledge financial support by The Natural
Science Foundation of Anhui Province of China
(1508085QC63, 1508085MH189), and Scientific Research
Foundation and Academic & Technology Leaders
Introduction Project, and “211” Scientific Research
Startup Fund of Anhui University (10117700023,
02303203-32030081), and The Student Research Training
Program of Anhui University (J18520131), as well as The
Education Revitalization Project of Anhui Province: Stem
Cell and Translational Medicine (Y05201374).
Conflicts of Interest Statement
The authors of this manuscript have no conflict of
interest to declare.
References
1. Marjanovic ND, Weinberg RA and Chaffer CL. Cell
plasticity and heterogeneity in cancer. Clinical chemistry.
2013; 59(1):168-179.
2. Risbridger GP, Davis ID, Birrell SN and Tilley WD. Breast
and prostate cancer: more similar than different. Nature
reviews Cancer. 2010; 10(3):205-212.
3. Yan B, Chen G, Saigal K, Yang X, Jensen ST, Van Waes
C, Stoeckert CJ and Chen Z. Systems biology-defined NF-
kappaB regulons, interacting signal pathways and networks
are implicated in the malignant phenotype of head and neck
cancer cell lines differing in p53 status. Genome biology.
2008; 9(3):R53.
4. Burrell RA, McGranahan N, Bartek J and Swanton C. The
causes and consequences of genetic heterogeneity in cancer
evolution. Nature. 2013; 501(7467):338-345.
5. Marte B. Tumour heterogeneity. Nature. 2013;
501(7467):327.
6. Cheng L, Bostwick DG, Li G, Wang Q, Hu N, Vortmeyer
AO and Zhuang Z. Allelic imbalance in the clonal evolution
of prostate carcinoma. Cancer. 1999; 85(9):2017-2022.
7. Robbins CM, Tembe WA, Baker A, Sinari S, Moses TY,
Beckstrom-Sternberg S, Beckstrom-Sternberg J, Barrett
M, Long J, Chinnaiyan A, Lowey J, Suh E, Pearson JV,
Craig DW, Agus DB, Pienta KJ, et al. Copy number and
targeted mutational analysis reveals novel somatic events
in metastatic prostate tumors. Genome research. 2011;
21(1):47-55.
8. Kuukasjarvi T, Karhu R, Tanner M, Kahkonen M, Schaffer
A, Nupponen N, Pennanen S, Kallioniemi A, Kallioniemi
OP and Isola J. Genetic heterogeneity and clonal evolution
underlying development of asynchronous metastasis in
human breast cancer. Cancer research. 1997; 57(8):1597-
1604.
9. Torres L, Ribeiro FR, Pandis N, Andersen JA, Heim S and
Teixeira MR. Intratumor genomic heterogeneity in breast
cancer with clonal divergence between primary carcinomas
and lymph node metastases. Breast cancer research and
treatment. 2007; 102(2):143-155.
10. Shah SP, Morin RD, Khattra J, Prentice L, Pugh T,
Burleigh A, Delaney A, Gelmon K, Guliany R and Senz J.
Mutational evolution in a lobular breast tumour profiled at
single nucleotide resolution. Nature. 2009; 461(7265):809-
813.
11. Vong S and Kalluri R. The role of stromal myofibroblast
and extracellular matrix in tumor angiogenesis. Genes &
cancer. 2011; 2(12):1139-1145.
12. Hanahan D and Weinberg RA. Hallmarks of cancer: the
next generation. Cell. 2011; 144(5):646-674.
13. Sung SY, Hsieh CL, Wu D, Chung LW and Johnstone PA.
Tumor microenvironment promotes cancer progression,
metastasis, and therapeutic resistance. Current problems in
cancer. 2007; 31(2):36-100.](https://image.slidesharecdn.com/b0221b1e-684c-4fbf-bda6-0a21b50f2a8c-161105064720/85/3478-43782-3-PB-9-320.jpg)