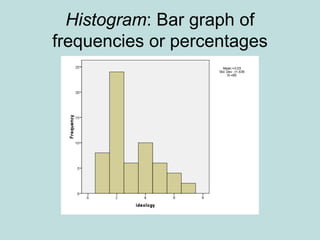
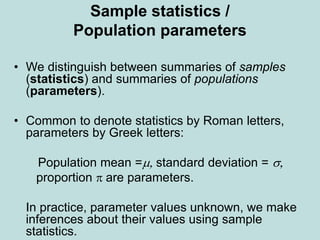
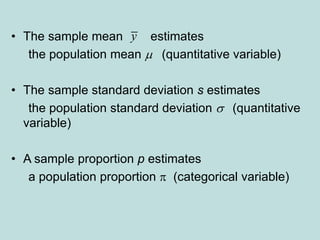
Exploratory Data Analysis for Biotechnology and Pharmaceutical SciencesParag Shah
This presentation will give perfect understanding of data, data types, level of measurements, exploratory data analysis and more importantly, when to use which type of summary statistics and graphs
Exploratory Data Analysis for Biotechnology and Pharmaceutical SciencesParag Shah
This presentation will give perfect understanding of data, data types, level of measurements, exploratory data analysis and more importantly, when to use which type of summary statistics and graphs
Exploring Abhay Bhutada’s Views After Poonawalla Fincorp’s Collaboration With...beulahfernandes8
The financial landscape in India has witnessed a significant development with the recent collaboration between Poonawalla Fincorp and IndusInd Bank.
The launch of the co-branded credit card, the IndusInd Bank Poonawalla Fincorp eLITE RuPay Platinum Credit Card, marks a major milestone for both entities.
This strategic move aims to redefine and elevate the banking experience for customers.
when will pi network coin be available on crypto exchange.DOT TECH
There is no set date for when Pi coins will enter the market.
However, the developers are working hard to get them released as soon as possible.
Once they are available, users will be able to exchange other cryptocurrencies for Pi coins on designated exchanges.
But for now the only way to sell your pi coins is through verified pi vendor.
Here is the telegram contact of my personal pi vendor
@Pi_vendor_247
Empowering the Unbanked: The Vital Role of NBFCs in Promoting Financial Inclu...Vighnesh Shashtri
In India, financial inclusion remains a critical challenge, with a significant portion of the population still unbanked. Non-Banking Financial Companies (NBFCs) have emerged as key players in bridging this gap by providing financial services to those often overlooked by traditional banking institutions. This article delves into how NBFCs are fostering financial inclusion and empowering the unbanked.
USDA Loans in California: A Comprehensive Overview.pptxmarketing367770
USDA Loans in California: A Comprehensive Overview
If you're dreaming of owning a home in California's rural or suburban areas, a USDA loan might be the perfect solution. The U.S. Department of Agriculture (USDA) offers these loans to help low-to-moderate-income individuals and families achieve homeownership.
Key Features of USDA Loans:
Zero Down Payment: USDA loans require no down payment, making homeownership more accessible.
Competitive Interest Rates: These loans often come with lower interest rates compared to conventional loans.
Flexible Credit Requirements: USDA loans have more lenient credit score requirements, helping those with less-than-perfect credit.
Guaranteed Loan Program: The USDA guarantees a portion of the loan, reducing risk for lenders and expanding borrowing options.
Eligibility Criteria:
Location: The property must be located in a USDA-designated rural or suburban area. Many areas in California qualify.
Income Limits: Applicants must meet income guidelines, which vary by region and household size.
Primary Residence: The home must be used as the borrower's primary residence.
Application Process:
Find a USDA-Approved Lender: Not all lenders offer USDA loans, so it's essential to choose one approved by the USDA.
Pre-Qualification: Determine your eligibility and the amount you can borrow.
Property Search: Look for properties in eligible rural or suburban areas.
Loan Application: Submit your application, including financial and personal information.
Processing and Approval: The lender and USDA will review your application. If approved, you can proceed to closing.
USDA loans are an excellent option for those looking to buy a home in California's rural and suburban areas. With no down payment and flexible requirements, these loans make homeownership more attainable for many families. Explore your eligibility today and take the first step toward owning your dream home.
The Evolution of Non-Banking Financial Companies (NBFCs) in India: Challenges...beulahfernandes8
Role in Financial System
NBFCs are critical in bridging the financial inclusion gap.
They provide specialized financial services that cater to segments often neglected by traditional banks.
Economic Impact
NBFCs contribute significantly to India's GDP.
They support sectors like micro, small, and medium enterprises (MSMEs), housing finance, and personal loans.
Currently pi network is not tradable on binance or any other exchange because we are still in the enclosed mainnet.
Right now the only way to sell pi coins is by trading with a verified merchant.
What is a pi merchant?
A pi merchant is someone verified by pi network team and allowed to barter pi coins for goods and services.
Since pi network is not doing any pre-sale The only way exchanges like binance/huobi or crypto whales can get pi is by buying from miners. And a merchant stands in between the exchanges and the miners.
I will leave the telegram contact of my personal pi merchant. I and my friends has traded more than 6000pi coins successfully
Tele-gram
@Pi_vendor_247
Poonawalla Fincorp and IndusInd Bank Introduce New Co-Branded Credit Cardnickysharmasucks
The unveiling of the IndusInd Bank Poonawalla Fincorp eLITE RuPay Platinum Credit Card marks a notable milestone in the Indian financial landscape, showcasing a successful partnership between two leading institutions, Poonawalla Fincorp and IndusInd Bank. This co-branded credit card not only offers users a plethora of benefits but also reflects a commitment to innovation and adaptation. With a focus on providing value-driven and customer-centric solutions, this launch represents more than just a new product—it signifies a step towards redefining the banking experience for millions. Promising convenience, rewards, and a touch of luxury in everyday financial transactions, this collaboration aims to cater to the evolving needs of customers and set new standards in the industry.
What price will pi network be listed on exchangesDOT TECH
The rate at which pi will be listed is practically unknown. But due to speculations surrounding it the predicted rate is tends to be from 30$ — 50$.
So if you are interested in selling your pi network coins at a high rate tho. Or you can't wait till the mainnet launch in 2026. You can easily trade your pi coins with a merchant.
A merchant is someone who buys pi coins from miners and resell them to Investors looking forward to hold massive quantities till mainnet launch.
I will leave the telegram contact of my personal pi vendor to trade with.
@Pi_vendor_247
how to sell pi coins effectively (from 50 - 100k pi)DOT TECH
Anywhere in the world, including Africa, America, and Europe, you can sell Pi Network Coins online and receive cash through online payment options.
Pi has not yet been launched on any exchange because we are currently using the confined Mainnet. The planned launch date for Pi is June 28, 2026.
Reselling to investors who want to hold until the mainnet launch in 2026 is currently the sole way to sell.
Consequently, right now. All you need to do is select the right pi network provider.
Who is a pi merchant?
An individual who buys coins from miners on the pi network and resells them to investors hoping to hang onto them until the mainnet is launched is known as a pi merchant.
debuts.
I'll provide you the Telegram username
@Pi_vendor_247
What website can I sell pi coins securely.DOT TECH
Currently there are no website or exchange that allow buying or selling of pi coins..
But you can still easily sell pi coins, by reselling it to exchanges/crypto whales interested in holding thousands of pi coins before the mainnet launch.
Who is a pi merchant?
A pi merchant is someone who buys pi coins from miners and resell to these crypto whales and holders of pi..
This is because pi network is not doing any pre-sale. The only way exchanges can get pi is by buying from miners and pi merchants stands in between the miners and the exchanges.
How can I sell my pi coins?
Selling pi coins is really easy, but first you need to migrate to mainnet wallet before you can do that. I will leave the telegram contact of my personal pi merchant to trade with.
Tele-gram.
@Pi_vendor_247
If you are looking for a pi coin investor. Then look no further because I have the right one he is a pi vendor (he buy and resell to whales in China). I met him on a crypto conference and ever since I and my friends have sold more than 10k pi coins to him And he bought all and still want more. I will drop his telegram handle below just send him a message.
@Pi_vendor_247
US Economic Outlook - Being Decided - M Capital Group August 2021.pdfpchutichetpong
The U.S. economy is continuing its impressive recovery from the COVID-19 pandemic and not slowing down despite re-occurring bumps. The U.S. savings rate reached its highest ever recorded level at 34% in April 2020 and Americans seem ready to spend. The sectors that had been hurt the most by the pandemic specifically reduced consumer spending, like retail, leisure, hospitality, and travel, are now experiencing massive growth in revenue and job openings.
Could this growth lead to a “Roaring Twenties”? As quickly as the U.S. economy contracted, experiencing a 9.1% drop in economic output relative to the business cycle in Q2 2020, the largest in recorded history, it has rebounded beyond expectations. This surprising growth seems to be fueled by the U.S. government’s aggressive fiscal and monetary policies, and an increase in consumer spending as mobility restrictions are lifted. Unemployment rates between June 2020 and June 2021 decreased by 5.2%, while the demand for labor is increasing, coupled with increasing wages to incentivize Americans to rejoin the labor force. Schools and businesses are expected to fully reopen soon. In parallel, vaccination rates across the country and the world continue to rise, with full vaccination rates of 50% and 14.8% respectively.
However, it is not completely smooth sailing from here. According to M Capital Group, the main risks that threaten the continued growth of the U.S. economy are inflation, unsettled trade relations, and another wave of Covid-19 mutations that could shut down the world again. Have we learned from the past year of COVID-19 and adapted our economy accordingly?
“In order for the U.S. economy to continue growing, whether there is another wave or not, the U.S. needs to focus on diversifying supply chains, supporting business investment, and maintaining consumer spending,” says Grace Feeley, a research analyst at M Capital Group.
While the economic indicators are positive, the risks are coming closer to manifesting and threatening such growth. The new variants spreading throughout the world, Delta, Lambda, and Gamma, are vaccine-resistant and muddy the predictions made about the economy and health of the country. These variants bring back the feeling of uncertainty that has wreaked havoc not only on the stock market but the mindset of people around the world. MCG provides unique insight on how to mitigate these risks to possibly ensure a bright economic future.
how to swap pi coins to foreign currency withdrawable.DOT TECH
As of my last update, Pi is still in the testing phase and is not tradable on any exchanges.
However, Pi Network has announced plans to launch its Testnet and Mainnet in the future, which may include listing Pi on exchanges.
The current method for selling pi coins involves exchanging them with a pi vendor who purchases pi coins for investment reasons.
If you want to sell your pi coins, reach out to a pi vendor and sell them to anyone looking to sell pi coins from any country around the globe.
Below is the contact information for my personal pi vendor.
Telegram: @Pi_vendor_247
how to swap pi coins to foreign currency withdrawable.
3. Descriptive statistics.ppt
1. 3. Descriptive Statistics
• Describing data with tables and graphs
(quantitative or categorical variables)
• Numerical descriptions of center, variability,
position (quantitative variables)
• Bivariate descriptions (In practice, most
studies have several variables)
2. Frequency distribution: Lists possible values of
variable and number of times each occurs
Example: Student survey (n = 60)
www.stat.ufl.edu/~aa/social/data.html
“political ideology” measured as ordinal variable
with 1 = very liberal, …, 4 = moderate, …, 7 =
very conservative
1. Tables and Graphs
5. Shapes of histograms
(for quantitative variables)
• Bell-shaped (IQ, SAT, political ideology in all U.S. )
• Skewed right (annual income, no. times arrested)
• Skewed left (score on easy exam)
• Bimodal (polarized opinions)
Ex. GSS data on sex before marriage in Exercise 3.73:
always wrong, almost always wrong, wrong only
sometimes, not wrong at all
category counts 238, 79, 157, 409
7. 2.Numerical descriptions
Let y denote a quantitative variable, with
observations y1 , y2 , y3 , … , yn
a. Describing the center
Median: Middle measurement of ordered sample
Mean:
1 2 ... n i
y y y y
y
n n
8. Example: Annual per capita carbon dioxide emissions
(metric tons) for n = 8 largest nations in population
size
Bangladesh 0.3, Brazil 1.8, China 2.3, India 1.2,
Indonesia 1.4, Pakistan 0.7, Russia 9.9, U.S. 20.1
Ordered sample:
Median =
Mean =
y
9. Example: Annual per capita carbon dioxide emissions
(metric tons) for n = 8 largest nations in population
size
Bangladesh 0.3, Brazil 1.8, China 2.3, India 1.2,
Indonesia 1.4, Pakistan 0.7, Russia 9.9, U.S. 20.1
Ordered sample: 0.3, 0.7, 1.2, 1.4, 1.8, 2.3, 9.9, 20.1
Median =
Mean =
y
10. Example: Annual per capita carbon dioxide emissions
(metric tons) for n = 8 largest nations in population
size
Bangladesh 0.3, Brazil 1.8, China 2.3, India 1.2,
Indonesia 1.4, Pakistan 0.7, Russia 9.9, U.S. 20.1
Ordered sample: 0.3, 0.7, 1.2, 1.4, 1.8, 2.3, 9.9, 20.1
Median = (1.4 + 1.8)/2 = 1.6
Mean = (0.3 + 0.7 + 1.2 + … + 20.1)/8 = 4.7
y
11. Properties of mean and median
• For symmetric distributions, mean = median
• For skewed distributions, mean is drawn in
direction of longer tail, relative to median
• Mean valid for interval scales, median for
interval or ordinal scales
• Mean sensitive to “outliers” (median often
preferred for highly skewed distributions)
• When distribution symmetric or mildly skewed or
discrete with few values, mean preferred
because uses numerical values of observations
12. Examples:
• New York Yankees baseball team, 2006
mean salary = $7.0 million
median salary = $2.9 million
How possible? Direction of skew?
• Give an example for which you would expect
mean < median
13. b. Describing variability
Range: Difference between largest and smallest
observations
(but highly sensitive to outliers, insensitive to shape)
Standard deviation: A “typical” distance from the mean
The deviation of observation i from the mean is
i
y y
14. The variance of the n observations is
The standard deviation s is the square root of the variance,
2 2 2
2 1
( ) ( ) ... ( )
1 1
i n
y y y y y y
s
n n
2
s s
15. Example: Political ideology
• For those in the student sample who attend religious
services at least once a week (n = 9 of the 60),
• y = 2, 3, 7, 5, 6, 7, 5, 6, 4
2 2 2
2
5.0,
(2 5) (3 5) ... (4 5) 24
3.0
9 1 8
3.0 1.7
y
s
s
For entire sample (n = 60), mean = 3.0, standard deviation = 1.6,
tends to have similar variability but be more liberal
16. • Properties of the standard deviation:
• s 0, and only equals 0 if all observations are equal
• s increases with the amount of variation around the mean
• Division by n - 1 (not n) is due to technical reasons (later)
• s depends on the units of the data (e.g. measure euro vs $)
•Like mean, affected by outliers
•Empirical rule: If distribution is approx. bell-shaped,
about 68% of data within 1 standard dev. of mean
about 95% of data within 2 standard dev. of mean
all or nearly all data within 3 standard dev. of mean
17. Example: SAT with mean = 500, s = 100
(sketch picture summarizing data)
Example: y = number of close friends you have
GSS: The variable ‘frinum’ has mean 7.4, s = 11.0
Probably highly skewed: right or left?
Empirical rule fails; in fact, median = 5, mode=4
Example: y = selling price of home in Syracuse, NY.
If mean = $130,000, which is realistic?
s = 0, s = 1000, s = 50,000, s = 1,000,000
18. c. Measures of position
pth percentile: p percent of observations
below it, (100 - p)% above it.
p = 50: median
p = 25: lower quartile (LQ)
p = 75: upper quartile (UQ)
Interquartile range IQR = UQ - LQ
19. Quartiles portrayed graphically by box plots
(John Tukey)
Example: weekly TV watching for n=60 from
student survey data file, 3 outliers
20. Box plots have box from LQ to UQ, with
median marked. They portray a five-
number summary of the data:
Minimum, LQ, Median, UQ, Maximum
except for outliers identified separately
Outlier = observation falling
below LQ – 1.5(IQR)
or above UQ + 1.5(IQR)
Ex. If LQ = 2, UQ = 10, then IQR = 8 and
outliers above 10 + 1.5(8) = 22
21. 3. Bivariate description
• Usually we want to study associations between two or
more variables (e.g., how does number of close
friends depend on gender, income, education, age,
working status, rural/urban, religiosity…)
• Response variable: the outcome variable
• Explanatory variable(s): defines groups to compare
Ex.: number of close friends is a response variable,
while gender, income, … are explanatory variables
Response var. also called “dependent variable”
Explanatory var. also called “independent variable”
22. Summarizing associations:
• Categorical var’s: show data using contingency tables
• Quantitative var’s: show data using scatterplots
• Mixture of categorical var. and quantitative var. (e.g.,
number of close friends and gender) can give
numerical summaries (mean, standard deviation) or
side-by-side box plots for the groups
• Ex. General Social Survey (GSS) data
Men: mean = 7.0, s = 8.4
Women: mean = 5.9, s = 6.0
Shape? Inference questions for later chapters?
24. Contingency Tables
• Cross classifications of categorical variables in
which rows (typically) represent categories of
explanatory variable and columns represent
categories of response variable.
• Counts in “cells” of the table give the numbers of
individuals at the corresponding combination of
levels of the two variables
25. Happiness and Family Income
(GSS 2008 data: “happy,” “finrela”)
Happiness
Income Very Pretty Not too Total
-------------------------------
Above Aver. 164 233 26 423
Average 293 473 117 883
Below Aver. 132 383 172 687
------------------------------
Total 589 1089 315 1993
26. Can summarize by percentages on response
variable (happiness)
Example: Percentage “very happy” is
39% for above aver. income (164/423 = 0.39)
33% for average income (293/883 = 0.33)
19% for below average income (??)
27. Happiness
Income Very Pretty Not too Total
--------------------------------------------
Above 164 (39%) 233 (55%) 26 (6%) 423
Average 293 (33%) 473 (54%) 117 (13%) 883
Below 132 (19%) 383 (56%) 172 (25%) 687
----------------------------------------------
Inference questions for later chapters? (i.e., what can
we conclude about the corresponding population?)
28. Scatterplots (for quantitative variables)
plot response variable on vertical axis,
explanatory variable on horizontal axis
Example: Table 9.13 (p. 294) shows UN data for several
nations on many variables, including fertility (births per
woman), contraceptive use, literacy, female economic
activity, per capita gross domestic product (GDP), cell-
phone use, CO2 emissions
Data available at
http://www.stat.ufl.edu/~aa/social/data.html
29.
30. Example: Survey in Alachua County, Florida,
on predictors of mental health
(data for n = 40 on p. 327 of text and at
www.stat.ufl.edu/~aa/social/data.html)
y = measure of mental impairment (incorporates various
dimensions of psychiatric symptoms, including aspects of
depression and anxiety)
(min = 17, max = 41, mean = 27, s = 5)
x = life events score (events range from severe personal
disruptions such as death in family, extramarital affair, to
less severe events such as new job, birth of child, moving)
(min = 3, max = 97, mean = 44, s = 23)
31.
32. Bivariate data from 2000 Presidential election
Butterfly ballot, Palm Beach County, FL, text p.290
33. Example: The Massachusetts Lottery
(data for 37 communities)
Per capita income
% income
spent on
lottery
34. Correlation describes strength of
association
• Falls between -1 and +1, with sign indicating direction
of association (formula later in Chapter 9)
The larger the correlation in absolute value, the stronger
the association (in terms of a straight line trend)
Examples: (positive or negative, how strong?)
Mental impairment and life events, correlation =
GDP and fertility, correlation =
GDP and percent using Internet, correlation =
35. Correlation describes strength of
association
• Falls between -1 and +1, with sign indicating direction
of association
Examples: (positive or negative, how strong?)
Mental impairment and life events, correlation = 0.37
GDP and fertility, correlation = - 0.56
GDP and percent using Internet, correlation = 0.89
36.
37. Regression analysis gives line
predicting y using x
Example:
y = mental impairment, x = life events
Predicted y = 23.3 + 0.09x
e.g., at x = 0, predicted y =
at x = 100, predicted y =
38. Regression analysis gives line
predicting y using x
Example:
y = mental impairment, x = life events
Predicted y = 23.3 + 0.09x
e.g., at x = 0, predicted y = 23.3
at x = 100, predicted y = 23.3 + 0.09(100) = 32.3
Inference questions for later chapters?
(i.e., what can we conclude about the population?)
39. Example: student survey
y = college GPA, x = high school GPA
(data at www.stat.ufl.edu/~aa/social/data.html)
What is the correlation?
What is the estimated regression equation?
We’ll see later in course the formulas for finding
the correlation and the “best fitting” regression
equation (with possibly several explanatory
variables), but for now, try using software such
as SPSS to find the answers.
40. Sample statistics /
Population parameters
• We distinguish between summaries of samples
(statistics) and summaries of populations
(parameters).
• Common to denote statistics by Roman letters,
parameters by Greek letters:
Population mean =m, standard deviation = s,
proportion are parameters.
In practice, parameter values unknown, we make
inferences about their values using sample
statistics.
41. • The sample mean estimates
the population mean m (quantitative variable)
• The sample standard deviation s estimates
the population standard deviation s (quantitative
variable)
• A sample proportion p estimates
a population proportion (categorical variable)
y