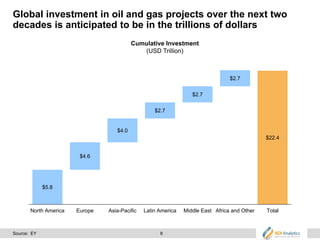
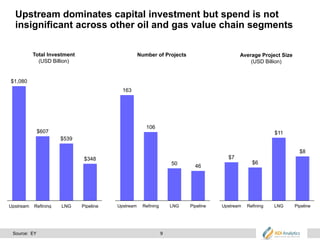
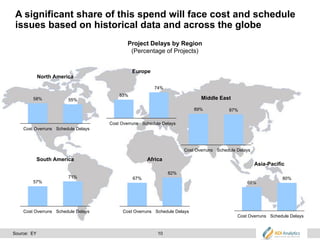
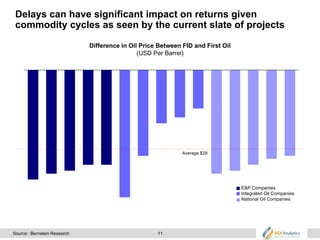
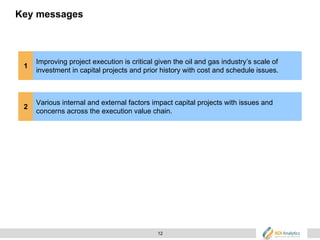
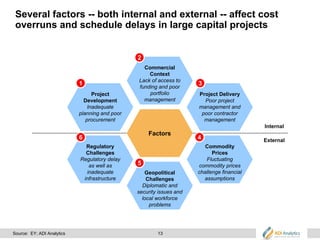
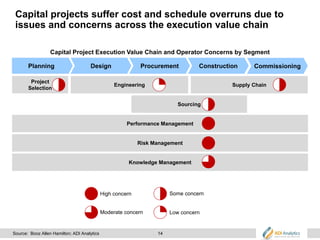
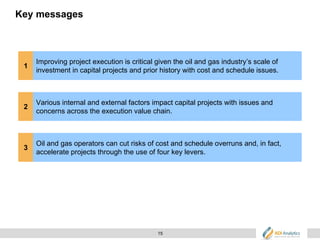
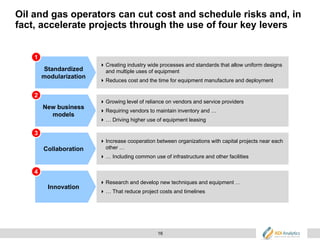
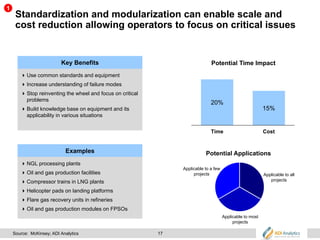
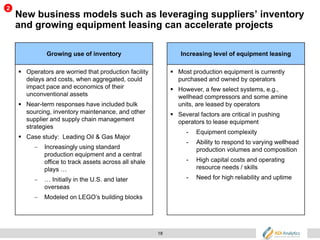
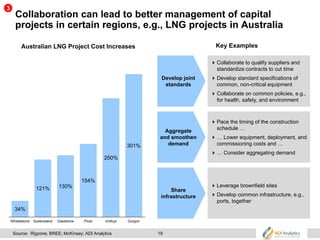
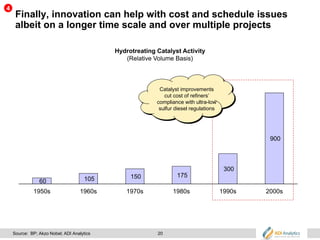
Driving Capital Projects to
Best-in-Class Execution
Energy Construction Forum
March 2015
This presentation contains information that is proprietary to ADI Analytics LLC. No part of it may be used,
circulated, quoted, or reproduced for distribution without written permission from ADI Analytics LLC.
2
Disclaimer
THIS DOCUMENT IS PROVIDED “AS IS”. WHILE ADI ANALYTICS LLC HAS USED ITS BEST
EFFORTS IN PREPARING THIS DOCUMENT, NEITHER ADI ANALYTICS LLC, THE AUTHORS, NOR
THEIR AFFILIATES AND REPRESENTATIVES MAKE ANY WARRANTY, EXPRESSED OR IMPLIED,
OR ASSUME ANY LEGAL LIABILITY OR RESPONSIBITLY FOR THE ACCURACY, COMPLETENESS,
OR USEFULNESS OF ANY CONTENT OF THIS DOCUMENT.
ADI ANALYTICS LLC AND ITS AFFILIATES AND REPRESENTATIVES ARE NOT RESPONSIBLE
FOR ANY DAMAGE, WHETHER PHYSICAL, ELECTRONIC, FINANCIAL, OR OTHERWISE THAT MAY
RESULT FROM THE USE OF THIS DOCUMENT AND ITS CONTENTS.
BY CHOOSING TO USE THE CONTENTS OF THIS DOCUMENT, YOU DO SO AT YOUR OWN RISK.
REFERENCE HEREIN TO ANY SPECIFIC COMMERCIAL PRODUCT, PROCESS, OR SERVICE BY
TRADE NAME, TRADEMARK, MANUFACTURER, OR OTHERWISE DOES NOT CONSTITUTE OR
IMPLY ITS ENDORSEMENT, RECOMMENDATION, OR FAVORING BY ADI ANALYTICS LLC, THE
AUTHORS, OR THEIR AFFILIATES AND REPRESENTATIVES.
THIS DOCUMENT AND ITS CONTENTS SHOULD NOT BE REPRODUCED, DISCLOSED, OR
DISTRIBUTED – IN PART OR ITS ENTIRETY – WITHOUT THE EXPRESS PRIOR WRITTEN
CONSENT OF ADI ANALYTICS LLC.
3
Outline
 About ADI Analytics
 Driving Capital Projects to Best-in-Class Execution
4
ADI Analytics is a boutique consulting firm serving energy
and chemical companies with passion, rigor, and expertise
OperationsMarkets FunctionsTechnology
Oil &
Gas
ProductionExploration Refining Distribution
Renewables &
Cleantech
GeothermalBiomass WindSolar
Chemical &
Industrial
Plastics Materials ManufacturingAuto
Power &
Mining
Coal Generation CarbonTransmission
5
Fortune 500 and mid-sized companies, start-ups, investors,
and governments have hired us to shape decisions globally
6
Outline
 About ADI Analytics
 Driving Capital Projects to Best-in-Class Execution
7
Key messages
1
Improving project execution is critical given the oil and gas industry’s scale of
investment in capital projects and prior history with cost and schedule issues.
8
Global investment in oil and gas projects over the next two
decades is anticipated to be in the trillions of dollars
Cumulative Investment
(USD Trillion)
$5.8
$4.6
$4.0
$2.7
$2.7
$2.7
$22.4
North America Europe Asia-Pacific Latin America Middle East Africa and Other Total
Source: EY
9
Upstream dominates capital investment but spend is not
insignificant across other oil and gas value chain segments
$1,080
$607
$539
$348
Upstream Refining LNG Pipeline
163
106
50 46
Upstream Refining LNG Pipeline
$7
$6
$11
$8
Upstream Refining LNG Pipeline
Total Investment
(USD Billion)
Average Project Size
(USD Billion)
Number of Projects
Source: EY
10
A significant share of this spend will face cost and schedule
issues based on historical data and across the globe
58% 55%
Cost Overruns Schedule Delays
North America
57%
71%
Cost Overruns Schedule Delays
South America
67%
82%
Cost Overruns Schedule Delays
Africa
68%
80%
Cost Overruns Schedule Delays
Asia-Pacific
53%
74%
Cost Overruns Schedule Delays
Europe
89% 87%
Cost Overruns Schedule Delays
Middle East
Project Delays by Region
(Percentage of Projects)
Source: EY
11
Delays can have significant impact on returns given
commodity cycles as seen by the current slate of projects
Difference in Oil Price Between FID and First Oil
(USD Per Barrel)
E&P Companies
Integrated Oil Companies
National Oil Companies
Average $29
Source: Bernstein Research
12
Key messages
1
Improving project execution is critical given the oil and gas industry’s scale of
investment in capital projects and prior history with cost and schedule issues.
2
Various internal and external factors impact capital projects with issues and
concerns across the execution value chain.
13
Several factors -- both internal and external -- affect cost
overruns and schedule delays in large capital projects
Factors
Commercial
Context
Lack of access to
funding and poor
portfolio
management
Geopolitical
Challenges
Diplomatic and
security issues and
local workforce
problems
Project
Development
Inadequate
planning and poor
procurement
Regulatory
Challenges
Regulatory delay
as well as
inadequate
infrastructure
Project Delivery
Poor project
management and
poor contractor
management
Commodity
Prices
Fluctuating
commodity prices
challenge financial
assumptions
1 3
2
5
46
Internal
External
Source: EY; ADI Analytics
14
Capital projects suffer cost and schedule overruns due to
issues and concerns across the execution value chain
Performance Management
Capital Project Execution Value Chain and Operator Concerns by Segment
DesignPlanning Procurement Construction Commissioning
Risk Management
Knowledge Management
Project
Selection
Engineering Supply Chain
Sourcing
High concern
Low concern
Some concern
Moderate concern
Source: Booz Allen Hamilton; ADI Analytics
15
Key messages
1
Improving project execution is critical given the oil and gas industry’s scale of
investment in capital projects and prior history with cost and schedule issues.
2
Various internal and external factors impact capital projects with issues and
concerns across the execution value chain.
3
Oil and gas operators can cut risks of cost and schedule overruns and, in fact,
accelerate projects through the use of four key levers.
16
Oil and gas operators can cut cost and schedule risks and, in
fact, accelerate projects through the use of four key levers
Standardized
modularization
Creating industry wide processes and standards that allow uniform designs
and multiple uses of equipment
Reduces cost and the time for equipment manufacture and deployment
New business
models
Growing level of reliance on vendors and service providers
Requiring vendors to maintain inventory and …
… Driving higher use of equipment leasing
Collaboration
Increase cooperation between organizations with capital projects near each
other …
… Including common use of infrastructure and other facilities
Innovation
Research and develop new techniques and equipment …
… That reduce project costs and timelines
1
3
2
4
17
Standardization and modularization can enable scale and
cost reduction allowing operators to focus on critical issues
20%
15%
Time Cost
Potential Time Impact
Potential Applications
Key Benefits
Use common standards and equipment
Increase understanding of failure modes
Stop reinventing the wheel and focus on critical
problems
Build knowledge base on equipment and its
applicability in various situations
Examples
NGL processing plants
Oil and gas production facilities
Compressor trains in LNG plants
Helicopter pads on landing platforms
Flare gas recovery units in refineries
Oil and gas production modules on FPSOs
Applicable to all
projects
Applicable to most
projects
Applicable to a few
projects
Source: McKinsey; ADI Analytics
1
18
New business models such as leveraging suppliers’ inventory
and growing equipment leasing can accelerate projects
Growing use of inventory
 Operators are worried that production facility
delays and costs, when aggregated, could
impact pace and economics of their
unconventional assets
 Near-term responses have included bulk
sourcing, inventory maintenance, and other
supplier and supply chain management
strategies
 Case study: Leading Oil & Gas Major
 Increasingly using standard
production equipment and a central
office to track assets across all shale
plays …
 … Initially in the U.S. and later
overseas
 Modeled on LEGO’s building blocks
Increasing level of equipment leasing
 Most production equipment is currently
purchased and owned by operators
 However, a few select systems, e.g.,
wellhead compressors and some amine
units, are leased by operators
 Several factors are critical in pushing
operators to lease equipment
- Equipment complexity
- Ability to respond to varying wellhead
production volumes and composition
- High capital costs and operating
resource needs / skills
- Need for high reliability and uptime
2
19
Collaboration can lead to better management of capital
projects in certain regions, e.g., LNG projects in Australia
34%
121% 130%
154%
250%
301%
Wheatstone Queensland Gladstone Pluto Ichthys Gorgon
Australian LNG Project Cost Increases
Share
infrastructure
Leverage brownfield sites
Develop common infrastructure, e.g.,
ports, together
Develop joint
standards
Collaborate to qualify suppliers and
standardize contracts to cut time
Develop standard specifications of
common, non-critical equipment
Collaborate on common policies, e.g.,
for health, safety, and environment
Aggregate
and smoothen
demand
Pace the timing of the construction
schedule …
… Lower equipment, deployment, and
commissioning costs and …
… Consider aggregating demand
Source: Rigzone, BREE; McKinsey; ADI Analytics
3
Key Examples
20
Finally, innovation can help with cost and schedule issues
albeit on a longer time scale and over multiple projects
60 105 150 175
300
900
1950s 1960s 1970s 1980s 1990s 2000s
Hydrotreating Catalyst Activity
(Relative Volume Basis)
Catalyst improvements
cut cost of refiners’
compliance with ultra-low
sulfur diesel regulations
Source: BP; Akzo Nobel; ADI Analytics
4
21
Key messages
1
Improving project execution is critical given the oil and gas industry’s scale of
investment in capital projects and prior history with cost and schedule issues.
2
Various internal and external factors impact capital projects with issues and
concerns across the execution value chain.
3
Oil and gas operators can cut risks of cost and schedule overruns and, in fact,
accelerate projects through the use of four key levers.
Copyright © 2009-2015 ADI Analytics LLC.
14511 Old Katy Road
Suite 374
Houston, Texas 77079
+1.832.768.8806
info@adi-analytics.com
www.adi-analytics.com

Contractor Track: Need for Speed - Project Acceleration, Tech Trends, Logistics - PART 2

  • 1.
    Driving Capital Projectsto Best-in-Class Execution Energy Construction Forum March 2015 This presentation contains information that is proprietary to ADI Analytics LLC. No part of it may be used, circulated, quoted, or reproduced for distribution without written permission from ADI Analytics LLC.
  • 2.
    2 Disclaimer THIS DOCUMENT ISPROVIDED “AS IS”. WHILE ADI ANALYTICS LLC HAS USED ITS BEST EFFORTS IN PREPARING THIS DOCUMENT, NEITHER ADI ANALYTICS LLC, THE AUTHORS, NOR THEIR AFFILIATES AND REPRESENTATIVES MAKE ANY WARRANTY, EXPRESSED OR IMPLIED, OR ASSUME ANY LEGAL LIABILITY OR RESPONSIBITLY FOR THE ACCURACY, COMPLETENESS, OR USEFULNESS OF ANY CONTENT OF THIS DOCUMENT. ADI ANALYTICS LLC AND ITS AFFILIATES AND REPRESENTATIVES ARE NOT RESPONSIBLE FOR ANY DAMAGE, WHETHER PHYSICAL, ELECTRONIC, FINANCIAL, OR OTHERWISE THAT MAY RESULT FROM THE USE OF THIS DOCUMENT AND ITS CONTENTS. BY CHOOSING TO USE THE CONTENTS OF THIS DOCUMENT, YOU DO SO AT YOUR OWN RISK. REFERENCE HEREIN TO ANY SPECIFIC COMMERCIAL PRODUCT, PROCESS, OR SERVICE BY TRADE NAME, TRADEMARK, MANUFACTURER, OR OTHERWISE DOES NOT CONSTITUTE OR IMPLY ITS ENDORSEMENT, RECOMMENDATION, OR FAVORING BY ADI ANALYTICS LLC, THE AUTHORS, OR THEIR AFFILIATES AND REPRESENTATIVES. THIS DOCUMENT AND ITS CONTENTS SHOULD NOT BE REPRODUCED, DISCLOSED, OR DISTRIBUTED – IN PART OR ITS ENTIRETY – WITHOUT THE EXPRESS PRIOR WRITTEN CONSENT OF ADI ANALYTICS LLC.
  • 3.
    3 Outline  About ADIAnalytics  Driving Capital Projects to Best-in-Class Execution
  • 4.
    4 ADI Analytics isa boutique consulting firm serving energy and chemical companies with passion, rigor, and expertise OperationsMarkets FunctionsTechnology Oil & Gas ProductionExploration Refining Distribution Renewables & Cleantech GeothermalBiomass WindSolar Chemical & Industrial Plastics Materials ManufacturingAuto Power & Mining Coal Generation CarbonTransmission
  • 5.
    5 Fortune 500 andmid-sized companies, start-ups, investors, and governments have hired us to shape decisions globally
  • 6.
    6 Outline  About ADIAnalytics  Driving Capital Projects to Best-in-Class Execution
  • 7.
    7 Key messages 1 Improving projectexecution is critical given the oil and gas industry’s scale of investment in capital projects and prior history with cost and schedule issues.
  • 8.
    8 Global investment inoil and gas projects over the next two decades is anticipated to be in the trillions of dollars Cumulative Investment (USD Trillion) $5.8 $4.6 $4.0 $2.7 $2.7 $2.7 $22.4 North America Europe Asia-Pacific Latin America Middle East Africa and Other Total Source: EY
  • 9.
    9 Upstream dominates capitalinvestment but spend is not insignificant across other oil and gas value chain segments $1,080 $607 $539 $348 Upstream Refining LNG Pipeline 163 106 50 46 Upstream Refining LNG Pipeline $7 $6 $11 $8 Upstream Refining LNG Pipeline Total Investment (USD Billion) Average Project Size (USD Billion) Number of Projects Source: EY
  • 10.
    10 A significant shareof this spend will face cost and schedule issues based on historical data and across the globe 58% 55% Cost Overruns Schedule Delays North America 57% 71% Cost Overruns Schedule Delays South America 67% 82% Cost Overruns Schedule Delays Africa 68% 80% Cost Overruns Schedule Delays Asia-Pacific 53% 74% Cost Overruns Schedule Delays Europe 89% 87% Cost Overruns Schedule Delays Middle East Project Delays by Region (Percentage of Projects) Source: EY
  • 11.
    11 Delays can havesignificant impact on returns given commodity cycles as seen by the current slate of projects Difference in Oil Price Between FID and First Oil (USD Per Barrel) E&P Companies Integrated Oil Companies National Oil Companies Average $29 Source: Bernstein Research
  • 12.
    12 Key messages 1 Improving projectexecution is critical given the oil and gas industry’s scale of investment in capital projects and prior history with cost and schedule issues. 2 Various internal and external factors impact capital projects with issues and concerns across the execution value chain.
  • 13.
    13 Several factors --both internal and external -- affect cost overruns and schedule delays in large capital projects Factors Commercial Context Lack of access to funding and poor portfolio management Geopolitical Challenges Diplomatic and security issues and local workforce problems Project Development Inadequate planning and poor procurement Regulatory Challenges Regulatory delay as well as inadequate infrastructure Project Delivery Poor project management and poor contractor management Commodity Prices Fluctuating commodity prices challenge financial assumptions 1 3 2 5 46 Internal External Source: EY; ADI Analytics
  • 14.
    14 Capital projects suffercost and schedule overruns due to issues and concerns across the execution value chain Performance Management Capital Project Execution Value Chain and Operator Concerns by Segment DesignPlanning Procurement Construction Commissioning Risk Management Knowledge Management Project Selection Engineering Supply Chain Sourcing High concern Low concern Some concern Moderate concern Source: Booz Allen Hamilton; ADI Analytics
  • 15.
    15 Key messages 1 Improving projectexecution is critical given the oil and gas industry’s scale of investment in capital projects and prior history with cost and schedule issues. 2 Various internal and external factors impact capital projects with issues and concerns across the execution value chain. 3 Oil and gas operators can cut risks of cost and schedule overruns and, in fact, accelerate projects through the use of four key levers.
  • 16.
    16 Oil and gasoperators can cut cost and schedule risks and, in fact, accelerate projects through the use of four key levers Standardized modularization Creating industry wide processes and standards that allow uniform designs and multiple uses of equipment Reduces cost and the time for equipment manufacture and deployment New business models Growing level of reliance on vendors and service providers Requiring vendors to maintain inventory and … … Driving higher use of equipment leasing Collaboration Increase cooperation between organizations with capital projects near each other … … Including common use of infrastructure and other facilities Innovation Research and develop new techniques and equipment … … That reduce project costs and timelines 1 3 2 4
  • 17.
    17 Standardization and modularizationcan enable scale and cost reduction allowing operators to focus on critical issues 20% 15% Time Cost Potential Time Impact Potential Applications Key Benefits Use common standards and equipment Increase understanding of failure modes Stop reinventing the wheel and focus on critical problems Build knowledge base on equipment and its applicability in various situations Examples NGL processing plants Oil and gas production facilities Compressor trains in LNG plants Helicopter pads on landing platforms Flare gas recovery units in refineries Oil and gas production modules on FPSOs Applicable to all projects Applicable to most projects Applicable to a few projects Source: McKinsey; ADI Analytics 1
  • 18.
    18 New business modelssuch as leveraging suppliers’ inventory and growing equipment leasing can accelerate projects Growing use of inventory  Operators are worried that production facility delays and costs, when aggregated, could impact pace and economics of their unconventional assets  Near-term responses have included bulk sourcing, inventory maintenance, and other supplier and supply chain management strategies  Case study: Leading Oil & Gas Major  Increasingly using standard production equipment and a central office to track assets across all shale plays …  … Initially in the U.S. and later overseas  Modeled on LEGO’s building blocks Increasing level of equipment leasing  Most production equipment is currently purchased and owned by operators  However, a few select systems, e.g., wellhead compressors and some amine units, are leased by operators  Several factors are critical in pushing operators to lease equipment - Equipment complexity - Ability to respond to varying wellhead production volumes and composition - High capital costs and operating resource needs / skills - Need for high reliability and uptime 2
  • 19.
    19 Collaboration can leadto better management of capital projects in certain regions, e.g., LNG projects in Australia 34% 121% 130% 154% 250% 301% Wheatstone Queensland Gladstone Pluto Ichthys Gorgon Australian LNG Project Cost Increases Share infrastructure Leverage brownfield sites Develop common infrastructure, e.g., ports, together Develop joint standards Collaborate to qualify suppliers and standardize contracts to cut time Develop standard specifications of common, non-critical equipment Collaborate on common policies, e.g., for health, safety, and environment Aggregate and smoothen demand Pace the timing of the construction schedule … … Lower equipment, deployment, and commissioning costs and … … Consider aggregating demand Source: Rigzone, BREE; McKinsey; ADI Analytics 3 Key Examples
  • 20.
    20 Finally, innovation canhelp with cost and schedule issues albeit on a longer time scale and over multiple projects 60 105 150 175 300 900 1950s 1960s 1970s 1980s 1990s 2000s Hydrotreating Catalyst Activity (Relative Volume Basis) Catalyst improvements cut cost of refiners’ compliance with ultra-low sulfur diesel regulations Source: BP; Akzo Nobel; ADI Analytics 4
  • 21.
    21 Key messages 1 Improving projectexecution is critical given the oil and gas industry’s scale of investment in capital projects and prior history with cost and schedule issues. 2 Various internal and external factors impact capital projects with issues and concerns across the execution value chain. 3 Oil and gas operators can cut risks of cost and schedule overruns and, in fact, accelerate projects through the use of four key levers.
  • 22.
    Copyright © 2009-2015ADI Analytics LLC. 14511 Old Katy Road Suite 374 Houston, Texas 77079 +1.832.768.8806 info@adi-analytics.com www.adi-analytics.com