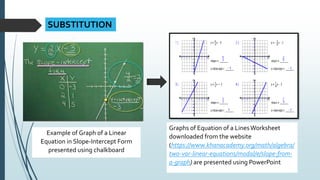
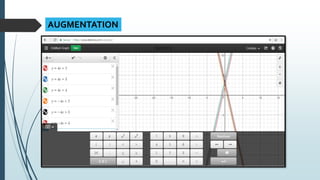
SAMR MODEL
LESSON PLAN
LessonTitle: Graphing Equation of a Line:
Slope-Intercept Form
Grade: Grade 8
Lesson Length: 90 minutes
Learning Styles
Students comes from a variety of economic and social backgrounds and
their learning styles vary from: auditory, visual, tactile and kinesthetic.
However, some students have difficulty maintaining focus during class. In
order to overcome this issue, lesson must accommodate the students’
attention span and also to facilitate their individualized preferred needs.
Entry Skills
Students already knows the basic concepts of slope and intercepts of a
line; however they cannot carry out the task in graphing an equation of a
line in slope-intercept form.
LEARNERS CHARACTERISTICS
STATE OBJECTIVES
At the end of the lesson, students should be able to:
• Demonstrate understanding on slope-intercept form of the
equation of a line
• Restrict, reposition, and rotate lines with the slope-intercept
form using the Desmos Graphing Calculator and Marbleslides:
Lines
• Develop accuracy and teamwork in making tutorial video
about graphing linear equations in slope-intercept form
The teacher will ask the students about what they know in
equation of a line, the slopes and y-intercepts to assess their
knowledge and understanding on it. Considering that they
already learned what integer is all about, the teacher will now
introduce slope-intercept form of a line.
SUBSTITUTION
Example of Graph of a Linear
Equation in Slope-Intercept Form
presented using chalkboard
Graphs of Equation of a LinesWorksheet
downloaded from the website
(https://www.khanacademy.org/math/algebra/
two-var-linear-equations/modal/e/slope-from-
a-graph) are presented using PowerPoint
A motivational activity will be initiated by the teacher which
deals in identifying the slope and y-intercept of a line. The teacher
will flash examples of graphs of lines using the PPT then the
students should tell the slope and y-intercept of each lines as
shown on each graph.
AUGMENTATION
The teacher will direct students to access the website—Desmos Lab in
which they will be using Desmos—a free online graphing calculator that
allows learners to manipulate linear equations and represent them visually.
The teacher will be providing a worksheet indicating series of linear
equations, then students will be working in pairs and will now use this
online graphing calculator to graph equations of lines in slope-intercept
form. They will have to enter 8 equations on the slides and the graph of
each line be automatically shown.
AUGMENTATION
MODIFICATION
The students will be involved in the online game “Marbleslides: Lines” from
the website --https://teacher.desmos.com/marbleslides-lines developed by the
team of educators at the Desmos. This interactive activity asks students to
manipulate a series of linear equations in order to collect the 4 stars on a given
page. Once students have completed collecting the four stars they can then
move on to the next slide. To start this activity, a teacher would create a class
code from activity launch page, then they would need to distribute the class
code so students could access the activity. Once students are inside the activity,
the first slides inform them of how the activity works.
MODIFICATION
The first slides include how to use the launch bottom, how to change one
of the parameters of a linear equation (slope or y intercept) to collect the
stars, and how to reset the equation is you make a mistake. These first sets of
activities are called “Fix-it” tasks. Besides having to have some prior
knowledge about the basic properties of linear equations, students will also be
introduced to creating restrictions on a line to make it start or stop at a given
point. Teacher will use built-in tools like the thumbs up mode, or the pause
button so they can lead a whole class discussion to intervene when students
are struggling.
MODIFICATION
MODIFICATION
MODIFICATION
MODIFICATION
After students complete the “Fix-it” challenges, they move on to
the Predict and Verify section of tasks. In the Predict and Verify sections,
students are asked to anticipate what would happen to a graph if some
value is changed, and justify their answers in writing. When students reach
each of the slides they can see their classmates’ responses. A teacher can
review any of these responses and pause the class to ask more probing
questions as to why students think their answers is true.
REDEFINITION
The students will be working in pairs in making a video tutorial that
deals with graphing equation of a line in slope-intercept form with
consideration on the use of Desmos Graphing Calculator. They will have to
create a story board that is to be shared and presented to the class for
them to discuss and ask questions. Students’ output will be rated thru
rubric.

2-samr-model.pptx

  • 1.
  • 2.
    LessonTitle: Graphing Equationof a Line: Slope-Intercept Form Grade: Grade 8 Lesson Length: 90 minutes
  • 3.
    Learning Styles Students comesfrom a variety of economic and social backgrounds and their learning styles vary from: auditory, visual, tactile and kinesthetic. However, some students have difficulty maintaining focus during class. In order to overcome this issue, lesson must accommodate the students’ attention span and also to facilitate their individualized preferred needs. Entry Skills Students already knows the basic concepts of slope and intercepts of a line; however they cannot carry out the task in graphing an equation of a line in slope-intercept form. LEARNERS CHARACTERISTICS
  • 4.
    STATE OBJECTIVES At theend of the lesson, students should be able to: • Demonstrate understanding on slope-intercept form of the equation of a line • Restrict, reposition, and rotate lines with the slope-intercept form using the Desmos Graphing Calculator and Marbleslides: Lines • Develop accuracy and teamwork in making tutorial video about graphing linear equations in slope-intercept form
  • 5.
    The teacher willask the students about what they know in equation of a line, the slopes and y-intercepts to assess their knowledge and understanding on it. Considering that they already learned what integer is all about, the teacher will now introduce slope-intercept form of a line.
  • 6.
    SUBSTITUTION Example of Graphof a Linear Equation in Slope-Intercept Form presented using chalkboard Graphs of Equation of a LinesWorksheet downloaded from the website (https://www.khanacademy.org/math/algebra/ two-var-linear-equations/modal/e/slope-from- a-graph) are presented using PowerPoint
  • 7.
    A motivational activitywill be initiated by the teacher which deals in identifying the slope and y-intercept of a line. The teacher will flash examples of graphs of lines using the PPT then the students should tell the slope and y-intercept of each lines as shown on each graph.
  • 8.
    AUGMENTATION The teacher willdirect students to access the website—Desmos Lab in which they will be using Desmos—a free online graphing calculator that allows learners to manipulate linear equations and represent them visually. The teacher will be providing a worksheet indicating series of linear equations, then students will be working in pairs and will now use this online graphing calculator to graph equations of lines in slope-intercept form. They will have to enter 8 equations on the slides and the graph of each line be automatically shown.
  • 9.
  • 10.
    MODIFICATION The students willbe involved in the online game “Marbleslides: Lines” from the website --https://teacher.desmos.com/marbleslides-lines developed by the team of educators at the Desmos. This interactive activity asks students to manipulate a series of linear equations in order to collect the 4 stars on a given page. Once students have completed collecting the four stars they can then move on to the next slide. To start this activity, a teacher would create a class code from activity launch page, then they would need to distribute the class code so students could access the activity. Once students are inside the activity, the first slides inform them of how the activity works.
  • 11.
    MODIFICATION The first slidesinclude how to use the launch bottom, how to change one of the parameters of a linear equation (slope or y intercept) to collect the stars, and how to reset the equation is you make a mistake. These first sets of activities are called “Fix-it” tasks. Besides having to have some prior knowledge about the basic properties of linear equations, students will also be introduced to creating restrictions on a line to make it start or stop at a given point. Teacher will use built-in tools like the thumbs up mode, or the pause button so they can lead a whole class discussion to intervene when students are struggling.
  • 12.
  • 13.
  • 14.
  • 15.
    MODIFICATION After students completethe “Fix-it” challenges, they move on to the Predict and Verify section of tasks. In the Predict and Verify sections, students are asked to anticipate what would happen to a graph if some value is changed, and justify their answers in writing. When students reach each of the slides they can see their classmates’ responses. A teacher can review any of these responses and pause the class to ask more probing questions as to why students think their answers is true.
  • 16.
    REDEFINITION The students willbe working in pairs in making a video tutorial that deals with graphing equation of a line in slope-intercept form with consideration on the use of Desmos Graphing Calculator. They will have to create a story board that is to be shared and presented to the class for them to discuss and ask questions. Students’ output will be rated thru rubric.