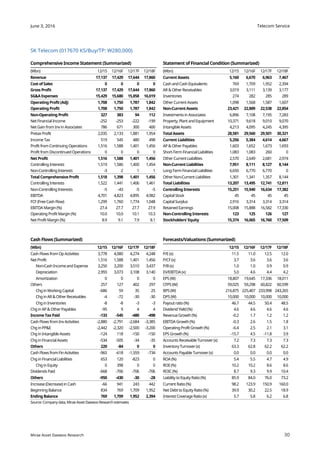
Download to read offline
![Telecom Service
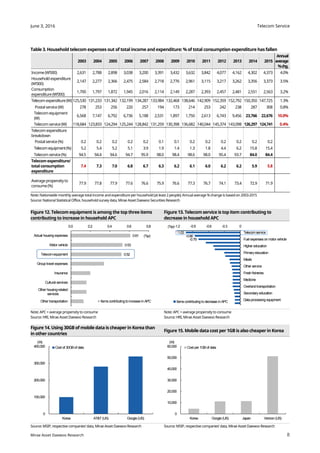
Solid downside support and decent growth
potential
In late phase of LTE era: Consumption diverging and becoming rational
LTE technology came to Korea in end-2011. Nearly five years later, the domestic
telecom service industry is now entering the late phase of the LTE era. During the
initial high-growth phase, early adopters purchased expensive handsets and
subscribed to high-priced rate plans. Now, telecom service consumption trends are
changing. 1) First, consumption is diverging, with the gap between telcos’ average
rates and MVNO rates widening further this year, compared to 2012. 2) Second,
consumers are becoming more rational. Low- to mid-end handset purchases out of
all purchases are estimated to be near 30%, from less than 10% in 2012. In addition,
the cumulative number of subscribers who have chosen a rate discount in lieu of
subsidies has surpassed 10% of overall mobile subscribers.
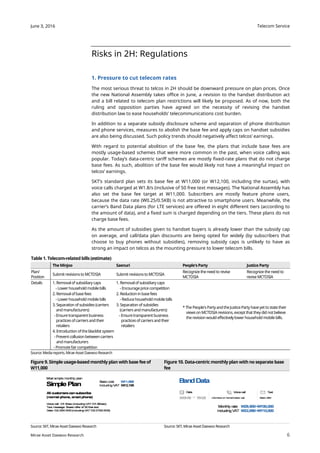
Risks from telecom plan restrictions; Opportunities from growing data
usage and business expansion
The most serious threat to telcos in 2H should be downward pressure on plan
prices. Once the new National Assembly takes office in June, a revision to the
handset distribution act and a bill related to telecom plan restrictions will likely be
proposed. With ARPU growth slowing and service rate discounts being booked as
sales discounts, telcos must find ways to deal with the growing pressure to lower
telecom bills. In our view, they could point to the following facts to justify current
rates: 1) Telecom expenses as a percentage of household spending have steadily
decreased over the past decade. 2) Handset purchase expenses are a bigger driver
of household spending growth than service plans. 3) Data plans are cheaper in
Korea than in other countries.
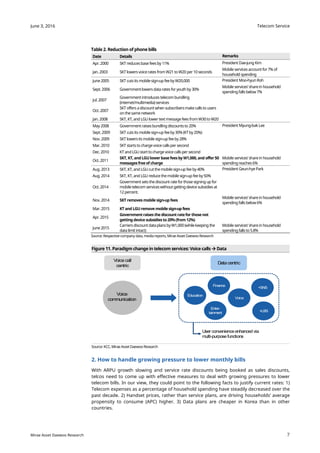
On the bright side, we believe telcos will find opportunities from high-priced rate
plans amid growing data usage. In addition, telcos are expanding aggressively into
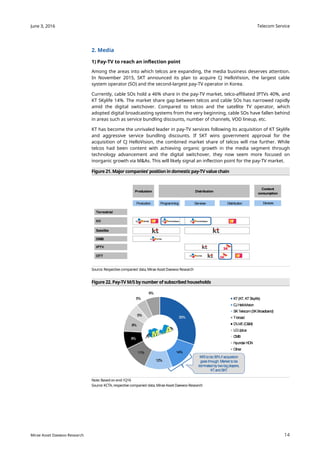
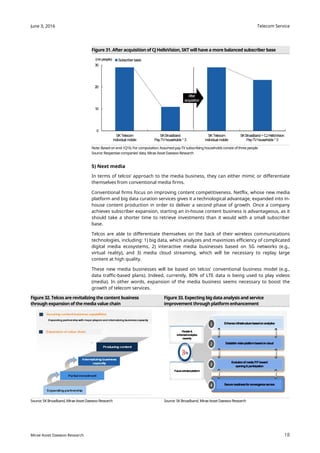
new business areas, with a particular growing influence in the media business.
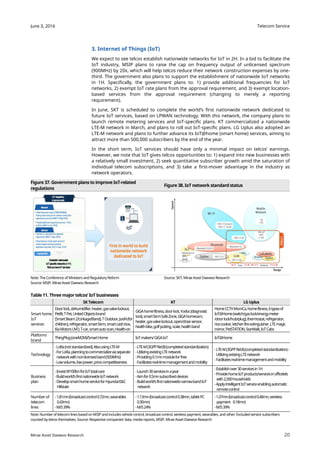
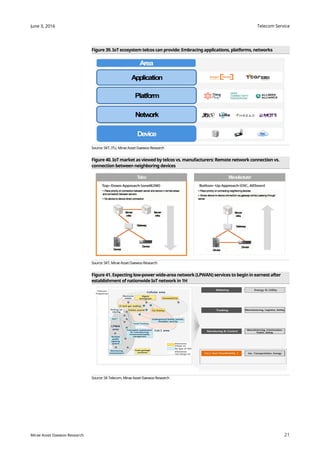
Furthermore, capitalizing on nationwide IoT networks, telcos are planning full-
swing launch of low-power wide-area network (LPWAN) services.
2H: Attractive dividend payout; Aggressive expansion; Retain Overweight
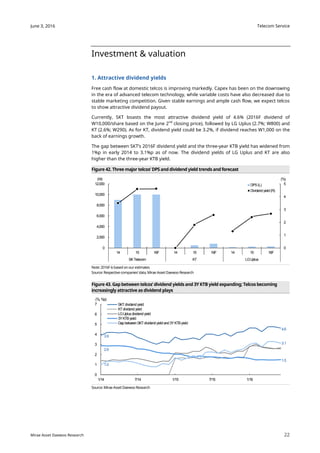
Free cash flow at domestic telcos is improving markedly. Capex has been on the
downswing in the era of advanced telecom technology, while variable costs have
also decreased due to stable marketing competition. Given stable earnings and
ample cash flow, we expect telcos to show attractive dividend payout. If shares
correct due to regulatory risks, high dividend yields should provide downside
support. Telcos’ growth prospects also appear decent in light of their aggressive
business expansion.
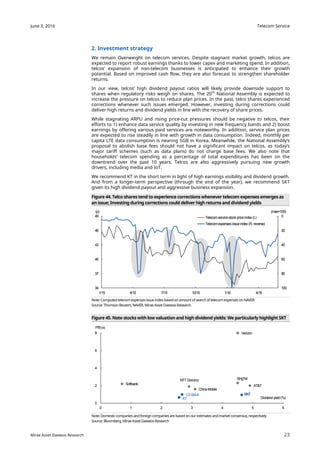
We retain our Overweight rating on the telecom sector. In the short term, we
recommend KT in light of its high earnings visibility and dividend growth. And from
a longer-term perspective (through the end of the year), we recommend SK
Telecom (SKT) given its high dividend payout and aggressive business expansion.
Overweight (Maintain)
2H16 Outlook Report
June 3, 2016
Mirae Asset Daewoo Co., Ltd.
[Telecom Service / Media]
Jee-hyun Moon
+822-768-3615
jeehyun.moon@dwsec.com
Nu-ri Ha
+822-768-4130
nuri.ha@dwsec.com
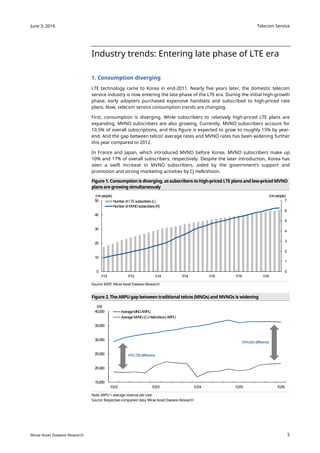
Korean telecom service industry index long-term trend: Key variables are ARPU,
dividends, and new businesses
Note: KOSPI dividedby 50 to show on same axis as telecom index; Telecom index is FTSE KoreaTelecom Index;
Source: Thomson Reuters, respective companies’ data, Mirae Asset Daewoo Research
25
30
35
40
45
50
28,000
30,500
33,000
35,500
38,000
04 05 06 07 08 09 10 11 12 13 14 15 16F 17F 18F
(p)(W)
AverageARPUof threebigtelcos(L)
Telecomserviceindustryindex(R)
KOSPI/50(R)
LTE
introduction
[Increaseddividends; Newbusinesses]
Downsidesupport, growthpotential
Telecomsector
tradingrange
mayrise](https://image.slidesharecdn.com/telco2016061408423129-161109042638/85/2H16-Telecom-Industry-Outlook-1-320.jpg)
![Telecom Service
Solid downside support and decent growth
potential
In late phase of LTE era: Consumption diverging and becoming rational
LTE technology came to Korea in end-2011. Nearly five years later, the domestic
telecom service industry is now entering the late phase of the LTE era. During the
initial high-growth phase, early adopters purchased expensive handsets and
subscribed to high-priced rate plans. Now, telecom service consumption trends are
changing. 1) First, consumption is diverging, with the gap between telcos’ average
rates and MVNO rates widening further this year, compared to 2012. 2) Second,
consumers are becoming more rational. Low- to mid-end handset purchases out of
all purchases are estimated to be near 30%, from less than 10% in 2012. In addition,
the cumulative number of subscribers who have chosen a rate discount in lieu of
subsidies has surpassed 10% of overall mobile subscribers.
Risks from telecom plan restrictions; Opportunities from growing data
usage and business expansion
The most serious threat to telcos in 2H should be downward pressure on plan
prices. Once the new National Assembly takes office in June, a revision to the
handset distribution act and a bill related to telecom plan restrictions will likely be
proposed. With ARPU growth slowing and service rate discounts being booked as
sales discounts, telcos must find ways to deal with the growing pressure to lower
telecom bills. In our view, they could point to the following facts to justify current
rates: 1) Telecom expenses as a percentage of household spending have steadily
decreased over the past decade. 2) Handset purchase expenses are a bigger driver
of household spending growth than service plans. 3) Data plans are cheaper in
Korea than in other countries.
On the bright side, we believe telcos will find opportunities from high-priced rate
plans amid growing data usage. In addition, telcos are expanding aggressively into
new business areas, with a particular growing influence in the media business.
Furthermore, capitalizing on nationwide IoT networks, telcos are planning full-
swing launch of low-power wide-area network (LPWAN) services.
2H: Attractive dividend payout; Aggressive expansion; Retain Overweight
Free cash flow at domestic telcos is improving markedly. Capex has been on the
downswing in the era of advanced telecom technology, while variable costs have
also decreased due to stable marketing competition. Given stable earnings and
ample cash flow, we expect telcos to show attractive dividend payout. If shares
correct due to regulatory risks, high dividend yields should provide downside
support. Telcos’ growth prospects also appear decent in light of their aggressive
business expansion.
We retain our Overweight rating on the telecom sector. In the short term, we
recommend KT in light of its high earnings visibility and dividend growth. And from
a longer-term perspective (through the end of the year), we recommend SK
Telecom (SKT) given its high dividend payout and aggressive business expansion.
Overweight (Maintain)
2H16 Outlook Report
June 3, 2016
Mirae Asset Daewoo Co., Ltd.
[Telecom Service / Media]
Jee-hyun Moon
+822-768-3615
jeehyun.moon@dwsec.com
Nu-ri Ha
+822-768-4130
nuri.ha@dwsec.com
Korean telecom service industry index long-term trend: Key variables are ARPU,
dividends, and new businesses
Note: KOSPI dividedby 50 to show on same axis as telecom index; Telecom index is FTSE KoreaTelecom Index;
Source: Thomson Reuters, respective companies’ data, Mirae Asset Daewoo Research
25
30
35
40
45
50
28,000
30,500
33,000
35,500
38,000
04 05 06 07 08 09 10 11 12 13 14 15 16F 17F 18F
(p)(W)
AverageARPUof threebigtelcos(L)
Telecomserviceindustryindex(R)
KOSPI/50(R)
LTE
introduction
[Increaseddividends; Newbusinesses]
Downsidesupport, growthpotential
Telecomsector
tradingrange
mayrise](https://image.slidesharecdn.com/telco2016061408423129-161109042638/75/2H16-Telecom-Industry-Outlook-1-2048.jpg)

The Korean telecom industry is entering the late phase of the LTE era. Consumption trends are changing as consumption diverges between high-priced LTE plans and low-priced MVNO plans. Consumers are also becoming more rational, opting for discounted handset rates over subsidies. Telcos face risks from potential regulations lowering rates, while opportunities exist in growing data usage and expanding new businesses like media and IoT. Telcos maintain strong cash flows and dividends despite slowing revenue growth.


![[2016 Outlook] Telecom Service](https://cdn.slidesharecdn.com/ss_thumbnails/201512112016outlooktelecomserviceoverweight1-151222013604-thumbnail.jpg?width=640&height=640&fit=bounds)


![Strategic-Analysis-Newscorp-Fox-[MBA-Project]](https://cdn.slidesharecdn.com/ss_thumbnails/245b8765-d14b-476d-a128-4bf85449ece7-150310164209-conversion-gate01-thumbnail.jpg?width=640&height=640&fit=bounds)


![[Special report]korean 4th mno is a distant dream lte tdd_20120828](https://cdn.slidesharecdn.com/ss_thumbnails/specialreportkorean4thmnoisadistantdreamltetdd20120828-120827070444-phpapp02-thumbnail.jpg?width=640&height=640&fit=bounds)


![[2016 하반기 outlook] 통신서비스 (비중확대)](https://cdn.slidesharecdn.com/ss_thumbnails/2016outlook-160614105734-thumbnail.jpg?width=640&height=640&fit=bounds)
![[2016 하반기 outlook] 미디어 콘텐츠 광고 (비중확대)](https://cdn.slidesharecdn.com/ss_thumbnails/2016outlook-160614105722-thumbnail.jpg?width=640&height=640&fit=bounds)
![[2016 Outlook] Media Advertisement](https://cdn.slidesharecdn.com/ss_thumbnails/201512102016outlookmediaadvertisementoverweight1-151222013450-thumbnail.jpg?width=640&height=640&fit=bounds)


