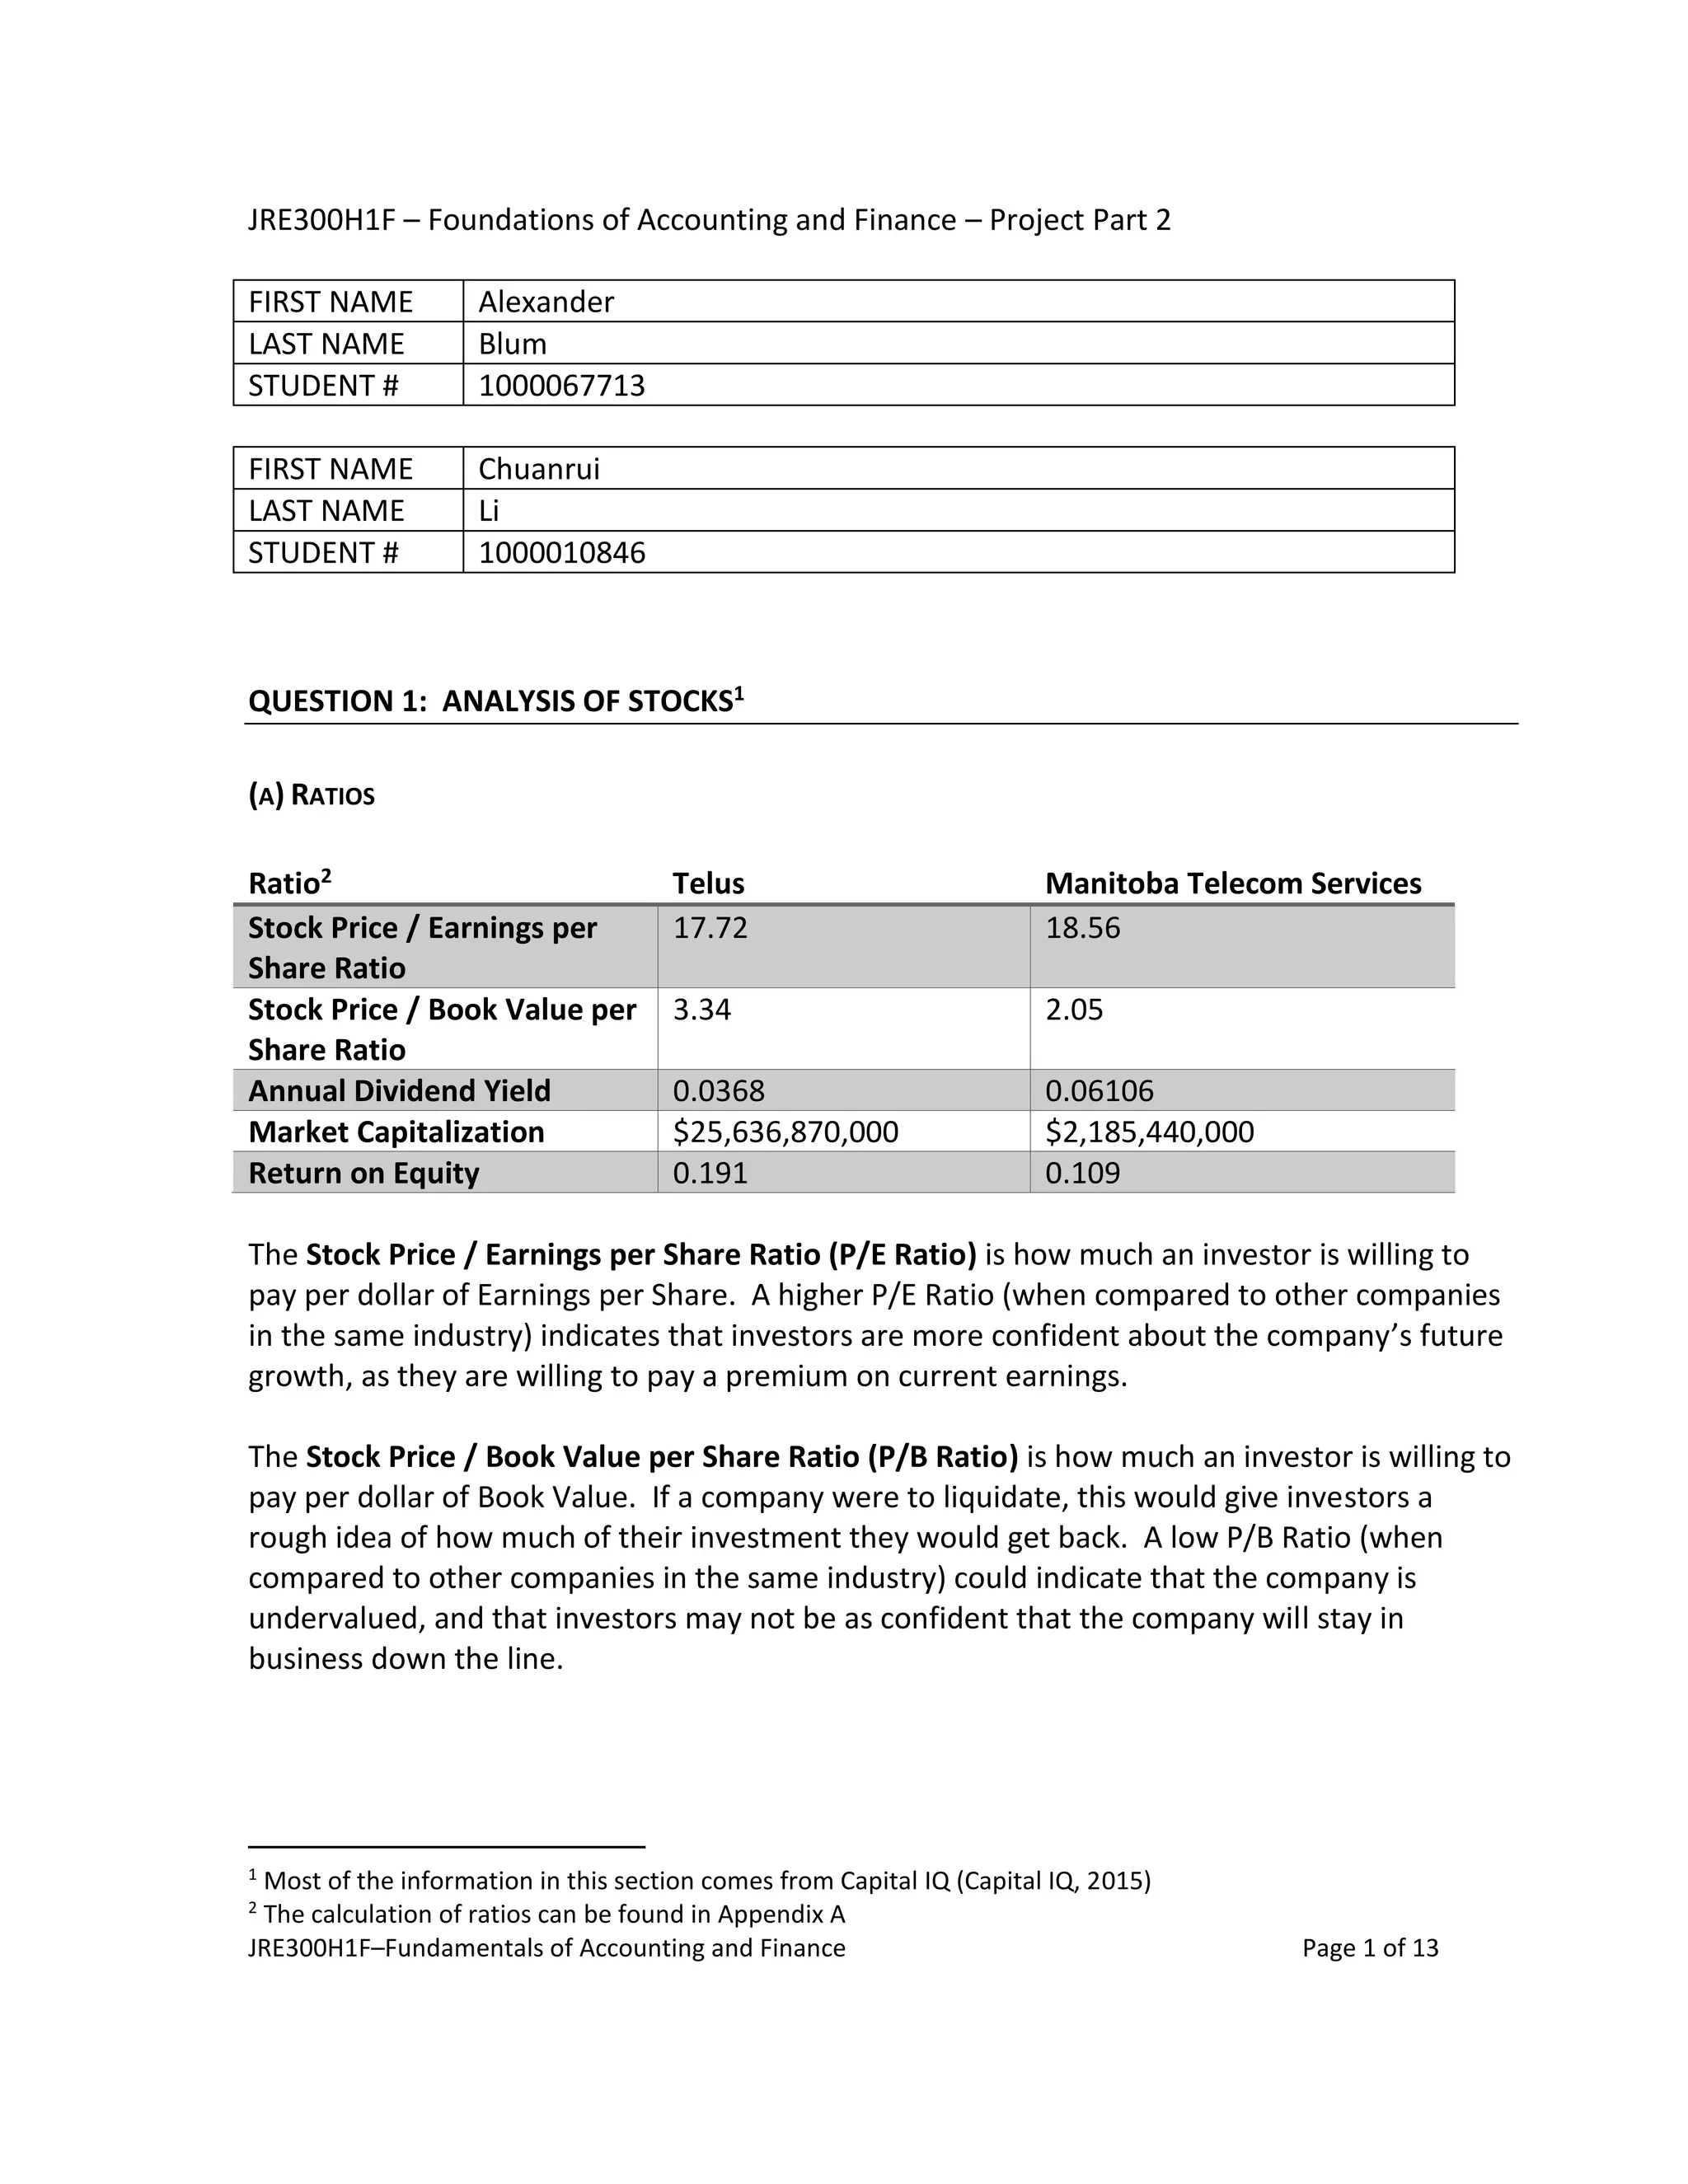
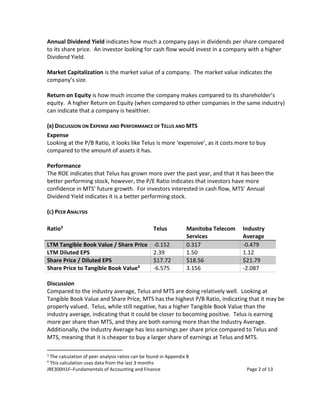
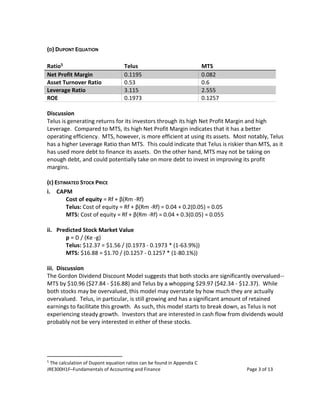
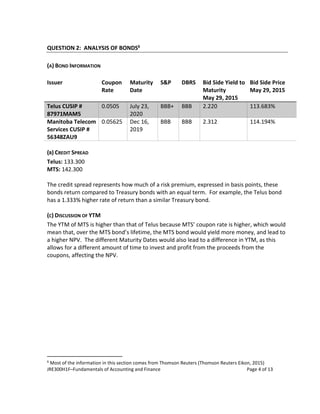
JRE300H1F–Fundamentals of Accounting and Finance Page 1 of 13
JRE300H1F – Foundations of Accounting and Finance – Project Part 2
FIRST NAME Alexander
LAST NAME Blum
STUDENT # 1000067713
FIRST NAME Chuanrui
LAST NAME Li
STUDENT # 1000010846
QUESTION 1: ANALYSIS OF STOCKS1
(A) RATIOS
Ratio2 Telus Manitoba Telecom Services
Stock Price / Earnings per
Share Ratio
17.72 18.56
Stock Price / Book Value per
Share Ratio
3.34 2.05
Annual Dividend Yield 0.0368 0.06106
Market Capitalization $25,636,870,000 $2,185,440,000
Return on Equity 0.191 0.109
The Stock Price / Earnings per Share Ratio (P/E Ratio) is how much an investor is willing to
pay per dollar of Earnings per Share. A higher P/E Ratio (when compared to other companies
in the same industry) indicates that investors are more confident about the company’s future
growth, as they are willing to pay a premium on current earnings.
The Stock Price / Book Value per Share Ratio (P/B Ratio) is how much an investor is willing to
pay per dollar of Book Value. If a company were to liquidate, this would give investors a
rough idea of how much of their investment they would get back. A low P/B Ratio (when
compared to other companies in the same industry) could indicate that the company is
undervalued, and that investors may not be as confident that the company will stay in
business down the line.
1
Most of the information in this section comes from Capital IQ (Capital IQ, 2015)
2
The calculation of ratios can be found in Appendix A
JRE300H1F–Fundamentals of Accounting and Finance Page 2 of 13
Annual Dividend Yield indicates how much a company pays in dividends per share compared
to its share price. An investor looking for cash flow would invest in a company with a higher
Dividend Yield.
Market Capitalization is the market value of a company. The market value indicates the
company’s size.
Return on Equity is how much income the company makes compared to its shareholder’s
equity. A higher Return on Equity (when compared to other companies in the same industry)
can indicate that a company is healthier.
(B) DISCUSSION ON EXPENSE AND PERFORMANCE OF TELUS AND MTS
Expense
Looking at the P/B Ratio, it looks like Telus is more ‘expensive’, as it costs more to buy
compared to the amount of assets it has.
Performance
The ROE indicates that Telus has grown more over the past year, and that it has been the
better performing stock, however, the P/E Ratio indicates that investors have more
confidence in MTS’ future growth. For investors interested in cash flow, MTS’ Annual
Dividend Yield indicates it is a better performing stock.
(C) PEER ANALYSIS
Ratio3 Telus Manitoba Telecom
Services
Industry
Average
LTM Tangible Book Value / Share Price -0.152 0.317 -0.479
LTM Diluted EPS 2.39 1.50 1.12
Share Price / Diluted EPS $17.72 $18.56 $21.79
Share Price to Tangible Book Value4 -6.575 3.156 -2.087
Discussion
Compared to the industry average, Telus and MTS are doing relatively well. Looking at
Tangible Book Value and Share Price, MTS has the highest P/B Ratio, indicating that it may be
properly valued. Telus, while still negative, has a higher Tangible Book Value than the
industry average, indicating that it could be closer to becoming positive. Telus is earning
more per share than MTS, and they are both earning more than the Industry Average.
Additionally, the Industry Average has less earnings per share price compared to Telus and
MTS, meaning that it is cheaper to buy a larger share of earnings at Telus and MTS.
3
The calculation of peer analysis ratios can be found in Appendix B
4
This calculation uses data from the last 3 months
JRE300H1F–Fundamentals of Accounting and Finance Page 3 of 13
(D) DUPONT EQUATION
Ratio5 Telus MTS
Net Profit Margin 0.1195 0.082
Asset Turnover Ratio 0.53 0.6
Leverage Ratio 3.115 2.555
ROE 0.1973 0.1257
Discussion
Telus is generating returns for its investors through its high Net Profit Margin and high
Leverage. Compared to MTS, its high Net Profit Margin indicates that it has a better
operating efficiency. MTS, however, is more efficient at using its assets. Most notably, Telus
has a higher Leverage Ratio than MTS. This could indicate that Telus is riskier than MTS, as it
has used more debt to finance its assets. On the other hand, MTS may not be taking on
enough debt, and could potentially take on more debt to invest in improving its profit
margins.
(E) ESTIMATED STOCK PRICE
i. CAPM
Cost of equity = Rf + β(Rm -Rf)
Telus: Cost of equity = Rf + β(Rm -Rf) = 0.04 + 0.2(0.05) = 0.05
MTS: Cost of equity = Rf + β(Rm -Rf) = 0.04 + 0.3(0.05) = 0.055
ii. Predicted Stock Market Value
p = D / (Ke -g)
Telus: $12.37 = $1.56 / (0.1973 - 0.1973 * (1-63.9%))
MTS: $16.88 = $1.70 / (0.1257 - 0.1257 * (1-80.1%))
iii. Discussion
The Gordon Dividend Discount Model suggests that both stocks are significantly overvalued--
MTS by $10.96 ($27.84 - $16.88) and Telus by a whopping $29.97 ($42.34 - $12.37). While
both stocks may be overvalued, this model may overstate by how much they are actually
overvalued. Telus, in particular, is still growing and has a significant amount of retained
earnings to facilitate this growth. As such, this model starts to break down, as Telus is not
experiencing steady growth. Investors that are interested in cash flow from dividends would
probably not be very interested in either of these stocks.
5
The calculation of Dupont equation ratios can be found in Appendix C
JRE300H1F–Fundamentals of Accounting and Finance Page 4 of 13
QUESTION 2: ANALYSIS OF BONDS6
(A) BOND INFORMATION
Issuer Coupon
Rate
Maturity
Date
S&P DBRS Bid Side Yield to
Maturity
May 29, 2015
Bid Side Price
May 29, 2015
Telus CUSIP #
87971MAM5
0.0505 July 23,
2020
BBB+ BBB 2.220 113.683%
Manitoba Telecom
Services CUSIP #
56348ZAU9
0.05625 Dec 16,
2019
BBB BBB 2.312 114.194%
(B) CREDIT SPREAD
Telus: 133.300
MTS: 142.300
The credit spread represents how much of a risk premium, expressed in basis points, these
bonds return compared to Treasury bonds with an equal term. For example, the Telus bond
has a 1.333% higher rate of return than a similar Treasury bond.
(C) DISCUSSION OF YTM
The YTM of MTS is higher than that of Telus because MTS’ coupon rate is higher, which would
mean that, over the MTS bond’s lifetime, the MTS bond would yield more money, and lead to
a higher NPV. The different Maturity Dates would also lead to a difference in YTM, as this
allows for a different amount of time to invest and profit from the proceeds from the
coupons, affecting the NPV.
6
Most of the information in this section comes from Thomson Reuters (Thomson Reuters Eikon, 2015)
JRE300H1F–Fundamentals of Accounting and Finance Page 5 of 13
QUESTION 3: LEASING VS. BUYING
PART A
Cost to purchase the equipment:
Purchase Price = $4,250,000
Depreciation Tax Savings per year = $4,250,000 / 5 = $850,000
PV (Depreciation Tax Savings) = = $1,304,200.38
NPV = Purchase Price - PV (Depreciation Tax Savings) – PV (Salvage Value)
NPV = $4,250,000 - $1,304,200.38 - $0 = $-2,945,799.62
Cost to lease the equipment:
Annual Payments after-tax:
$975,000 * (1-0.35) = $633,750
NPV (Operating Lease) = = $-2,904,687.14
In this case, it is better to lease the equipment.
PART B
Cost to purchase the equipment:
PV (OCF) = 0
PV (CCATS) =
PV (CCATS) = = $1,244,819.10
CF0 = $4,250,000
PV (ECFn) = 0
PV (terminal loss) = = $84,447.98
NPV = PV (OCF) + PV (CCATS) + PV (ECFn) – CF0 + PV (terminal loss)
NPV = $1,244,819.10 - $4,250,000 + $84,447.98 = $-2,920,732.92
Cost to lease the equipment:
Same as Part A
NPV (Operating Lease) = = $-2,904,687.14
Using this method of depreciation is cheaper than using straight line depreciation, however,
leasing the equipment is still a better value.
JRE300H1F–Fundamentals of Accounting and Finance Page 6 of 13
QUESTION 4: EQUIVALENT ANNUAL COST / NPV
NPV = PV (ΔOCF) + PV (ΔCCATS) + PV (ΔECFn) – ΔCF0 + ΔPV (terminal loss)
PV (Operating CFs) =
PV (Operating CFs A) = = $-219,361.48
PV (Operating CFs B) = = $-219,532.20
PV (CCATS) =
PV (CCATS A) = = $657,211.96
PV (CCATS B) = = $867,651.72
PV (ECFn) =
PV (ECFn A) = = $144,520.62
PV (ΔECFn B) = = $139,811.63
PV (terminal loss A) = = $20,544.76
PV (PV of recapture B) = = $11,020.98
NPV (A) = PV (OCF) + PV (CCATS) + PV (ECFn) – CF0 + PV (terminal loss)
NPV (A) = $-219,361.48 + $657,211.96 + $144,520.62 - $3,000,000 + $20,544.76 =
$-2,397,084.14
NPV (B) = PV (OCF) + PV (CCATS) + PV (ECFn) – CF0 - PV (PV of recapture)
NPV (B) = $-219,532.21 + $867,651.72 + $139,811.63 - $3,800,000 - $11,020.98 =
$-3,023,089.83
JRE300H1F–Fundamentals of Accounting and Finance Page 7 of 13
Equivalent Annual NPV (EANPV) =
EANPV (A) = = $-542,006.62
EANPV (B) = = $-589,106.20
Because, in this case, the NPV is an equipment purchasing price, it is a cash outflow for
Garden Farrel Company and will therefore cause the NPV to be negative. The company
should choose equipment A, because A has a higher (less negative) Annual Present Value than
equipment B. Over the course of the equipment’s lifetime, equipment A will cost less overall
than equipment B.
JRE300H1F–Fundamentals of Accounting and Finance Page 8 of 13
QUESTION 5: PROJECT VALUATION
(A) NPV OF THE PROJECT
PV (After-tax Operating Income) = =
$106,822,346
PV (CCATS) =
PV (CCATS) = = $24,774,642.40
PV (ECFn) = = $2,141,170.68
PV (PV of recapture) = = $593,718.91
NPV = PV (OCF) + PV (CCATS) + PV (ECFn) – CF0 – PV (PV of recapture)
= $106,822,346 + $24,774,642.40 + $2,141,170.68 - $120,000,000 - $593,718.91
= $13,144,440.20
(B) IRR ESTIMATE
0 = +
+ - $120,000,000 +
IRR = k = 10.5072%
(C) RISK
Calculation Assumptions:
1. Market price for energy is fixed during next 20 years
2. Annual energy consumption is A MWh per year
3. Appropriate discount rate for the Project is 9%
Total Market Price = = $1,141.07 * A
Total Original Price = = $1,186.03 * A
JRE300H1F–Fundamentals of Accounting and Finance Page 9 of 13
With these assumptions, the calculations suggest that we should follow the original option.
Factors to consider in making this decision:
This calculation is highly dependent on the assumption that energy prices will stay relatively
stable over the next 20 years. In reality, however, energy prices are variable. It is possible
that the market price for energy will grow at the same rate as the FPA, or at an even higher
rate, however, it is also possible that energy prices will drop. The reason why the FPA may be
the better option is that it provides assurance that the project will make a predictable amount
of money, as opposed to a variable outcome.
JRE300H1F–Fundamentals of Accounting and Finance Page 10 of 13
REFRENCES
Capital IQ. Financial Information for Telus (TO.T) and Manitoba Telecom Systems (TO.MBT).
Retrieved June 18, 2015
Thomson Reuters Eikon. Financial Information for Telus CUSIP # 87971MAM5 and Manitoba
Telecom Services CUSIP # 56348ZAU9. Retrieved June 18, 2015
JRE300H1F–Fundamentals of Accounting and Finance Page 11 of 13
APPENDIX A: CALCULATION OF RATIOS
Stock Price / Earnings per Share Ratio
Telus: 17.72 = $42.34 / $2.39
MTS: 18.56 = $27.84 / $1.50
Stock Price / Book Value per Share Ratio
Telus: 3.34 = $42.34 / $12.68
MTS: 2.05 = $27.84 / $13.60
Annual Dividend Yield = Annual Dividend per Share / Stock Price
Telus: 0.0368 = $1.56 / $42.34
MTS: 0.06106 = $1.70 / $27.84
Market Capitalization = Total Number of Shares Outstanding * Price per Share
Telus: $25,636,870,000 = 605,500,000 * $42.34
MTS: $2,185,440,000 = 78,500,000 * $27.84
Return on Equity = Net Income/Shareholder's Equity
Telus: 0.191 = $1,463,000,000 / $7,678,000,000
MTS: 0.109 = $116,500,000 / $1,067,700,000
JRE300H1F–Fundamentals of Accounting and Finance Page 12 of 13
APPENDIX B: CALCULATION OF PEER ANALYSIS RATIOS
LTM Tangible Book Value / Share Price
Telus: -0.152 = $-6.44 / $42.34
MTS: 0.317 = $8.82 / $27.84
Industry Average: -0.479 = $-11.69 / $24.40
Share Price / Diluted EPS
Telus: $17.72 = $42.34 / 2.39
MTS: $18.56 = $27.84 / 1.50
Industry Average: $21.79 = $24.40 / 1.12
Share Price / Tangible Book Value
Telus: -6.575 = $42.34 / $-6.44
MTS: 3.156 = $27.84 / $8.82
Industry Average: -2.087 = $24.40 / $-11.69
JRE300H1F–Fundamentals of Accounting and Finance Page 13 of 13
APPENDIX C: CALCULATION OF DUPONT EQUATION RATIOS
Leverage Ratio = Total Assets / Equity
Telus: 3.115 = $23,217,000,000 / $7,454,000,000
MTS: 2.555= $2,688,000,000 / $1,052,000,000
ROE = Net Profit Margin * Asset Turnover Ratio * Leverage Ratio
Telus: 0.1973 = 0.1195 * 0.53 * 3.115
MTS: 0.1257 = 0.082 * 0.6 * 2.555

JRE300 - Assignment 2

  • 1.
    JRE300H1F–Fundamentals of Accountingand Finance Page 1 of 13 JRE300H1F – Foundations of Accounting and Finance – Project Part 2 FIRST NAME Alexander LAST NAME Blum STUDENT # 1000067713 FIRST NAME Chuanrui LAST NAME Li STUDENT # 1000010846 QUESTION 1: ANALYSIS OF STOCKS1 (A) RATIOS Ratio2 Telus Manitoba Telecom Services Stock Price / Earnings per Share Ratio 17.72 18.56 Stock Price / Book Value per Share Ratio 3.34 2.05 Annual Dividend Yield 0.0368 0.06106 Market Capitalization $25,636,870,000 $2,185,440,000 Return on Equity 0.191 0.109 The Stock Price / Earnings per Share Ratio (P/E Ratio) is how much an investor is willing to pay per dollar of Earnings per Share. A higher P/E Ratio (when compared to other companies in the same industry) indicates that investors are more confident about the company’s future growth, as they are willing to pay a premium on current earnings. The Stock Price / Book Value per Share Ratio (P/B Ratio) is how much an investor is willing to pay per dollar of Book Value. If a company were to liquidate, this would give investors a rough idea of how much of their investment they would get back. A low P/B Ratio (when compared to other companies in the same industry) could indicate that the company is undervalued, and that investors may not be as confident that the company will stay in business down the line. 1 Most of the information in this section comes from Capital IQ (Capital IQ, 2015) 2 The calculation of ratios can be found in Appendix A
  • 2.
    JRE300H1F–Fundamentals of Accountingand Finance Page 2 of 13 Annual Dividend Yield indicates how much a company pays in dividends per share compared to its share price. An investor looking for cash flow would invest in a company with a higher Dividend Yield. Market Capitalization is the market value of a company. The market value indicates the company’s size. Return on Equity is how much income the company makes compared to its shareholder’s equity. A higher Return on Equity (when compared to other companies in the same industry) can indicate that a company is healthier. (B) DISCUSSION ON EXPENSE AND PERFORMANCE OF TELUS AND MTS Expense Looking at the P/B Ratio, it looks like Telus is more ‘expensive’, as it costs more to buy compared to the amount of assets it has. Performance The ROE indicates that Telus has grown more over the past year, and that it has been the better performing stock, however, the P/E Ratio indicates that investors have more confidence in MTS’ future growth. For investors interested in cash flow, MTS’ Annual Dividend Yield indicates it is a better performing stock. (C) PEER ANALYSIS Ratio3 Telus Manitoba Telecom Services Industry Average LTM Tangible Book Value / Share Price -0.152 0.317 -0.479 LTM Diluted EPS 2.39 1.50 1.12 Share Price / Diluted EPS $17.72 $18.56 $21.79 Share Price to Tangible Book Value4 -6.575 3.156 -2.087 Discussion Compared to the industry average, Telus and MTS are doing relatively well. Looking at Tangible Book Value and Share Price, MTS has the highest P/B Ratio, indicating that it may be properly valued. Telus, while still negative, has a higher Tangible Book Value than the industry average, indicating that it could be closer to becoming positive. Telus is earning more per share than MTS, and they are both earning more than the Industry Average. Additionally, the Industry Average has less earnings per share price compared to Telus and MTS, meaning that it is cheaper to buy a larger share of earnings at Telus and MTS. 3 The calculation of peer analysis ratios can be found in Appendix B 4 This calculation uses data from the last 3 months
  • 3.
    JRE300H1F–Fundamentals of Accountingand Finance Page 3 of 13 (D) DUPONT EQUATION Ratio5 Telus MTS Net Profit Margin 0.1195 0.082 Asset Turnover Ratio 0.53 0.6 Leverage Ratio 3.115 2.555 ROE 0.1973 0.1257 Discussion Telus is generating returns for its investors through its high Net Profit Margin and high Leverage. Compared to MTS, its high Net Profit Margin indicates that it has a better operating efficiency. MTS, however, is more efficient at using its assets. Most notably, Telus has a higher Leverage Ratio than MTS. This could indicate that Telus is riskier than MTS, as it has used more debt to finance its assets. On the other hand, MTS may not be taking on enough debt, and could potentially take on more debt to invest in improving its profit margins. (E) ESTIMATED STOCK PRICE i. CAPM Cost of equity = Rf + β(Rm -Rf) Telus: Cost of equity = Rf + β(Rm -Rf) = 0.04 + 0.2(0.05) = 0.05 MTS: Cost of equity = Rf + β(Rm -Rf) = 0.04 + 0.3(0.05) = 0.055 ii. Predicted Stock Market Value p = D / (Ke -g) Telus: $12.37 = $1.56 / (0.1973 - 0.1973 * (1-63.9%)) MTS: $16.88 = $1.70 / (0.1257 - 0.1257 * (1-80.1%)) iii. Discussion The Gordon Dividend Discount Model suggests that both stocks are significantly overvalued-- MTS by $10.96 ($27.84 - $16.88) and Telus by a whopping $29.97 ($42.34 - $12.37). While both stocks may be overvalued, this model may overstate by how much they are actually overvalued. Telus, in particular, is still growing and has a significant amount of retained earnings to facilitate this growth. As such, this model starts to break down, as Telus is not experiencing steady growth. Investors that are interested in cash flow from dividends would probably not be very interested in either of these stocks. 5 The calculation of Dupont equation ratios can be found in Appendix C
  • 4.
    JRE300H1F–Fundamentals of Accountingand Finance Page 4 of 13 QUESTION 2: ANALYSIS OF BONDS6 (A) BOND INFORMATION Issuer Coupon Rate Maturity Date S&P DBRS Bid Side Yield to Maturity May 29, 2015 Bid Side Price May 29, 2015 Telus CUSIP # 87971MAM5 0.0505 July 23, 2020 BBB+ BBB 2.220 113.683% Manitoba Telecom Services CUSIP # 56348ZAU9 0.05625 Dec 16, 2019 BBB BBB 2.312 114.194% (B) CREDIT SPREAD Telus: 133.300 MTS: 142.300 The credit spread represents how much of a risk premium, expressed in basis points, these bonds return compared to Treasury bonds with an equal term. For example, the Telus bond has a 1.333% higher rate of return than a similar Treasury bond. (C) DISCUSSION OF YTM The YTM of MTS is higher than that of Telus because MTS’ coupon rate is higher, which would mean that, over the MTS bond’s lifetime, the MTS bond would yield more money, and lead to a higher NPV. The different Maturity Dates would also lead to a difference in YTM, as this allows for a different amount of time to invest and profit from the proceeds from the coupons, affecting the NPV. 6 Most of the information in this section comes from Thomson Reuters (Thomson Reuters Eikon, 2015)
  • 5.
    JRE300H1F–Fundamentals of Accountingand Finance Page 5 of 13 QUESTION 3: LEASING VS. BUYING PART A Cost to purchase the equipment: Purchase Price = $4,250,000 Depreciation Tax Savings per year = $4,250,000 / 5 = $850,000 PV (Depreciation Tax Savings) = = $1,304,200.38 NPV = Purchase Price - PV (Depreciation Tax Savings) – PV (Salvage Value) NPV = $4,250,000 - $1,304,200.38 - $0 = $-2,945,799.62 Cost to lease the equipment: Annual Payments after-tax: $975,000 * (1-0.35) = $633,750 NPV (Operating Lease) = = $-2,904,687.14 In this case, it is better to lease the equipment. PART B Cost to purchase the equipment: PV (OCF) = 0 PV (CCATS) = PV (CCATS) = = $1,244,819.10 CF0 = $4,250,000 PV (ECFn) = 0 PV (terminal loss) = = $84,447.98 NPV = PV (OCF) + PV (CCATS) + PV (ECFn) – CF0 + PV (terminal loss) NPV = $1,244,819.10 - $4,250,000 + $84,447.98 = $-2,920,732.92 Cost to lease the equipment: Same as Part A NPV (Operating Lease) = = $-2,904,687.14 Using this method of depreciation is cheaper than using straight line depreciation, however, leasing the equipment is still a better value.
  • 6.
    JRE300H1F–Fundamentals of Accountingand Finance Page 6 of 13 QUESTION 4: EQUIVALENT ANNUAL COST / NPV NPV = PV (ΔOCF) + PV (ΔCCATS) + PV (ΔECFn) – ΔCF0 + ΔPV (terminal loss) PV (Operating CFs) = PV (Operating CFs A) = = $-219,361.48 PV (Operating CFs B) = = $-219,532.20 PV (CCATS) = PV (CCATS A) = = $657,211.96 PV (CCATS B) = = $867,651.72 PV (ECFn) = PV (ECFn A) = = $144,520.62 PV (ΔECFn B) = = $139,811.63 PV (terminal loss A) = = $20,544.76 PV (PV of recapture B) = = $11,020.98 NPV (A) = PV (OCF) + PV (CCATS) + PV (ECFn) – CF0 + PV (terminal loss) NPV (A) = $-219,361.48 + $657,211.96 + $144,520.62 - $3,000,000 + $20,544.76 = $-2,397,084.14 NPV (B) = PV (OCF) + PV (CCATS) + PV (ECFn) – CF0 - PV (PV of recapture) NPV (B) = $-219,532.21 + $867,651.72 + $139,811.63 - $3,800,000 - $11,020.98 = $-3,023,089.83
  • 7.
    JRE300H1F–Fundamentals of Accountingand Finance Page 7 of 13 Equivalent Annual NPV (EANPV) = EANPV (A) = = $-542,006.62 EANPV (B) = = $-589,106.20 Because, in this case, the NPV is an equipment purchasing price, it is a cash outflow for Garden Farrel Company and will therefore cause the NPV to be negative. The company should choose equipment A, because A has a higher (less negative) Annual Present Value than equipment B. Over the course of the equipment’s lifetime, equipment A will cost less overall than equipment B.
  • 8.
    JRE300H1F–Fundamentals of Accountingand Finance Page 8 of 13 QUESTION 5: PROJECT VALUATION (A) NPV OF THE PROJECT PV (After-tax Operating Income) = = $106,822,346 PV (CCATS) = PV (CCATS) = = $24,774,642.40 PV (ECFn) = = $2,141,170.68 PV (PV of recapture) = = $593,718.91 NPV = PV (OCF) + PV (CCATS) + PV (ECFn) – CF0 – PV (PV of recapture) = $106,822,346 + $24,774,642.40 + $2,141,170.68 - $120,000,000 - $593,718.91 = $13,144,440.20 (B) IRR ESTIMATE 0 = + + - $120,000,000 + IRR = k = 10.5072% (C) RISK Calculation Assumptions: 1. Market price for energy is fixed during next 20 years 2. Annual energy consumption is A MWh per year 3. Appropriate discount rate for the Project is 9% Total Market Price = = $1,141.07 * A Total Original Price = = $1,186.03 * A
  • 9.
    JRE300H1F–Fundamentals of Accountingand Finance Page 9 of 13 With these assumptions, the calculations suggest that we should follow the original option. Factors to consider in making this decision: This calculation is highly dependent on the assumption that energy prices will stay relatively stable over the next 20 years. In reality, however, energy prices are variable. It is possible that the market price for energy will grow at the same rate as the FPA, or at an even higher rate, however, it is also possible that energy prices will drop. The reason why the FPA may be the better option is that it provides assurance that the project will make a predictable amount of money, as opposed to a variable outcome.
  • 10.
    JRE300H1F–Fundamentals of Accountingand Finance Page 10 of 13 REFRENCES Capital IQ. Financial Information for Telus (TO.T) and Manitoba Telecom Systems (TO.MBT). Retrieved June 18, 2015 Thomson Reuters Eikon. Financial Information for Telus CUSIP # 87971MAM5 and Manitoba Telecom Services CUSIP # 56348ZAU9. Retrieved June 18, 2015
  • 11.
    JRE300H1F–Fundamentals of Accountingand Finance Page 11 of 13 APPENDIX A: CALCULATION OF RATIOS Stock Price / Earnings per Share Ratio Telus: 17.72 = $42.34 / $2.39 MTS: 18.56 = $27.84 / $1.50 Stock Price / Book Value per Share Ratio Telus: 3.34 = $42.34 / $12.68 MTS: 2.05 = $27.84 / $13.60 Annual Dividend Yield = Annual Dividend per Share / Stock Price Telus: 0.0368 = $1.56 / $42.34 MTS: 0.06106 = $1.70 / $27.84 Market Capitalization = Total Number of Shares Outstanding * Price per Share Telus: $25,636,870,000 = 605,500,000 * $42.34 MTS: $2,185,440,000 = 78,500,000 * $27.84 Return on Equity = Net Income/Shareholder's Equity Telus: 0.191 = $1,463,000,000 / $7,678,000,000 MTS: 0.109 = $116,500,000 / $1,067,700,000
  • 12.
    JRE300H1F–Fundamentals of Accountingand Finance Page 12 of 13 APPENDIX B: CALCULATION OF PEER ANALYSIS RATIOS LTM Tangible Book Value / Share Price Telus: -0.152 = $-6.44 / $42.34 MTS: 0.317 = $8.82 / $27.84 Industry Average: -0.479 = $-11.69 / $24.40 Share Price / Diluted EPS Telus: $17.72 = $42.34 / 2.39 MTS: $18.56 = $27.84 / 1.50 Industry Average: $21.79 = $24.40 / 1.12 Share Price / Tangible Book Value Telus: -6.575 = $42.34 / $-6.44 MTS: 3.156 = $27.84 / $8.82 Industry Average: -2.087 = $24.40 / $-11.69
  • 13.
    JRE300H1F–Fundamentals of Accountingand Finance Page 13 of 13 APPENDIX C: CALCULATION OF DUPONT EQUATION RATIOS Leverage Ratio = Total Assets / Equity Telus: 3.115 = $23,217,000,000 / $7,454,000,000 MTS: 2.555= $2,688,000,000 / $1,052,000,000 ROE = Net Profit Margin * Asset Turnover Ratio * Leverage Ratio Telus: 0.1973 = 0.1195 * 0.53 * 3.115 MTS: 0.1257 = 0.082 * 0.6 * 2.555