
Recommended
Recommended
More Related Content
What's hot
What's hot (12)
Similar to 29 mn dot 2006 c13 barandaspuente original.
Similar to 29 mn dot 2006 c13 barandaspuente original. (20)
More from Sierra Francisco Justo
More from Sierra Francisco Justo (20)
Recently uploaded
Recently uploaded (20)
29 mn dot 2006 c13 barandaspuente original.
- 1. MAY 2006 LRFD BRIDGE DESIGN 13-1 13. RAILINGS 13.1 Materials 13.2 Design Requirements Section 13 of the LRFD Specifications addresses the design of railings. “Railings” is used as a generic term in the specifications. Railings include traffic safety barriers as well as median barriers, bicycle, and pedestrian railings. The design requirements for railings utilized on Mn/DOT bridges have undergone changes in recent years as the Federal Highway Administration (FHWA) established crash-testing requirements and the AASHTO Specifications were revised accordingly. Additionally, the desire for more attractive railings has influenced the style of railings on projects where aesthetics is a major consideration. Accidents involving objects thrown from overpasses onto traffic below has led to the adoption of protective screening requirements. The rapid increase in bicycle trails and traffic has increased attention on bicycle railings. This section of the LRFD Bridge Design Manual details our policies regarding the design of bridge railings for Mn/DOT projects. Reinforced concrete, steel, and timber are all used for railings. The majority of traffic railings are reinforced concrete. Bridges with timber decks on low volume secondary roads may have timber railings. Pedestrian and bicycle railings are typically galvanized steel that has been painted for aesthetics. The design of newly constructed bridge railings must conform to the requirements of Section 13 of the AASHTO LRFD Bridge Design Specifications. This specification gives geometric and strength requirements and also describes crash test levels. FHWA requires all bridges carrying traffic on the National Highway System (NHS) to be crash tested in accordance with NCHRP Report 350 Recommended Procedures for the Safety Performance Evaluation of Highway Features. There are six levels of service and testing depending on vehicle size and speed. A list of crash tested railings is found on the following FHWA Web sites: • http://www.fhwa.dot.gov/bridge/bridgerail/ • http://safety.fhwa.dot.gov/roadway_dept/road_hardware/bridgerailings.htm • http://safety.fhwa.dot.gov/roadway_dept/road_hardware/longbarriers.htm
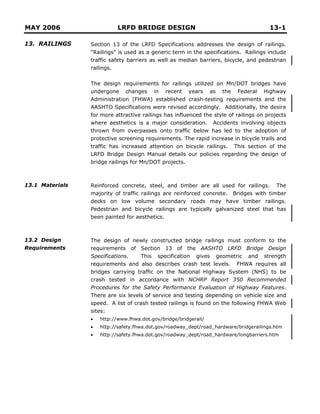
- 2. MAY 2006 LRFD BRIDGE DESIGN 13-2 Crash testing requirements may be waived if the railing in question is similar in geometrics to an approved crash tested rail and an analytical evaluation shows the railing to be crash worthy. This allows minor changes to crash tested railings without having to go through the time and expense of crash testing. For bridges on the NHS any such evaluation must be approved by the FHWA. Crash testing has shown that during impact vehicles slide along the top of the railing and parts of the vehicle, especially the boxes on trucks, extend beyond the face of the railing a considerable distance. The envelope of the vehicle encroachment beyond the face of railing is known as the zone of intrusion. Attachments to bridge railings, such as architectural metal railings or objects just behind the railing (such as light poles), must address safety concerns presented by this encroachment, which include: 1) Snagging - which can cause the attachment or the vehicle hood to penetrate the occupant compartment. 2) Spearing – objects, such as a horizontal railing member, penetrating windshields and injuring occupants. 3) Debris falling onto traffic below. A Midwest Roadside Safety Facility report, titled Guidelines for Attachment to Bridge Rails and Median Barriers, February 26, 2003, identifies zones of intrusion for several types of railings. Figure 13.2.1 shows the zone of intrusion for a Test Level 4 barrier. Generally attachments within the zone of intrusion shall be designed to break away before severely damaging the vehicle, contain any debris from damaging traffic below, and have no members (such as rail ends) that might spear the occupant compartment of the vehicle. Ends of rails shall be sloped at 45 degrees or less to top of barrier to reduce the chance of spearing. Posts shall be set back from the face of railing to minimize snagging. (See Sections 13.2.1 and 13.2.3 for setback requirements.) Railing designs shall include consideration of safety, cost, aesthetics and maintenance. Safety shapes (Types J and F) were developed to minimize damage to vehicles, as well as to contain and redirect vehicles back onto the roadway, and have low initial and maintenance costs. Use of designs that allow for easy replacement of damaged sections and use of standard railings can minimize maintenance costs since replacement components can be stockpiled. Three general classes of bridge railings are Traffic Railings, Pedestrian or Bicycle Railings, and Combination Railings. Bridge cross sections showing
- 3. MAY 2006 LRFD BRIDGE DESIGN 13-3 these three classes are shown in Figure 13.2.2. Railing classes are further defined in the following sections. Also, refer to Table 13.2.1 for guidance on standard rail applications. 1 Figure 13.2.1 Intrusion Zones for TL-4 Barriers 1 Reproduced from Keller, Sicking, Faller, Polivka & Rhode, Guidelines for Attachments to Bridge Rails and Median Barriers, (Midwest Roadside Safety Facility, February 26, 2003), page 24.
- 4. MAY 2006 LRFD BRIDGE DESIGN 13-4 Figure 13.2.2
- 5. MAY 2006 LRFD BRIDGE DESIGN 13-5 Comment 2'-8"tall 3'-6"tall (Givesaddedprotectionto motoristsonhighspeed,high curvatureroadways.Modify standardtoremovesidewalk.) 3'-6"tall (Theadditionalheightistoprotect abicycleriderfromfallingoverthe railingintotraffic.) 4'-8"tall 2'-8"tall 2'-8"tall (Forstageconstruction,eachhalfof barriermeetsTL-4standard.) 4'-8"tall 4'-8"tall 4'-8"tall (Separationallowsbothsidestobe slipformed.) Application TrafficOnly HighProtectionAreawhere Dc>5°andSpeed>40mph. Betweensidewalkandroadway wheretheshoulderis<6'. Bridgeswithdesignatedbikepath orwhereglarescreenisrequired. TrafficOnly Bridgeswithalongitudinaljoint betweenroadways.(Usuallythe bridgeisverywideoristobe constructedinstages.) TrafficOnly TrafficOnly Usewhereroadwaysareat differentelevations.(Usuallyon superelevatedbridges.) Speed Limit All >40mph All All All All All All All Test Level TL-4 TL-5 TL-5 TL-5 TL-4 TL-4 TL-4 TL-4 TL-4 Description ConcreteBarrier(TypeF,TL-4) 5-397.114:SeparateEndPostw/oW.C. 5-397.115:IntegralEndPostw/oW.C. 5-397.116:SeparateEndPostw/W.C. 5-397.117:IntegralEndPostw/W.C. ConcreteBarrier(TypeF,TL-5) 5-397.122:IntegralEndPostw/W.C. 5-397.124:IntegralEndPostw/oW.C. ConcreteBarrier(TypeF,TL-5)w/Sidewalk 5-397.125:IntegralEndPostw/W.C. 5-397.126:IntegralEndPostw/oW.C. ConcreteBarrier(TypeF,TL-5) 5-397.128:IntegralEndPostw/W.C. 5-397.129:IntegralEndPostw/oW.C SolidMedianBarrier(TypeF,TL-4) 5-397.130:w/W.C. SplitMedianBarrier(TypeF,TL-4) 5-397.131:w/W.C. SolidMedianBarrierandGlareScreen(TypeF,TL-4) 5-397.132:w/W.C. SplitMedianBarrierandGlareScreen(TypeF,TL-4) 5-397.135:w/oW.C. 5-397.136:w/W.C OffsetSplitMedianBarrierandGlareScreen(TypeF, TL-4) 5-397.137:w/W.C. TABLE13.2.1:StandardRailApplications Rail Type Traffic
- 6. MAY 2006 LRFD BRIDGE DESIGN 13-6 Comment 1'-3"metalrailingon1'-9"parapet (Designermustmodifydetailfor separateendpostornoW.C.) 2'-8"tall 2'-4"parapetand6'metalrailwith chainlinkfabric. 2'-4"parapetwith2'-2"metalrail (Modifyforseparateendpost.) Topofmetalrailing1'-10½"above topof2'-8"TypeFrail(Totalheight of4'-6"+ meetsbicyclestandard.) 2'-4"parapetand5'-8½"metalrail withchainlinkfabric 5'tallchainlinkfence 8'tallchainlinkfence Application TrafficOnly,whereanaesthetic railingisdesired. TrafficOnly Highwaybridgeswithwalks.This railisusedontheoutsideedgeof walkandmeetsbicycleand protectivescreeningrequirements. Outsideedgeofwalkonhighway bridgeswithsidewalkswhere bicycletrafficonthewalkis expectedandprotectivescreening isnotrequired. AttachmenttoTypeFrailforuse wheresignificantbicycletrafficwill beusingroadwayshoulder. Highwaybridgeswithwalks.This railisusedontheoutsideedgeof walkandmeetsbicycleand protectivescreeningrequirements. Pedestrianbridgesorsidewalks separatedfromroadwaysbya trafficbarrier. Pedestrianbridgesorsidewalks separatedfromroadwaysbya trafficbarrier. Speed Limit All All ≤40mph ≤40mph All ≤40mph Yes Yes Test Level TL-4 TL-4 TL-2 TL-2 TL-4 TL-2 Ped.& Bike Ped.& Bike Description ConcreteBarrier(TypeP-2,TL-4)andStructural TubeRailing(TypeT-1) 5-397.157:w/IntegralEndPost ConcreteBarrier(TypeP-4,TL-4) 5-397.173:IntegralEndPostw/W.C. ConcreteBarrier(TypeP-1,TL-2)andWireFence (DesignW-1) 5-397.119:IntegralEndPost 5-397.120:SeparateEndPost ConcreteBarrier(TypeP-1,TL-2)andMetalRailing forBikeway(TypeM-1) 5-397.154:IntegralEndPost StructuralTubeRailing(DesignT-2) 5-397.158 ConcreteBarrier(TypeP-1,TL-2)andStructural TubeRailingwithFence(DesignT-3) 5-397.212 5'WireFence(DesignW-1)forPedestrianBridges 5-397.202 8'WireFenceforPedestrianWalks 5-397.205 TABLE13.2.1:StandardRailApplications(cont.) Rail Type NOTES: •CrashtestinglevelsrefertoNCHRPReport350.Thestructuraltubetrafficrail(BridgeDetailsManualPartII,Fig.5-397.157)andbicyclerailattachment toTypeFrail(BridgeDetailsManualPartII,Fig.5-397.158)weredevelopedbyMinnesotaandcrashtestedthroughthepooledfundprogram. Combinationrailingswiththe2'-4"parapethavebeenjudgedtomeetcrashTestLevel2(TL-2)bycomparisontoothercrashtestedverticalfacerailings. •Railingheightsaremeasuredtothefinishedsurface(topofwearingcourse). •InformationoncurrentcostsoftheserailingsmaybeobtainedfromtheBridgeEstimatingUnit. •Combinationrailingsmayalsobeusedasbicycle/pedestrianrailings.The2'-4"parapetheightpermitsawiderspacingofspindles(6"openingsrather thanthe4"openingsrequiredupto27"abovethefinishedsurface). Traffic Combination (TrafficandPed./Bicycle) Ped./Bicycle
- 7. MAY 2006 LRFD BRIDGE DESIGN 13-7 Comment 2'-23 /4"metalrailon2'-4"parapet (Sheetismetric.) 3'-9"metalrailon2'-4"parapet (DevelopedbyCityofMinneapolis foruseonbridgesintheircity.) 4'-6"metalrailon2'-4"parapet (BridgeNo.23022hasa2'-2" heightofmetalrailforusewhere protectivescreeningisnotneeded.) 3'-9"metalrailon2'-4"parapet 5'-8'to9'-2"metalrailon2'-4" parapet 5'-51 /2"metalrailon2'-4"parapet (Sheetismetric.) 5'-8"metalrailon2'-4"parapet withchainlinkfabric Application Outsideedgeofwalkonhighway bridgeswithsidewalkswhere bicycletrafficonthewalkis expectedandprotectivescreening isnotrequired. Highwaybridgeswithwalks.This railisusedontheoutsideedgeof walkandmeetsbicycleand protectivescreeningrequirements. Highwaybridgeswithwalks.This railisusedontheoutsideedgeof walkandmeetsbicycleand protectivescreeningrequirements. Highwaybridgeswithwalks.This railisusedontheoutsideedgeof walkandmeetsbicycleand protectivescreeningrequirements. Highwaybridgeswithwalks.This railisusedontheoutsideedgeof walkandmeetsbicycleand protectivescreeningrequirements. Highwaybridgeswithwalks.This railisusedontheoutsideedgeof walkandmeetsbicycleand protectivescreeningrequirements. Highwaybridgeswithwalks.This railisusedontheoutsideedgeof walkandmeetsbicycleand protectivescreeningrequirements. Speed Limit ≤40mph ≤40mph ≤40mph ≤40mph ≤40mph ≤40mph ≤40mph Test Level TL-2 TL-2 TL-2 TL-2 TL-2 TL-2 TL-2 Description CloquetRailing BridgeNo.09008and09009 ConcreteBarrier(TypeP-3,TL-2)andOrnamental MetalRailing(TypeM-2) St.PeterRailing BridgeNo.27R05 TH100CorridorStandard BridgeNo.27285 TH212CorridorStandard BridgeNo.27148 TH610CorridorStandard OrnamentalMetalRailingTypeDWG BridgeNo.27222 VictoriaStreetRailing BridgeNo.62823 TABLE13.2.2:Non-StandardRailApplications Rail Type Combination (TrafficandPed./Bicycle)
- 8. MAY 2006 LRFD BRIDGE DESIGN 13-8 Comment 3'-6"tall(Sheetismetric.) 4'-6"tall(Sheetismetric.) 4'-6"tall(Sheetismetric.) Application Pedestrianbridgesorsidewalks separatedfromroadwaysbya trafficbarrier. Pedestrianbridgesorsidewalks separatedfromroadwaysbya trafficbarrier. Pedestrianbridgesorsidewalks separatedfromroadwaysbya trafficbarrier. Speed Limit N/A N/A N/A Test Level Ped. Ped.& Bike Ped.& Bike Description GooseberryFallsSuspendedWalkwayRail BridgeNo.38010 LexingtonRail BridgeNo.62823 St.PeterRail BridgeNo.40002 TABLE13.2.2:Non-StandardRailApplications(cont.) Rail Type NOTES: •CrashtestinglevelsrefertoNCHRPReport350.Combinationrailingswiththe2'-4"parapethavebeenjudgedtomeetcrashTestLevel2(TL-2)by comparisontoothercrashtestedverticalfacerailings. •Railingheightsaremeasuredtothefinishedsurface(topofwearingcourse). •InformationoncurrentcostsoftheserailingsmaybeobtainedfromtheBridgeEstimatingUnit. •Combinationrailingsmayalsobeusedaspedestrian/bicyclerailings.The2'-4"parapetheightpermitsawiderspacingofspindles(6"openingsrather thanthe4",whichisrequiredinthelower27"). Pedestrian/Bicycle
- 9. MAY 2006 LRFD BRIDGE DESIGN 13-9 13.2.1 Traffic Railing Traffic railings are designed to contain and safely redirect vehicles. Requirements based on speed are as follows. 1) High Speed Roadways with a Design Speed > 40 mph Mn/DOT requires crash testing to Test Level 4 as the minimum standard for these roadways. Test Level 4 is run with a small car and a pickup truck at 60 mph and a single unit van truck impacting at 50 mph. This railing will normally be the 32" high Type F barrier (Bridge Details Manual Part II, Figure 5-397.114-117). Where aesthetic needs warrant, the tubular traffic railing (Bridge Details Manual Part II, Figure 5-397.157) is an acceptable alternative that provides an increased viewing opportunity to drivers crossing the bridge. It consists of a structural tube and posts mounted to the top of a 1'-9" high concrete base. Note, however, that the tubular traffic railing has higher initial and maintenance costs than the Type F barrier. Consult the Preliminary Bridge Unit for additional acceptable railings. Mn/DOT has developed a bicycle railing attachment to the Type F barrier for use where the bridge shoulders carry a bicycle route as defined in the Mn/DOT State Bicycle Transportation System Plan or another recognized authority. This attachment (Bridge Details Manual Part II, Figure 5-397.158) adds height to the railing to protect bicycle riders and has been crash tested to Test Level 4. It has a cable system inside the rail tubes that will contain the rail pieces in the event of an accident. It also uses weakened posts designed to lessen the impact to vehicles in the event of a hit. This railing may be applied to other traffic barriers provided that the same or greater offset distance to the face of metal rail is provided and the post attachment has the same or greater strength. The cable system must be maintained even if there is no traffic below as the cables act to keep the entire rail system intact during a crash. The zone of intrusion (see Section 13.2 for definition) shall be kept free of rail attachments or other features unless they have been crash tested or an analytical evaluation has shown them to be crash worthy. Exceptions to this policy include noise walls and safety features such as signs or lights. Note that light poles shall be located behind the back of the barrier. When noise walls are attached, consider using a higher Type F barrier to lessen the risk. The zone of intrusion for a TL-4 railing is shown in Figure 13.2.1. A more stringent rail design may be considered on a case-by-case basis for bridges with high design speeds, high truck volume, and curvature or other site-specific safety considerations. Generally a Test Level 5 railing should be considered for these sites. Test Level 5
- 10. MAY 2006 LRFD BRIDGE DESIGN 13-10 includes a small car and a pickup truck traveling at 60 mph plus a van-type tractor trailer impacting at 50 mph. As a guide, a 42" high Type F barrier that meets TL-5 requirements is recommended for bridges having a horizontal curvature of 5 degrees and sharper on a roadway where the design speed is 45 mph or higher. The Preliminary Bridge Plans Engineer will designate the rail design on the Preliminary Bridge Plan. 2) Low Speed Roadways with a Design Speed 40≤ mph Mn/DOT requires crash testing to Test Level 2 as the minimum standard for these roadways. Test Level 2 is run with a small car and pickup truck both impacting at a speed of 45 mph. Normally these railings will be the same as used for higher speeds, usually the Type F concrete barrier, but with the reduced level required for crash testing more options are available. Consult the Preliminary Bridge Unit for additional acceptable railings. If the addition of an ornamental metal railing is desired on the top of the traffic railing, a 32" high vertical faced concrete barrier (see Bridge Details Manual Part II, Figure 5-397.173) shall be used rather than the Type F barrier. The vertical face will cause more damage to a vehicle for minor hits but reduces the tendency for the vehicle to climb the face or roll over and will keep the vehicle back from the metal rail. A small 2" wide by 6" high curb is provided at the base to minimize snowplow damage to the barrier. For design speeds of 35 mph and below a metal railing may be used on the top of the concrete barrier with no minimum offset required, as it is unlikely that vehicles will contact the metal portion.2 With a design speed of 40 mph the front face of the metal railing shall be offset a minimum of 9" from the face of barrier at the top of concrete.3 It is strongly recommended that a smooth face be used on the highway side of concrete barriers. Aesthetic treatments on the highway face increase the risk of vehicle snagging. In addition, in this environment the aesthetics treatment will routinely experience vehicle hits, snowplow scrapes, and high exposure to salt. As a result, their performance will be greatly reduced, causing increased maintenance costs. 2 Reproduced from Keller, Sicking, Faller, Polivka & Rhode, Guidelines for Attachments to Bridge Rails and Median Barriers, (Report dated February 26, 2003), pages 3 and 27. 3 Reproduced from Keller, Sicking, Faller, Polivka & Rhode, Guidelines for Attachments to Bridge Rails and Median Barriers, (Report dated February 26, 2003), page 15 and 16. 9" offset at 40 mph judged acceptable based on 12" offset at 45 mph.
- 11. MAY 2006 LRFD BRIDGE DESIGN 13-11 13.2.2 Pedestrian/ Bicycle Railing 13.2.3 Combination Railing Pedestrian or bicycle railings are generally located at the outside edge of a bridge sidewalk and are designed to safely contain pedestrians or bicyclists. AASHTO specifications require pedestrian railings to be at least 3'-6" in height and bicycle railings to be at least 4'-6" in height. The height is measured from the top of walkway to top of the highest horizontal rail component. Openings between members of a pedestrian railing shall not allow a 4" sphere to pass through the lower 27" of the railing and a 6" sphere should not pass through any openings above 27". This is more restrictive than AASHTO and is intended to prevent small children from slipping through the railing. The International Building Code requires a 4" maximum opening. Combination railings are dual purpose railings designed to contain both vehicles and pedestrians or bicycles. These railings are generally located at the outside edge of a bridge sidewalk. A raised sidewalk is used to clearly define the walkway area and keep roadway drainage off the walkway. The sidewalk curb offers some protection to pedestrians from errant vehicles entering the walkway. There is no other barrier between the roadway and the sidewalk. Combination railings are applicable for design speeds of 40 mph and under. Mn/DOT requires crash testing to Test Level 2 for these railings and the strength and geometrics requirements for bicycle or pedestrian railings also apply. Combination railings will normally consist of a 2'-4" high concrete parapet with a fence or ornamental metal railing mounted on the top. The concrete parapet serves to contain traffic and has been judged to meet crash Test Level 2. The metal railing must comply with the strength and geometric requirements for bicycle or pedestrian railings. A non-crash tested metal railing may be used on the top of the concrete barrier, as it is unlikely that vehicles will make contact with the metal portion. For typical applications, the highway face of a concrete parapet shall be relatively smooth for ease of construction (slipforming) and maintenance. Where aesthetic needs warrant it, beveled recesses up to 2" deep may be allowed for inset panels and beveled form liner textures. Concrete posts above the parapet are acceptable but they may not project in front of the parapet. For design speeds greater than 40 mph, a traffic railing is required between the roadway and sidewalk or bikeway. Use a 32" high Type F barrier for the traffic railing when the shoulder is 6'-0" or greater in width. If the roadway shoulder is less than 6'-0", use a 42" Type F
- 12. MAY 2006 LRFD BRIDGE DESIGN 13-12 13.2.4 Strength of Standard Concrete Barriers barrier for added protection. Metal railings shall not be placed on top of a traffic railing between a sidewalk and a roadway. Although metal railings may somewhat increase protection for bicyclists, they are a risk hazard to vehicles. Barrier resistance values have been determined for the standard Mn/DOT concrete barriers and are shown in Table 13.2.4.1. They are based on using both near and far face reinforcement as tension reinforcement. These values can be used when analyzing deck overhangs to determine reinforcement requirements. (See Section 9.2.4J for an overhang reinforcement design example.)
- 13. MAY 2006 LRFD BRIDGE DESIGN 13-13 Rw (kips) 124.1 122.9 128.8 131.4 128.8 131.4 128.8 131.4 91.1 106.6 107.5 InteriorPanel Lc (ft) 9.9 10.2 14.3 14.0 14.3 14.0 14.3 14.0 12.1 9.0 9.2 Rw (kips) 59.2 57.2 128.5 133.6 128.5 133.6 128.5 133.6 54.0 55.8 61.1 EndPanel Lc (ft) 4.6 4.6 9.3 9.2 9.3 9.2 9.3 9.2 4.5 4.1 4.2 TABLE13.2.4.1:ResistanceValuesforStandardConcreteBarriers Description ConcreteBarrier(TypeF,TL-4) 5-397.114:SeparateEndPostw/oW.C. 5-397.115:IntegralEndPostw/oW.C. ConcreteBarrier(TypeF,TL-4) 5-397.116:SeparateEndPostw/W.C. 5-397.117:IntegralEndPostw/W.C. ConcreteBarrier(TypeF,TL-5) 5-397.122:IntegralEndPostw/W.C. ConcreteBarrier(TypeF,TL-5) 5-397.124:IntegralEndPostw/oW.C. ConcreteBarrier(TypeF,TL-5)w/Sidewalk 5-397.125:IntegralEndPostw/W.C. ConcreteBarrier(TypeF,TL-5)w/Sidewalk 5-397.126:IntegralEndPostw/oW.C. ConcreteBarrierandGlareScreen(TypeF,TL-5) 5-397.128:IntegralEndPostw/W.C. ConcreteBarrierandGlareScreen(TypeF,TL-5) 5-397.129:IntegralEndPostw/oW.C. SplitMedianBarrier(TypeF,TL-4) 5-397.131:w/W.C. SplitMedianBarrierandGlareScreen(TypeF,TL-4) 5-397.135:w/oW.C. SplitMedianBarrierandGlareScreen(TypeF,TL-4) 5-397.136:w/W.C.
- 14. MAY 2006 LRFD BRIDGE DESIGN 13-14 Rw (kips) 107.5 196.7 151.7 103.7 InteriorPanel Lc (ft) 9.2 9.0 9.9 9.2 Rw (kips) 61.1 87.7 76.8 50.4 EndPanel Lc (ft) 4.2 4.6 4.6 4.9 TABLE13.2.4.1:ResistanceValuesforStandardConcreteBarriers Description OffsetSplitMedianBarrierandGlareScreen(TypeF,TL-4) 5-397.137:w/W.C. ConcreteBarrier(TypeP-2,TL-4) 5-397.157:w/IntegralEndPost ConcreteBarrier(TypeP-4,TL-4) 5-397.173:IntegralEndPostw/W.C. ConcreteBarrier(TypeP-1,TL-2) 5-397.119 5-397.120 5-397.154 5-397.212
- 15. MAY 2006 LRFD BRIDGE DESIGN 13-15 13.2.5 Protective Screening 13.2.6 Architectural/ Ornamental Railings The addition of protective screening to bridge railings is a further Mn/DOT policy requirement. The practice of adding protective screening is common nationwide in response to accidents and fatalities that have occurred due to pedestrians throwing objects from overpasses onto vehicles below. Protective screening must be included in the design of new bridges that accommodate pedestrians when the bridge crosses a roadway or railroad, and also when railings are replaced on existing bridges as follows: • On bridges where a sidewalk is included in the design, incorporate a protective screening system in the design of the railing adjacent to the sidewalk. • On pedestrian bridges, place the protective screening on both sides of the bridge. The protective screening system will be, preferably, a chain link fence system or a railing system. The height of the fence or railing shall be 8'-0" above the top of the sidewalk. For sites with special aesthetic treatments involving ornamental railings a minimum height of 6'-0" will be allowed. However, it should be recognized that the lower railing height provides a reduced level of protection. The protective screening system shall not allow objects 6" or greater in diameter to pass through the fence or railing. In response to local requests, special railing designs have been incorporated in some projects to address aesthetic concerns. These ornamental architectural bridge railings have been utilized in lieu of standard combination railings for placement on the outboard side of bridge sidewalks. The Bridge Office will consider railing designs in addition to our standard railings for such locations and corridors. It is recommended that special railings incorporate features from the standard railings (such as connection details) as significant effort has gone into the development of these details. Mn/DOT participation in the cost of aesthetic railings is governed by the Mn/DOT Policy Manual of June 2001. Refer to these documents for more information: • Guidelines: Mn/DOT Policy and Procedures for Cooperative Construction Projects with Local Units of Government • Position Statement: Mn/DOT Policy and Procedures for Cooperative Construction Projects with Local Units of Government
- 16. MAY 2006 LRFD BRIDGE DESIGN 13-16 13.3 Design Examples Railings are included with other aesthetic costs of the bridge. Mn/DOT participation is limited to 5%, 7% or 15% of the cost of a basic bridge, depending on the aesthetic level of the bridge. Cost participation of architectural/ornamental railings on local bridges is generally funded up to the prorated cost of standard railing or chain link fence. Consult the State-Aid for Local Transportation Office for conditions on bridge funding eligibility. Two design examples follow. The first illustrates the design procedures associated with a conventional Type F barrier. The second design example illustrates the steps undertaken for the design of adhesive anchors to support a metal railing.
- 17. MAY 2006 LRFD BRIDGE DESIGN 13-17 A. Design Forces and Dimensions [13.7.3.2] 13.3.1 Type F Barrier Design Example This example illustrates a design check of the vertical reinforcing steel that ties a standard Mn/DOT Type F barrier to a concrete deck. The geometry of the barrier and the reinforcing bar sizes and types are illustrated in Bridge Details Part II Fig. 5-397.117. The configuration of the horizontal reinforcing bars in the railing is assumed fixed. The spacing of the vertical reinforcing steel is checked to ensure adequate capacity is provided. The design check uses the method described in LRFD Article A13.3.1. Mn/DOT’s Type F barrier satisfies the geometric height constraint of a TL-4 barrier and has satisfactorily passed crash testing to such a level. The design forces and dimensional limits for a TL-4 barrier presented in LRFD Table A13.2-1 are repeated below. Design Forces and Designations TL-4 Barrier tF Transverse (kip) 54 LF Longitudinal (kip) 18 VF Vertical/Down (kip) 18 tL and LL (ft) 3.5 VL (ft) 18 eH Minimum Height of Horizontal Loads (in) 32 H Minimum Height of Rail (in) 32 The design is based on yield line analysis methods and has three variables: • bM – the flexural capacity of the cap beam (if present) • wM – the flexural capacity of the railing about its vertical axis • cM – the flexural capacity of the railing about a horizontal axis LRFD Article 13.1 cautions designers that railings placed on retaining walls or spread footings may require investigation beyond that presented in this example. The governing or controlling yield line mechanism is assumed to form in the railing. If additional mechanisms with potentially lower load capacities are possible, designers should investigate them. The yield line mechanisms vary with rail location. Interior rail regions are assumed to have three yield lines. Two of the yield lines have tension on the inside of the railing and one has tension on the outside of the railing. See Figure 13.3.1.1, reproduced from LRFD Figure CA13.3.1-1. The assumed failure mechanism at the end of rail sections (near deflection joints, expansion joints, openings, etc.) has one yield line that produces tension on the inside face of the railing. See Figure 13.3.1.2, reproduced from LRFD Figure CA13.3.1-2.
- 18. MAY 2006 LRFD BRIDGE DESIGN 13-18 Figure 13.3.1.1 Yield Line Analysis for Interior Region Figure 13.3.1.2 Yield Line Analysis for End Region
- 19. MAY 2006 LRFD BRIDGE DESIGN 13-19 [CA13.3.1] B. Barrier Flexural Resistance Figure 13.3.1.3 contains a rail elevation detail that identifies the location of interior and end regions. The length of end regions and interior regions is dependent on the relative flexural capacities of the railing ( wM and cM ). The design example uses ceL to represent the length of end regions and ciL to represent the length of interior yield line mechanisms. Holding wM constant, rail sections with larger cM resistances have shorter and steeper yield line mechanisms. Designers should note that in addition to inclined yield lines, one-way cantilever resistance of the rail should be investigated for rail segments with lengths less than twice ceL . Three section details of a Type F barrier are presented in Figure 13.3.1.4. The top section presents typical reinforcement and geometry. The horizontal reinforcement consists of eight #13 bars. Two #16 bars are used for the vertical reinforcement. The R1601E bar is anchored in the deck and projects 10" into the rail. The R1602E bar is a closed stirrup that laps the R1601E bar. The center detail in Figure 13.3.1.4 labels the horizontal reinforcement and identifies the “d” dimension assumed in wM calculations. At any one yield line location four bars are assumed to provide flexural resistance and four bars are assumed available to carry shear loads via shear friction. The bottom detail in Figure 13.3.1.4 identifies the “d” dimension of the vertical reinforcement at different locations. These values are averaged to compute cM . Determine bM The Type F barrier has no additional beam section at its top. Consequently, the bM term is equal to zero in the rail resistance computations. Determine wM Using the center detail of Figure 13.3.1.4 the flexural capacity about a vertical axis is computed. Bars 1, 3, 5, and 7 are assumed effective for yield lines that produce tension on the inside face of the rail. Bars 2, 4, 6, and 8 are assumed effective for the case where the yield line has tension on the outside face of the rail.
- 20. APRIL 2005 LRFD BRIDGE DESIGN 13-20 Figure13.3.1.3
- 21. MAY 2006 LRFD BRIDGE DESIGN 13-21 Figure 13.3.1.4
- 22. MAY 2006 LRFD BRIDGE DESIGN 13-22 [5.7.3.2] [1.3.2.1] wM for Interior Region Capacities nMϕ for a typical interior region are listed in the following table. The lever arm dimension of the different bars is found by subtracting half the depth of the flexural compression block. ⎟ ⎠ ⎞ ⎜ ⎝ ⎛ −ϕ=ϕ 2 a dfAM ysn 0.1=ϕ (for Extreme Event Limit State) 2 s in20.0A = ksi60fy = in42.0 340.485.0 6020.04 bf85.0 fA ca c ystotal 1 = ⋅⋅ ⋅⋅ = ⋅′⋅ ⋅ =β= in21.0 2 0.42 2 a == BAR d (in) Lever Arm 2 a d − (in) niMϕ for Inside Face Tension (k-in) noMϕ for Outside Face Tension (k-in) 1 7.72 7.51 90.1 2 7.94 7.73 92.8 3 8.88 8.67 104.0 4 9.07 8.86 106.3 5 10.04 9.83 118.0 6 11.93 11.72 140.6 7 10.77 10.56 126.7 8 14.87 14.66 175.9 Totals 438.8 515.6 ft/ft-kip12.92 83.2 12/8.438 H M M ni wi =⎟ ⎠ ⎞ ⎜ ⎝ ⎛ = ⎟ ⎟ ⎠ ⎞ ⎜ ⎜ ⎝ ⎛ ϕ = ft/ft-kip15.18 83.2 12/6.515 H M M no wo =⎟ ⎠ ⎞ ⎜ ⎝ ⎛ = ⎟ ⎟ ⎠ ⎞ ⎜ ⎜ ⎝ ⎛ ϕ = For interior rail regions there is one outside tension yield line and two inside tension yield lines. Compute the average wM : ft/ft-kip13.7 3 15.18112.922 3 M1M2 M wowi wint = ⋅+⋅ = ⋅+⋅ =
- 23. MAY 2006 LRFD BRIDGE DESIGN 13-23 wM for End Region At end regions not all of the horizontal bars will be fully developed by the time they intersect with the anticipated yield line. Assume the ceL dimension is at least 4.0 feet. The #13 bars have a development length of 12". Figure 13.3.1.5 shows the reinforcement in the end region of the rail in relation to the assumed yield line. Figure 13.3.1.5 Similar to the interior region, the lever arm is found by subtracting off one half of the depth of the flexural compression block. ⎟ ⎠ ⎞ ⎜ ⎝ ⎛ −ϕ=ϕ 2 a dfAM ysn 0.1=ϕ (for Extreme Event Limit State) 2 s in20.0A = ksi60fy = in32.0 340.485.0 6062.0 bf85.0 fA ca c ystotal 1 = ⋅⋅ ⋅ = ⋅′⋅ ⋅ =β= in16.0 2 0.32 2 a ==
- 24. MAY 2006 LRFD BRIDGE DESIGN 13-24 Capacities nMϕ for the end region are listed in the following table. BAR Embedded Length (in) Bar Fraction Developed Developed Bar Area sA (in 2 ) d (in) Lever Arm 2 a d − (in) nMϕ for Inside Face Tension (k- in) 1 36 1.00 0.20 7.72 7.56 90.7 3 24.9 1.00 0.20 8.88 8.72 104.6 5 10.9 0.91 0.18 10.04 9.88 106.7 7 2.1 0.18 0.04 10.77 10.61 25.5 Total 0.62 Total 327.5 wM is found by averaging the capacity of the rail over the height of the rail. 6.9 83.2 12/5.327 H M M n wend =⎟ ⎠ ⎞ ⎜ ⎝ ⎛ =⎟ ⎠ ⎞ ⎜ ⎝ ⎛ ϕ = kip-ft/ft Determine cM The Type F barrier does not have a uniform thickness. Consequently the “d” dimension of the vertical reinforcement varies with the vertical location in the rail. Averaged “d” dimensions are used to compute cM separately for the top and bottom sections. Then a weighted average of the two sections is taken to determine cM for the entire rail section. Using “d” dimensions labeled in the bottom detail of Figure 13.3.1.4, the average “d” dimensions can be found. Location d (in) Average d (in) Top 7.97 Mid Top 10.50 9.24 Mid Bottom 11.02 Bottom 14.25 12.64 cM for Interior Region The internal flexural lever arm is dependent on the amount of reinforcement in the cross section. The maximum spacing of vertical steel in interior regions is 12". Use a 12" vertical steel spacing to evaluate the interior rail region. For the top portion, /ftin31.0A 2 stop = in46.0 0.120.485.0 6031.0 bf85.0 fA ca c ystop 1top = ⋅⋅ ⋅ = ⋅′⋅ ⋅ =β=
- 25. MAY 2006 LRFD BRIDGE DESIGN 13-25 ( )( ) ⎟ ⎠ ⎞ ⎜ ⎝ ⎛ ⋅⎟ ⎠ ⎞ ⎜ ⎝ ⎛ −⋅=⎟ ⎟ ⎠ ⎞ ⎜ ⎜ ⎝ ⎛ −ϕ=ϕ= 12 1 2 46.0 24.96031.00.1 2 a dfAMM top topystopnctop 0.14= kip-ft/ft For the bottom portion, the R1601E bars are not fully developed at the rail/deck interface. Determine bar development fraction: For a straight #16 bar, the basic development length dbl is: ( )( ) in63.11 4 600.311.25 f fA1.25 c yb db == ′ =l or ( )( ) in00.1560625.04.0fd4.0 ybdb ===l GOVERNS Using modification factors for epoxy coating (1.2) and bar spacing > 6" with > 3" cover (0.8), the straight bar development length is: ( )( ) in40.1415008.02.1db ==l For a hooked #16 bar, the basic development length hbl is: ( ) in88.11 4 0.62538.0 f d38.0 c b hb == ′ ⋅ =l Using modification factors for epoxy coating (1.2) and cover (0.7), the hooked bar development length is: ( )( ) in98.988.117.02.1dh ==l Therefore, the benefit derived from the hook is: in42.498.940.14 =− The R1601E bar is hooked with a vertical embedment of 5.18 in. Then the development fraction is: 67.0 40.14 42.418.5 Fdev = + = The required extension beyond the 90° bend for a standard hook (A or G dimension) is 10" for a #16 bar. The R1601E bar has an extension of 18". Because of this extra extension and the fact that the 18" extension will have to pull through the top mat of reinforcement in order for the bar to fail, assume a higher development fraction 75.0Fdev = .
- 26. MAY 2006 LRFD BRIDGE DESIGN 13-26 Then ( ) 23.031.075.0Asbot == in2 /ft in34.0 12485.0 6023.0 bf85.0 fA ca c ysbot 1bot = ⋅⋅ ⋅ = ⋅′⋅ ⋅ =β= in ⎟⎟ ⎠ ⎞ ⎜⎜ ⎝ ⎛ −ϕ=ϕ= 2 a dfAMM bot botysbotncbot ( )( ) 3.14 12 1 2 34.0 64.126023.00.1 =⎟ ⎠ ⎞ ⎜ ⎝ ⎛ ⎟ ⎠ ⎞ ⎜ ⎝ ⎛ −= kip-ft/ft ( ) ( ) 1.14 83.2 00.13.1483.10.14 M intc = + = kip-ft/ft cM for End Region The end region has nine A16 and nine R16 bars in the end 4.0 feet of the rail. For the last R16 bar, due to the small amount of bar extending above the yield line, consider only 8 bars to be effective in resisting load. Then, the average 62.0Astop = in2 /ft 91.0 12485.0 6062.0 bf85.0 fA ca c ystop 1top = ⋅⋅ ⋅ = ⋅′⋅ ⋅ =β= in ( )( ) ⎟ ⎠ ⎞ ⎜ ⎝ ⎛ ⎟ ⎠ ⎞ ⎜ ⎝ ⎛ −⋅=⎟ ⎟ ⎠ ⎞ ⎜ ⎜ ⎝ ⎛ −⋅ϕ=ϕ= 12 1 2 91.0 24.96062.00.1 2 a dfAMM top topystopnctop 2.27= kip-ft/ft The average effective ( ) 47.062.075.0Asbot == in2 /ft 69.0 12485.0 6047.0 bf85.0 fA ca c ysbot 1bot = ⋅⋅ ⋅ = ⋅′⋅ ⋅ =β= in ( )( ) ⎟ ⎠ ⎞ ⎜ ⎝ ⎛ ⎟ ⎠ ⎞ ⎜ ⎝ ⎛ −⋅=⎟⎟ ⎠ ⎞ ⎜⎜ ⎝ ⎛ −⋅ϕ=ϕ= 12 1 2 69.0 64.126047.00.1 2 a dfAMM bot botysbotncbot 9.28= kip-ft/ft Then ( ) ( ) 8.27 83.2 00.19.2883.12.27 Mcend = + = kip-ft/ft
- 27. MAY 2006 LRFD BRIDGE DESIGN 13-27 D. Shear Capacity Check [Eqn A13.3.1-3] [5.8.4] C. Flexural Capacity Check [Eqn A13.3.1-2] [Eqn A13.3.1-1] Eqn A13.3.1-4 With wM and cM computed for an interior and end region, the resistance of the railing can be computed with the equations in LRFD Article A13.3.1. Check the Capacity of an Interior Region With 0M intb = , 7.13M intw = kip-ft/ft and 1.14M intc = kip-ft/ft, the length of the yield line mechanism and the resistance of the mechanism can be found: ( ) ft8.9 M HMMH8 2 L 2 L L cint wintbint 2 tt ci =⎥ ⎦ ⎤ ⎢ ⎣ ⎡ ⋅+⋅⋅ +⎟⎟ ⎠ ⎞ ⎜⎜ ⎝ ⎛ += kips0.98 H LM HM8M8 LL2 2 R 2 cicint wintbint tci wi = ⎟ ⎟ ⎠ ⎞ ⎜ ⎜ ⎝ ⎛ ⋅ +⋅⋅+⋅⎟ ⎟ ⎠ ⎞ ⎜ ⎜ ⎝ ⎛ −⋅ = which, is greater than the 54 kip extreme event design load. Check the Capacity of the End Region With 0Mbend = , 6.9Mwend = kip-ft/ft and 8.27Mcend = kip-ft/ft, the length of the yield line mechanism and the resistance of the mechanism can be found: ft2.4 M HMM H 2 L 2 L L cend wendbend 2 tt ce =⎟ ⎟ ⎠ ⎞ ⎜ ⎜ ⎝ ⎛ ⋅+ ⋅+⎟⎟ ⎠ ⎞ ⎜⎜ ⎝ ⎛ += kips8.81 H LM HMM LL2 2 R 2 cecend wendbend tce we = ⎟ ⎟ ⎠ ⎞ ⎜ ⎜ ⎝ ⎛ ⋅ +⋅+⎟ ⎟ ⎠ ⎞ ⎜ ⎜ ⎝ ⎛ −⋅ = which, is also greater than the required load capacity of 54 kips. The other end regions are to be checked similarly. Use shear friction methods to evaluate the shear capacity of the joint between the deck and railing. Assume that tF and LF occur simultaneously. The resultant shear force is: kips9.561854FFV 222 L 2 tres =+=+= The basic shear capacity equation for a section using shear friction is: )]Pf(AA[cV cyvfcvn +⋅μ+⋅⋅ϕ=ϕ
- 28. MAY 2006 LRFD BRIDGE DESIGN 13-28 E. Summary Neglect cohesion and the small permanent compression across the interface due to selfweight. Conservatively assume that the interface between the railing and the deck is not roughened. The appropriate of friction factor μ is 0.60. Substitute resV for nVϕ rearranging the remaining terms, and solve for the required area of reinforcement: 2 yv res vfreq in1.58 600.601.0 56.9 fμ v A =⎟ ⎠ ⎞ ⎜ ⎝ ⎛ ⋅⋅ = ⎟ ⎟ ⎠ ⎞ ⎜ ⎜ ⎝ ⎛ ⋅⋅ϕ = The required number of #16 bar legs is: legs1.5 31.0 58.1 A A b freqv =⎟ ⎠ ⎞ ⎜ ⎝ ⎛ ⎟ ⎟ ⎠ ⎞ ⎜ ⎜ ⎝ ⎛ Check the interior region first. Assuming the #16 bars are at the maximum spacing of 12" and the ciL dimension is 9.9 feet, 10 bars will be provided. At the end region, nine #16 bars are provided in the end 4.2 feet ( ceL ). Both interior and end regions have adequate shear capacity at the deck railing interface. When checked in accordance with the procedure shown within this example, the capacity of the end regions adjacent to the expansion joint and deflection joints did not meet the required 54 kip load capacity. Because the neutral axis is located very close to the outside face of the rail for determination of both wM and cM , all of the regions were reanalyzed to take advantage of the additional capacity provided by the outside face reinforcement. Therefore, in the second analysis, both the inside face rail reinforcement and the outside face rail reinforcement were included in the determination of the rail capacity. The revised values for the F-rail are: Interior Region: With wearing course Without wearing course ft2.10L ci = ft9.9L ci = kip9.122R wi = kip1.124R wi = End Region: With wearing course Without wearing course ft6.4Lce = ft6.4Lce = kip2.57Rwe = kip2.59Rwe =
- 29. APRIL 2005 LRFD BRIDGE DESIGN 13-29 Adequate vehicle collision load capacity is provided with the default reinforcing provided in Bridge Details Part II Figure 5-397.117. (See Figure 13.3.1.6.)
- 30. MAY 2006 LRFD BRIDGE DESIGN 13-30 Figure13.3.1.6
- 31. MAY 2008 LRFD BRIDGE DESIGN 13-31 13.3.2 Adhesive Anchor Design Example The objective of this example is to design adhesive anchors (as an alternate to the cast-in-place anchorage) to secure a metal railing atop a concrete barrier. The railing under consideration is Mn/DOT 5-397.154 “Metal Railing for Bikeways (Type M-1) and Concrete Parapet (Type P-1) (with Integral End Post)”. The standard anchorage elements beneath each vertical post are four cast-in-place 5 /8" x 8" anchor bolts. All steel components for the railing have a yield strength of 36 ksi. The concrete used for the parapet has a design compressive strength of 4 ksi. The example is structured in a top-down fashion. After determining the design loads, the railpost and base plate are checked. After that, the shear and tensile capacity of the anchors is computed. For each of the forces, the resistance of steel and concrete is determined individually. Figure 13.3.2.1
- 32. MAY 2006 LRFD BRIDGE DESIGN 13-32 [Eqn 13.8.2-1] [Table 3.4.1-1] B. Railpost Design Check A. Design Loads [6.12.2.2.4b] Reference material on the design of adhesive anchors is limited. The equations for concrete shear capacity and tension capacity, and modifiers for group effect and for edge effect presented in this example are based on material in Behavior and Design of Fastening to Concrete, Richard E. Klingner, University of Texas at Austin, 48th Annual Concrete Conference, University of Minnesota, December 3, 1998 and ACI 318, Appendix D. Reference material on the design of non-adhesive anchors can also be found in Chapter 6 of the PCI Design Handbook. Figure 13.3.2.1 presents the typical railpost detail for the railing. The maximum distance L between railposts is 10'-0". Section 13 of the LRFD Specifications covers bridge railings. Article 13.8.2 lists the loads to consider for the design of rail elements and posts for pedestrian and bicycle railings. Design railposts to resist concentrated design live load LLP applied at the height of the top rail element. kips70.010050.020.0L050.020.0PLL =⋅+=⋅+= Using a load factor of 1.75 for live load results in a design horizontal force of: kips23.170.075.1P75.1H LLu =⋅=⋅= Per Figure 13.3.2.1, the lever arm from top rail to top of concrete is 2.17 feet. The design moment at the bottom of the base plate is: ( ) ( ) 66.217.223.1dHM uupost =⋅=⋅= k-ft 9.31= kip-in Begin by checking the railpost. It must have adequate capacity to resist the design moment. By inspection, the rail elements provide adequate bracing to develop the yield moment of the section. Therefore, the capacity is: SFMM yyn ⋅== The railpost is a 1 /2" x 4" plate loaded about its strong axis. 33.1 6 45.0 6 db S 22 post = ⋅ = ⋅ = in3
- 33. MAY 2006 LRFD BRIDGE DESIGN 13-33 [6.5.4.2] C. Base Plate Design Check For steel elements in flexure, 00.1f =φ . 483633.100.1FSM ypostfnf =⋅⋅=⋅⋅φ=⋅φ kip-in > 31.9 kip-in OK A plan view of the base plate is shown in Figure 13.3.2.2. Assume that the critical section occurs at the face of the vertical post (1" from the edge of the plate on the compression side). Figure 13.3.2.2 Conservatively assume that the compression reaction, compR , acts at the edge of the base plate. The internal lever arm between the anchors and the compression edge of the plate is 5". Then, 38.6 0.5 9.31 arm M R int upost comp === kips and 38.60.138.6armRM platecompuplate =⋅=⋅= kip-in The resisting moment at the face of the column is the capacity of the plate minus two anchor bolt holes. ( ) ( ) 214.0 6 5.09375.027 6 td2b S 22 plateholeplate plate = ⋅⋅− = ⋅⋅− = in3 36214.000.1FSM yplatefrplate ⋅⋅=⋅⋅φ= 70.7= kip-in > 6.38 kip-in OK
- 34. MAY 2006 LRFD BRIDGE DESIGN 13-34 D. Adhesive Anchor Design Forces E. Anchor Rod Shear Capacity [6.5.4.2] [6.13.2.7] F. Concrete Shear Capacity Factored Shear Force Assume that the base plate engages each of the anchors equally. Then, 31.0 4 23.1 4 H V u u === kips/anchor Factored Tension Force Determine the factored tension load uT on one anchor using the overturning moment upostM (31.9 kip-in). As a simplifying design practice Mn/DOT uses the distance between anchor rods (4.0 in) as the flexural lever arm: ( ) 99.3 20.4 9.31 Narm M T u u = ⋅ = ⋅ = kips/anchor The anchor rods are assumed to have sufficient embedment to develop their shear capacity. Try Mn/DOT 3385, Type A anchor rods. 36Fy = ksi and 58Fub = ksi Since yF of the Type A anchor rods is equal to yF for A307 bolts, use 65.0s =φ . Each anchor rod will be subject to one shear plane. Assume that threads are included in the shear plane. The area bA of one 5 /8" diameter anchor rod is 0.31 in2 . Then, 83.615831.038.0NFA38.0R subbn =⋅⋅⋅=⋅⋅⋅= kips 44.483.665.0Rns =⋅=φ kips > 0.31 kips OK The concrete shear capacity is a function of geometry and compressive strength. Assume the two anchors on the compression side of the base plate connection are the critical shear anchors. For calculation of shear capacity, consider “end effects”, “edge effects”, and “group effects”. For this example, end effects need to be considered near the expansion joint and deflection joints in the parapet. Consider group effects based on the distances between anchors in a group. Widely spaced anchors function as individual anchors, while more closely spaced anchors have a reduced capacity.
- 35. MAY 2006 LRFD BRIDGE DESIGN 13-35 [Klingner] For shear, the end effects, edge effects, and group effects are incorporated in the calculation for the concrete area effective in resisting shear. See Figure 13.3.2.3. Per Mn/DOT policy the center of a railpost can be no closer than 12" to a deflection joint or an expansion joint end of the parapet. The anchors are located 2.25 inches away from the center of the railpost. Consequently, the end distance is 75.925.212d nde =−= in. The anchor rod edge distance 4c1 = in. The influence distance for shear is: 0.60.45.1c5.1 1 =⋅=⋅ in 75.9< in Therefore, end effects need not be considered for shear. Figure 13.3.2.3 Two Anchor Shear Interface Area (From Klingner) Plugging values into the formula results in: 5.4s 1 = in, 4c 1 = in °=⎟ ⎠ ⎞ ⎜ ⎝ ⎛ ⋅ ⋅=⎟⎟ ⎠ ⎞ ⎜⎜ ⎝ ⎛ ⋅ ⋅=θ 5.111 42 5.4 acos2 c2 s acos2 1 1 22 1v in49.6c)sin( 180 2A =⋅ ⎥ ⎥ ⎥ ⎥ ⎦ ⎤ ⎢ ⎢ ⎢ ⎢ ⎣ ⎡ θ+ θ ⋅π −π=
- 36. MAY 2006 LRFD BRIDGE DESIGN 13-36 [Klingner] [Klingner] G. Anchor Rod Tension Capacity [6.13.2.11] [6.5.4.2] H. Resistance Factor for Adhesive Anchor Pullout The capacity of the concrete on this interface is: 253.0 1000 40004 f4V cinterface_c = ⋅ =′⋅= ksi Concrete capacity of two anchors in shear is: ( ) ( ) 54.12253.06.49VAV erfaceint_cv2c =⋅=⋅= kips Concrete capacity of one anchor in shear is: 27.6 2 54.12 2 V V 2c 1c === kips 64.527.690.0V 1c =⋅=φ kips> 0.31 kips OK Because the shear demand is less than 20% of the shear capacity, ignore the interaction effects between shear and tension. Determine the capacity of the anchor rods. Begin by checking if interaction effects need to be considered. 33.0045.0 83.6 31.0 R P n u ≤== The tension capacity can be found without considering shear. The tension capacity of each anchor rod is: ( ) ( ) ( ) 66.135831.076.0FA76.0T ubbn =⋅⋅=⋅⋅= kips Using tφ for an A307 bolt ( 80.0t =φ ), ( ) 93.1066.1380.0Tn =⋅=φ kips > 3.99 kips OK In the past, adhesive anchors were designed with allowable stress methods. A typical factor-of-safety (FS) was 4. A similar safety or reliability level will be used for LRFD designs. The load factor for live loads is 1.75. Choose a resistance factor that when combined with the load factor for live load will produce a factor near 4. If a LL FS φ γ = , then 4 75.1 FS u a = γ =φ Use 45.0a =φ
- 37. MAY 2006 LRFD BRIDGE DESIGN 13-37 I. Pullout Capacity of Adhesive Anchor [Klingner] According to research referenced by Klingner, the best model for tensile behavior of adhesive anchors is a simple bond model that assumes a uniform bond stress over the length of the anchor. Taking into account end effects, edge effects, and group effects, the factored tensile resistance naaTφ is: gec0nanaa TT ψ⋅ψ⋅ψ⋅⋅φ=⋅φ where, =0nT nominal adhesive tensile capacity ( )onccnchoraondb Ld ⋅⋅π⋅τ= =τ ondb ultimate bond stress of adhesive =anchord diameter of steel anchor =concL steel anchor embedment length =ψc concrete strength variation factor =ψe end/edge effect factor =ψg group effect factor Based on adhesive anchor product literature for a 5 /8" diameter threaded rod anchored in concrete with 4fc =′ ksi, use an ultimate bond stress 2ondb =τ ksi for the adhesive. The concrete strength variation factor cψ accounts for variations in bond stress with changes in concrete strength. For concrete strengths greater than 3 ksi, cψ can conservatively be taken equal to 1.0. End Effect and Edge Effect The end/edge effect correction is independent of the depth of embedment. It is only dependent on the ratio of the end/edge distance to the diameter of the anchor. Consider end/edge effects when adhesive anchors are located within 10 anchor diameters of an edge. 25.6625.010d10c nchora0 =⋅=⋅= in Actual edge distance 0.4c1 = in < 6.25 in then, 86.060.0 625.0 4 10 4.0 60.0 d c 10 4.0 nchora 1 e =+⎟ ⎠ ⎞ ⎜ ⎝ ⎛ ⋅=+⎟⎟ ⎠ ⎞ ⎜⎜ ⎝ ⎛ ⋅=ψ Group Effect The reduction in capacity due to group effects is a ratio of the sum of influence areas for single anchors to that of the group. It is dependent on the depth of embedment and the spacing between anchors. The minimum embedment length mineh for an adhesive anchor is nchorad6 ⋅ : 75.3625.06d6h nchoramine =⋅=⋅= in
- 38. MAY 2006 LRFD BRIDGE DESIGN 13-38 [Klingner] [Klingner] Try an embedment length 0.4he = in The critical spacing between anchors, os , where group effects disappear is: 0.7h75.1s eo =⋅= in The actual spacing between anchors ( 1s dimension) is 4.5 inches. Therefore, use a group effect reduction in capacity. Figure 13.3.2.4 shows the influence area for anchors with an embedment of 4". The influence area of a single anchor is: ( ) 480.43h3A 22 e0 =⋅=⋅= in 2 The influence area of two anchors with 1s equal to 4.5 inches is: ( ) ( ) 5.805.40.70.7sssA 1002n =+⋅=+⋅= in 2 84.0 482 5.80 A2 A 0 2n g = ⋅ = ⋅ =ψ
- 39. MAY 2006 LRFD BRIDGE DESIGN 13-39 Figure 13.3.2.4 Pullout Capacity and Embedment During construction, the contractor will select a Mn/DOT Approved Concrete Anchorage, which are listed at the Mn/DOT Office of Materials Web site (http://www.mrr.dot.state.mn.us). The approved product must have a factored tensile resistance naT⋅φ that is at least equal to the factored tension force uT determined in design: ugec0nanaa TTT ≥ψ⋅ψ⋅ψ⋅⋅φ=⋅φ then, 3.12 84.086.00.145.0 99.3T T geca u 0n = ⋅⋅⋅ = ψ⋅ψ⋅ψ⋅φ ≥ kips
- 40. MAY 2008 LRFD BRIDGE DESIGN 13-40 J. Summary K. Adhesive Anchor Design for Traffic Rails Assuming 1 /2" of top surface deterioration, the minimum anchor embedment depth concL is: 5.0 d T L anchorbond 0n conc +⎟ ⎟ ⎠ ⎞ ⎜ ⎜ ⎝ ⎛ ⋅π⋅τ ≥ in 63.35.0 625.02 3.12 =+⎟ ⎠ ⎞ ⎜ ⎝ ⎛ ⋅π⋅ = This is less than the assumed 4". OK At the job site, anchors are subjected to a proof load test. The proof load will be the smaller of: A limit based on yielding the steel rod: ( ) ( ) ( ) 4.716.11 3 2 3631.0 3 2 FA 3 2 yb =⋅=⋅⋅=⋅⋅ kips A limit based on the nominal adhesive capacity: ( ) ( ) 2.63.12 2 1 T 2 1 0n =⋅=⋅ kips GOVERNS An adhesive anchor detail with the following properties has adequate capacity to support the Type M-1 railing: The anchor rods shall be 5 /8" diameter, Mn/DOT 3385 Type A anchor rods with a 4" minimum embedment. The adhesive shall have a minimum ultimate pull-out strength of 12.3 kips. The proof load for field testing shall be 6.2 kips. The design of adhesive anchors for traffic rails is different than the design of adhesive anchors for pedestrian rails shown above. A traffic rail requires reinforcement or anchor rods to withstand a vehicle crash load under the Extreme Event II limit state. For a metal rail on parapet system or a concrete barrier where the design is based on successful crash testing along with a yield line analysis, design the adhesive to develop the strength of the reinforcement bar or anchor rod. The Extreme Event II limit state has a load factor of 1.0 for the vehicle crash load. Using the procedure in Article 13.3.2H of this manual to determine a resistance factor results in the following: 25.0 4 0.1 FS CT a == γ =φ (This value seems very low.) The factor of safety (FS) of 4 used by adhesive manufacturers is based on a working load and not an extreme event load. Using the low crash probability under an extreme event and the non-working load nature of the crash load as a basis, Mn/DOT policy is to design for an FS of 1.66.
- 41. MAY 2008 LRFD BRIDGE DESIGN 13-41 Then, 60.0 66.1 0.1 FS CT a == γ =φ (Use 60.0a =φ for traffic rail only.) Consider the following example: A rail reconstruction project requires the use of #16 bars @ 12" spacing to anchor a new F-rail to an existing deck with adhesive anchors. 6.186031.0FAT ysu =⋅=⋅= kips ugec0nanaa TTT ≥ψ⋅ψ⋅ψ⋅⋅φ=⋅φ Assuming that 0.1gec =ψ⋅ψ⋅ψ : 0.31 60.0 6.18T T a u 0n == φ ≥ kips Based on adhesive anchor product literature for a #16 bar anchored in concrete with 4fc =′ ksi, use an ultimate bond stress 5.2ondb =τ ksi. Assuming 1 /2" of top surface deterioration, the minimum required embedment is: 5.0 d T L nchoraondb 0n oncc +⎟ ⎟ ⎠ ⎞ ⎜ ⎜ ⎝ ⎛ ⋅π⋅τ = 82.65.0 625.05.2 0.31 =+⎟ ⎠ ⎞ ⎜ ⎝ ⎛ ⋅π⋅ = in Say 7" min. embedment
- 42. MAY 2006 LRFD BRIDGE DESIGN 13-42 [ This Page Intentionally Left Blank ]