QNBFS Daily Technical Trader Qatar - September 07, 2023 التحليل الفني اليومي ...
12 August Daily market report
1. Page 1 of 7
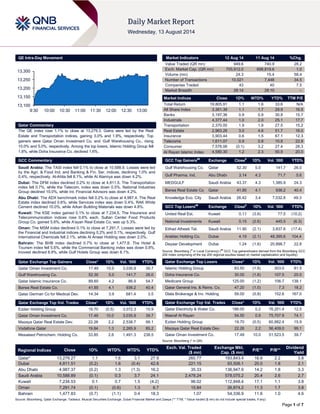
QE Intra-Day Movement
Qatar Commentary
The QE index rose 1.1% to close at 13,279.3. Gains were led by the Real
Estate and Transportation indices, gaining 3.0% and 1.9%, respectively. Top
gainers were Qatar Oman Investment Co. and Gulf Warehousing Co., rising
10.0% and 5.0%, respectively. Among the top losers, Islamic Holding Group fell
1.8%, while Doha Insurance Co. declined 1.6%.
GCC Commentary
Saudi Arabia: The TASI index fell 0.1% to close at 10,588.9. Losses were led
by the Agri. & Food Ind. and Banking & Fin. Ser. indices, declining 1.0% and
0.4%, respectively. Al-Ahlia fell 8.1%, while Al Alamiya was down 4.2%.
Dubai: The DFM index declined 0.2% to close at 4,811.5. The Transportation
index fell 0.7%, while the Telecom. index was down 0.5%. National Industries
Group declined 10.0%, while Int. Financial Advisors was down 4.2%.
Abu Dhabi: The ADX benchmark index fell 0.2% to close at 4,987.4. The Real
Estate index declined 0.6%, while Services index was down 0.4%. RAK White
Cement declined 10.0%, while Arkan Building Materials was down 4.8%.
Kuwait: The KSE index gained 0.1% to close at 7,234.5. The Insurance and
Telecommunication indices rose 0.6% each. Sultan Center Food Products
Group Co. gained 5.6%, while A'ayan Real Estate Co. was up 5.3%.
Oman: The MSM index declined 0.1% to close at 7,291.7. Losses were led by
the Financial and Industrial indices declining 0.2% and 0.1%, respectively. Gulf
International Chemicals fell 2.1%, while Al Anwar Holding was down 2.0%.
Bahrain: The BHB index declined 0.7% to close at 1,477.8. The Hotel &
Tourism index fell 5.6%, while the Commercial Banking index was down 0.8%.
Inovest declined 8.9%, while Gulf Hotels Group was down 8.1%.
Qatar Exchange Top Gainers Close* 1D% Vol. ‘000 YTD%
Qatar Oman Investment Co. 17.49 10.0 3,035.9 39.7
Gulf Warehousing Co. 52.30 5.0 141.7 26.0
Qatar Islamic Insurance Co. 89.60 4.2 86.9 54.7
Barwa Real Estate Co. 41.85 4.1 936.2 40.4
Qatar German Co for Medical Dev. 14.34 3.9 681.4 3.5
Qatar Exchange Top Vol. Trades Close* 1D% Vol. ‘000 YTD%
Ezdan Holding Group 19.70 (0.5) 3,072.3 15.9
Qatar Oman Investment Co. 17.49 10.0 3,035.9 39.7
Mazaya Qatar Real Estate Dev. 22.26 2.2 2,538.7 99.1
Vodafone Qatar 19.84 1.3 2,265.9 85.2
Mesaieed Petrochem. Holding Co. 33.85 2.6 1,491.3 238.5
Market Indicators 12 Aug 14 11 Aug 14 %Chg.
Value Traded (QR mn) 949.6 740.9 28.2
Exch. Market Cap. (QR mn) 705,912.0 698,819.6 1.0
Volume (mn) 24.3 15.4 58.4
Number of Transactions 10,021 7,448 34.5
Companies Traded 43 40 7.5
Market Breadth 28:14 28:10 –
Market Indices Close 1D% WTD% YTD% TTM P/E
Total Return 19,805.91 1.1 1.6 33.6 N/A
All Share Index 3,361.39 1.1 1.7 29.9 16.5
Banks 3,197.36 0.9 0.9 30.8 15.7
Industrials 4,377.44 1.0 2.0 25.1 17.7
Transportation 2,370.00 1.9 1.8 27.5 15.2
Real Estate 2,963.26 3.0 4.6 51.7 16.0
Insurance 3,903.44 0.6 1.5 67.1 12.3
Telecoms 1,611.07 0.9 0.8 10.8 22.8
Consumer 7,578.06 (0.1) 3.2 27.4 28.3
Al Rayan Islamic Index 4,580.30 1.2 2.3 50.9 20.0
GCC Top Gainers##
Exchange Close#
1D% Vol. ‘000 YTD%
Gulf Warehousing Co. Qatar 52.30 5.0 141.7 26.0
Gulf Pharma. Ind. Abu Dhabi 3.14 4.3 71.7 5.6
MEDGULF Saudi Arabia 43.37 4.3 1,385.9 24.3
Barwa Real Estate Co. Qatar 41.85 4.1 936.2 40.4
Knowledge Eco. City Saudi Arabia 26.42 3.4 7,032.8 49.3
GCC Top Losers##
Exchange Close#
1D% Vol. ‘000 YTD%
United Real Est. Kuwait 0.11 (3.6) 77.5 (10.2)
National Investments Kuwait 0.15 (2.6) 445.5 (6.3)
Etihad Atheeb Tel. Saudi Arabia 11.90 (2.1) 3,837.6 (17.4)
Arabtec Holding Co. Dubai 4.19 (2.1) 48,395.6 104.4
Deyaar Development Dubai 1.24 (1.6) 20,898.7 22.8
Source: Bloomberg (
#
in Local Currency) (
##
GCC Top gainers/losers derived from the Bloomberg GCC
200 Index comprising of the top 200 regional equities based on market capitalization and liquidity)
Qatar Exchange Top Losers Close* 1D% Vol. ‘000 YTD%
Islamic Holding Group 83.50 (1.8) 303.0 81.5
Doha Insurance Co. 30.00 (1.6) 107.5 20.0
Medicare Group 125.00 (1.2) 106.7 138.1
Qatar General Ins. & Reins. Co. 47.20 (1.0) 7.3 18.2
Dlala Brokerage & Inv. Holding 59.00 (0.8) 152.6 167.0
Qatar Exchange Top Val. Trades Close* 1D% Val. ‘000 YTD%
Qatar Electricity & Water Co. 186.00 0.2 76,251.4 12.5
Masraf Al Rayan 54.50 0.9 75,707.9 74.1
Ezdan Holding Group 19.70 (0.5) 60,882.4 15.9
Mazaya Qatar Real Estate Dev. 22.26 2.2 56,409.0 99.1
Qatar Oman Investment Co. 17.49 10.0 51,523.5 39.7
Source: Bloomberg (* in QR)
Regional Indices Close 1D% WTD% MTD% YTD%
Exch. Val. Traded
($ mn)
Exchange Mkt.
Cap. ($ mn)
P/E** P/B**
Dividend
Yield
Qatar* 13,279.27 1.1 1.6 3.1 27.9 260.77 193,843.4 16.6 2.2 3.8
Dubai 4,811.51 (0.2) 1.6 (0.4) 42.8 221.15 93,506.1 20.0 1.8 2.1
Abu Dhabi 4,987.37 (0.2) 1.3 (1.3) 16.2 35.33 136,947.9 14.2 1.8 3.3
Saudi Arabia 10,588.89 (0.1) 0.3 3.7 24.1 2,478.24 578,075.2 20.4 2.6 2.7
Kuwait 7,234.53 0.1 0.7 1.5 (4.2) 96.02 112,848.4 17.1 1.1 3.8
Oman 7,291.74 (0.1) (0.6) 1.3 6.7 15.84 26,874.2 11.3 1.7 3.8
Bahrain 1,477.83 (0.7) (1.1) 0.4 18.3 1.07 54,336.9 11.6 1.0 4.6
Source: Bloomberg, Qatar Exchange, Tadawul, Muscat Securities Exchange, Dubai Financial Market and Zawya (** TTM; * Value traded ($ mn) do not include special trades, if any)
13,100
13,150
13,200
13,250
13,300
9:30 10:00 10:30 11:00 11:30 12:00 12:30 13:00
2. Page 2 of 7
Qatar Market Commentary
The QE index rose 1.1% to close at 13,279.3. The Real Estate
and Transportation indices led the gains. The index rose on the
back of buying support from non-Qatari shareholders despite
selling pressure from Qatari shareholders.
Qatar Oman Investment Co. and Gulf Warehousing Co. were the
top gainers, rising 10.0% and 5.0%, respectively. Among the top
losers, Islamic Holding Group fell 1.8%, while Doha Insurance
Co. declined 1.6%.
Volume of shares traded on Tuesday rose by 58.4% to 24.3mn
from 15.4mn on Monday. Further, as compared to the 30-day
moving average of 15.4mn, volume for the day was 58.1%
higher. Ezdan Holding Group and Qatar Oman Investment Co.
were the most active stocks, contributing 12.6% and 12.5% to
the total volume respectively.
Source: Qatar Exchange (* as a % of traded value)
Earnings and Global Economic Data
Earnings Releases
Company Market Currency
Revenue
(mn)2Q2014
% Change
YoY
Operating Profit
(mn) 2Q2014
% Change
YoY
Net Profit (mn)
2Q2014
% Change
YoY
Dubai Refreshments (DRC) Dubai AED 274.7 13.1% 39.2 30.8% 39.6 25.5%
Dubai National Insurance &
Reinsurance (DNIR)
Dubai AED 49.4 19.3% 8.9 18.0% 10.5 36.5%
Takaful Emarat – Insurance Dubai AED 20.6 125.4%
– –
1.1 NA
Damac Properties Dubai USD 556.1 NA
– –
253.3 18.0%
Al Fujairah National
Insurance Co. (AFNIC)
Abu Dhabi AED 29.8 3.9% -0.3 NA -1.1 NA
Sharjah Insurance Co.
(SICO)
Abu Dhabi AED 8.9 -16.2% -7.1 NA 6.3 16.3%
Al Ain Ahlia Insurance Co. Abu Dhabi AED 186.4 21.9% 18.7 -11.4% 28.2 58.0%
Al Noor Hospitals Group
(ANH)**
Abu Dhabi USD 224.8 NA – – 44.5 NA
United Real Estate Co.
(URC)*
Kuwait KD 22.8 NA 8.2 NA 3.5 NA
Inovest Bahrain USD 1.9 92.1% -1.4 NA -1.4 NA
Gulf Hotels Group (GHG) Bahrain BHD 8.9 8.7% 4.2 14.3% 3.6 19.4%
Bahrain Duty Free Shop
Complex Co.
Bahrain USD 19.5 NA – – 4.4 NA
Source: Company data, DFM, ADX, MSM (*1H2014 results)
Global Economic Data
Date Market Source Indicator Period Actual Consensus Previous
08/12 US NFIB NFIB Small Business Optimism July 95.7 96.0 95.0
08/12 US BLS JOLTS Job Openings June 4671 4600 4577
08/12 EU ZEW ZEW Survey Expectations August 23.7 – 48.1
08/12 France Banque De France Current Account Balance June -7.4B – -3.3B
08/12 Germany ZEW ZEW Survey Current Situation August 44.3 54 61.8
08/12 Germany ZEW ZEW Survey Expectations August 8.6 17 27.1
08/12 UK BRC BRC Sales Like-For-Like YoY July -0.30% 0.90% -0.80%
08/12 Italy ISTAT CPI FOI Index Ex Tobacco July 107.3 – 107.4
08/12 Italy ISTAT CPI EU Harmonized YoY July 0.00% 0.00% 0.00%
08/12 Japan Bank of Japan PPI MoM July 0.30% 0.40% 0.20%
08/12 Japan Bank of Japan PPI YoY July 4.30% 4.40% 4.60%
08/12 Japan METI Industrial Production MoM June -3.40% – -3.40%
08/12 Japan METI Industrial Production YoY June 3.10% – 3.10%
08/12 Japan METI Capacity Utilization MoM June -3.30% – -0.70%
Source: Bloomberg (s.a. = seasonally adjusted; n.s.a. = non-seasonally adjusted; w.d.a. = working day adjusted)
Overall Activity Buy %* Sell %* Net (QR)
Qatari 57.38% 75.41% (171,177,168.86)
Non-Qatari 42.62% 24.59% 171,177,168.86
3. Page 3 of 7
News
Qatar
Qatar inflation up 3.1% YoY in July on rent, furniture and
garments – According to the official figures, Qatar’s cost of
living, based on the consumer price index (CPI), rose 3.1% YoY
in July mainly on rising rents and costlier furniture & garments.
The Ministry of Development Planning and Statistics said the
CPI inflation was up 0.3% MoM. The rent, fuel & energy group,
which is the most influential and carries the maximum weight of
32.2% in the CPI basket, recorded an increase of 7.6% YoY in
July 2014. The index was up 0.3% MoM. After eliminating the
effect of rent, the overall index was up 0.2% from June 2014 and
showed an increase of 1.4% as compared to July 2013.
According to QNB Group projection, the country’s inflation is
expected to rise to 3.4% in 2014 as higher infrastructure
spending will result in a large inflow of workers, putting pressure
on housing and prices. Transport and communication, which has
a weight of 20.5% in the CPI basket, saw its index go up by
1.8% YoY in July 2014. It was up 0.5% on a MoM basis.
Entertainment, recreation and culture group, which has a weight
of 10.90% in the CPI basket, saw its group index rise by 0.8%
as compared to July 2013. The measure was up 0.7% from
June 2014. Furniture, textiles and home appliances, which has a
weight of 8.2% in the CPI basket, saw its group index surge
5.4% YoY in July 2014. Garments & footwear, which has a
weight of 5.8% in the CPI basket, saw its price spurt by 2.2%
YoY in July 2014 and 1.5% against the June 2014 level. Medical
care & medical services group, which has a weight of 2%,
reported a 0.7% YoY increase in July 2014. However, food,
beverages & tobacco, which has a weight of 13.2% in the CPI
basket, saw a 0.8% fall from July 2013. It fell 1% on a MoM
basis. Miscellaneous goods and services, which has a weight of
7.2% in the CPI basket, saw its group become costlier by 1.3%
YoY in July 2014. (Gulf-Times.com)
Education City to build two parts of Qatar Economic Zone –
Education City, an initiative of Qatar Foundation for Education,
Science and Community Development, is set to build two parts
of Qatar Economic Zone which will be spread over 42 square
kilometers. The first part of the zone, which will be located on
the Doha Expressway, will house industries for modern
technology, air cargo, food industries, tools & instruments,
commercial offices and assembling units for logistic services.
The other part of the economic zone will have industrial units
related to logistic services, mining, petrochemicals, construction
materials, machines & tools and vehicle parts manufacturers.
Education City will feature three huge car parking facilities to be
built by Qatar Foundation. The city will also have a three-star
hotel, which is expected to be ready by 2015-end. There will
also be health centers, retail shops, office spaces, children play
areas and prayer rooms in the city. (GulfBase.com)
QA enhances frequencies on Tehran, Islamabad, Muscat
routes – Qatar Airways (QA) is increasing frequencies to capital
cities in Iran, Pakistan and Oman in response to increasing
passenger demand across the Doha-based airlines network.
Starting in the first week of September, the airline will increase
the number of flights from Doha to Tehran by four to eighteen.
QA will also add two additional flights on the Islamabad route,
taking the total number of flights to nine a week. Muscat will
operate four extra weekly flights from September 16, 2014,
which takes the total number of flights to 35 a week.
(Bloomberg)
International
Job openings in US increase to highest level since 2001 –
Job openings rose in June to the highest level in more than 13
years, firming up the US labor market picture for the second half
of 2014. A labor department report showed the number of
unfilled positions climbed by 94,000 to 4.67mn, the most since
February 2001, from a revised 4.58mn in May. The increase in
openings, combined with the highest readings on the number of
people hired and leaving their jobs since 2008, means the
healing in the labor market is broadening, albeit at a measured
rate. Deutsche Bank Securities’ chief US economist Joseph
LaVorgna said that there is an improvement, but it is still slow
and uneven. (Bloomberg)
Yellen resolved to avoid raising rates too soon, fearing
downturn – Approaching a historic turn in the US monetary
policy, Janet Yellen has staked her tenure as chairman of the
Federal Reserve on a simple principle: she would rather fight
inflation than another economic downturn. Interviews with
current and former Fed officials indicate that Yellen and core
decision-makers at the US central bank are determined not to
raise interest rates too early and risk hurting the fragile US
economy. It is a commitment that will be vigorously tested in
coming months as pressure builds inside the Fed, among
Republicans on Capitol Hill, and perhaps even in financial
markets, for the Fed to acknowledge a strengthening US
economy with its first interest-rate increase in more than eight
years. A global central bankers' conference in Jackson Hole,
Wyoming next week will give Yellen a major stage on which to
press her case. (Reuters)
US budget deficit falls to $95bn in July – According to data
released by the Treasury Department, the US budget deficit
stood at $95bn at the end of July, down 3% from the same
period last year. Analysts polled by Reuters had expected a
$96bn deficit for last month. The deficit was $98bn in July of
2013. According to Treasury's monthly budget statement, the
fiscal YTD deficit at the end of July was $460bn, the lowest level
since the same period in fiscal year 2008, as compared to a
deficit of $607bn for the same period in fiscal year 2013. The
last month's budget results were affected by differences in the
calendar. If adjusted for timing-related transactions, the budget
deficit in July would have been $86bn. The receipts last month
totaled $211bn, up 5% from the year-ago period, bringing the
fiscal YTD total receipts to $2.47tn. The last month’s outlays
totaled $305bn, up 3% from July 2013, for a fiscal YTD total of
$2.93tn. (Reuters)
UK statistics agency revises down scale of 2008-09
recession – The latest official data showed that Britain's
economy shrank less than previously thought during the 2008-
09 recession, though the downturn remains easily the worst
since modern records began in 1948. The British economic
output is now estimated at 4.6% lower in 2009 than what it was
in 2007. The decline had been set at 5.2% on June 30 and 6.0%
in the last major annual revision to gross domestic product data
in 2013. The Office for National Statistics (ONS) is overhauling
how it calculates the British GDP in response to new European
Union statistical rules and some domestic changes, and
publishing regular updates. Further revisions, including quarterly
data and figures covering 2010-2012, are due on September 3.
The main cause of revision was a change in how much Britain's
economy was estimated to have contracted as it entered
recession in 2008. The ONS now believes Britain's economy
shrank just 0.3% in 2008, as compared to an estimate of a 1.1%
decline published only six weeks ago. (Reuters)
4. Page 4 of 7
ECB balance sheet shrinks in week to August 8 – The
European Central Bank (ECB) said that the balance sheet of the
ECB and the Eurozone's national central banks contracted by
€34.425bn to €2.025tn in the week that ended on August 8. The
decrease came as banks took less funding in the ECB's main
refinancing operation and repaid long-term loans to the central
bank. Gold reserves were unchanged at €334.432bn. The ECB
added that the net foreign exchange reserves in the Eurosystem
of central banks decreased by €0.1bn to €213.3bn. (Reuters)
German investor confidence slumps on Ukraine crisis –
German investor confidence fell to the lowest level since 2012
as the crisis in Ukraine and a sluggish euro area recovery
dampened the outlook for Europe’s largest economy. The ZEW
Center for European Economic Research in Mannheim said its
index of investor and analyst expectations, which aims to predict
economic developments six months in advance, dropped to 8.6
in August from 27.1 in July. According to a Bloomberg survey,
economists forecasted a decrease to 17. This was the eighth
consecutive monthly decline and the biggest in more than two
years. A worsening stand-off between Russia and the European
Union is clouding the outlook for a German economy that
probably contracted for the first time since 2012 in the second
quarter. The disruption to trade threatens to weigh on the revival
in the 18-nation euro area, which has already seen Italy slip
back into recession. Berenberg Bank’s senior European
economist in London Christian Schulz said the drop in the ZEW
index confirms the near-term downside risks for the German and
euro-zone economies emanating from the Ukraine crisis.
(Bloomberg)
Euro falls to almost nine-month low as confidence sags –
The Euro fell to almost the weakest since November after
investor confidence in Germany slumped to the lowest level
since 2012, adding to concerns that Europe may be entering a
Japanese-style deflationary spiral. A gauge of the dollar was at
almost the strongest since February as job openings rose to the
highest level in more than 13 years before a report tomorrow
forecast to show US retail sales grew for a sixth month. German
bund yields dropped 1% on bets the European Central Bank’s
stimulus measures are insufficient to boost inflation. Ukraine’s
hryvnia fell to a record low as the turmoil with Russia deepened.
New Zealand’s currency dropped after the housing market
slowed. (Bloomberg)
Japan's economy contracts sharply – Japan's economy
contracted sharply in the second quarter after a sales-tax
increase in April sent household spending tumbling, which
economists said could pressurize the government to take
additional stimulus measures. Real GDP, the total value of all
goods and services produced in the economy, shrank 6.8% in
the three months through June on an annualized basis from the
prior quarter. That was slightly less than a 7.1% contraction
forecast by economists surveyed by The Wall Street Journal
(WSJ), but economists said a larger-than-expected drop in
private consumption and a sharp increase in inventories raised
concerns about the resilience of Japan's economic recovery. A
fallback in the economic output was expected after the nation's
sales tax rose to 8% from 5% on April 1. Prime Minister Shinzo
Abe and other policy makers have said they expect the
downturn to be short-lived. Economists said if that forecast
proves too rosy, the government might have to compile more
economic-stimulus measures and reconsider plans to raise the
sales tax further to 10% in October 2015. (WSJ)
Regional
Investments in gulf aluminum sector to reach $55bn by
2020 – According to the Aluminum Middle East exhibition, the
investments in the Gulf region’s aluminum sector are forecasted
to reach $55bn by 2020, as compared to $30bn in 2011, due to
smelters’ expansion and new projects in the region. The
statistical data showed that the Gulf aluminum industry is
growing by 8.4% annually as compared to an average annual
global expansion of 3.5%, making the Middle East region the
fastest-growing aluminum market in the world. The Aluminum
Middle East exhibition will be held from April 14-16, 2015 at the
Dubai International Convention and Exhibition Center (DICEC).
(GulfBase.com)
BMG Financial signs cooperation agreement with SABS –
BMG Financial Group has signed a strategic cooperation
agreement with Salman Abdullah Bin Saedan Real Estate
Group (SABS). SABS Group, which specializes in real estate
development and sustainable construction projects, entered into
a mutual agreement with BMG to advise, arrange and place a
number of real estate opportunities in the promising Saudi
Arabian market. The agreement is complementary to the
development of the burgeoning real estate market in Saudi
Arabia and is the embodiment of BMG and SABS Group’s vision
for expansion in the establishment of real estate funds
investment through various real estate activities in different cities
across Saudi Arabia. (GulfBase.com)
Saudi Arabia signs contracts worth SR893.7mn – According
to an Arab News report, Saudi Arabia has signed contracts
worth SR893.68mn for 15 municipal development projects in a
number of provinces. The contracts includes two projects to
ensure protection against flash floods on the Prince Naif road,
pavement construction and street lighting on several roads in
Madinah province as well as maintenance of roads, squares and
green surfaces in Riyadh. The main projects which will be
implemented in Jeddah under these contracts involve
asphalting, street lighting and pavement construction on some
major roads. (GulfBase.com)
Construction work on Saudi Arabia’s first women’s
industrial city underway – The construction work on Saudi
Arabia’s first women’s industrial city is underway, and is
expected to accommodate women’s businesses exclusively.
The city, which is expected to cost SR111mn, will span an area
of 500,000 square meters (sq m) and is located east of the Al-
Ahsa International Airport. The women’s industrial city will be
divided into three sections: a commercial section, which will
span 140,000 sq m, an industrial section to be built on an area
of 170,000 sq m, and a services area, which will span 120,000
sq m. (GulfBase.com)
Tadawul deposits new shares of Al-Ahlia Insurance – Saudi
Stock Exchange (Tadawul) announced that Al-Ahlia Insurance
Company’s new shares have been deposited in the
shareholders portfolios on August 12, 2014, based on their
allocation. (Tadawul)
Savola to bid for Americana – According to sources, Saudi
Arabia-based Savola Group is among the first-round bidders for
Kuwait Food Company (Americana). Americana operates KFC
and Pizza Hut restaurants in the MENA region. Americana is
likely to fetch more than $4bn. The average offer for the
business was about KD3.5 per share, which would value the
franchise operator at about $5bn (KD1.41bn). Other potential
suitors for the business include private-equity firms KKR & Co.
and CVC Capital Partners Ltd., which have submitted a joint
offer, and separate bids from Advent International Corp. and
TPG Capital. (Bloomberg)
Emirates Airline completes financing deal for acquisition of
Airbus A380s – Abu Dhabi Islamic Bank (ADIB), Commercial
Bank of Dubai (CBD) and Dubai Islamic Bank (DIB) have jointly
5. Page 5 of 7
finalized a $425mn Shari’ah-compliant financing deal with
Emirates Airline for the acquisition of two Airbus A380s. The
three banks were joint bookrunners and initial mandated lead
arrangers for the transaction. (GulfBase.com)
Instant Cash in strategic alliance with Ria Money Transfer –
Instant Cash Global Money Transfer (Instant Cash), a wholly
owned subsidiary of the Emirates Post Group has entered into a
strategic alliance with Ria Money Transfer, a wholly owned
subsidiary of Euronet Worldwide, that will give the US-based
remittance provider access to the growing pay out network of
Instant Cash. (GulfBase.com)
DLD: GCC invests more than AED19bn in Dubai’s real
estate market – According to the Dubai Land Department
(DLD), the total sum of Gulf Cooperation Council (GCC)
investment in Dubai’s real estate market for 1H2014 has
exceeded AED19bn. The figures revealed that UAE nationals
made transactions of AED12.5bn in the city’s property sector
from January 1, 2014 to July 1, 2014. The amount represents
almost double the AED6.5bn figure invested by all other GCC
nationals combined. The DLD’s report revealed that the citizens
of Saudi Arabia were ranked in second place on the list of GCC
real estate investment after making 1,121 transactions worth
AED3,371bn in 1H2014. Qataris came in at third place with 113
transactions worth AED1,463bn, Kuwaitis were listed at fourth
place with 263 transactions worth AED839mn and Omanis were
in the fifth place with transactions worth AED482mn. Bahrain
citizens occupied the sixth position after making transactions
worth AED247mn in 1H2014. (GulfBase.com)
STR Global: Dubai hotels record lowest occupancy in 18
years – According to research firm STR Global, hotels in Dubai
had the lowest occupancy in at least 18 years in July 2014,
standing more than half empty, as more rooms were created
and demand declined. Occupancy declined 11.8% to 45.4%
from a year earlier. Revenue per available room fell 7.4% to
AED290.2. Dubai plans to almost double the number of hotel
rooms by 2020 as it expects a surge of visitors ahead of the
World Expo. (Bloomberg)
DSC: Dubai’s CPI up 3.4% in July – According to data by the
Dubai Statistic Centre (DSC), Dubai’s consumer-price index
(CPI) climbed 3.41% YoY in July and 0.46% from June 2014.
The annual inflation rate in Dubai rose to 2.74% in 1H2014 from
1.6% in 1H2013. Alcoholic beverages and tobacco posted the
highest YoY price increase in July- up 6.34%, followed by
housing and utility, which account for almost 44% of consumer
expenses, with 5.8%. (Bloomberg)
Kuwait M2, bank lending growth rates rebound in June –
According to Kuwait Central Bank, Kuwait's M2 money supply
growth rebounded to 7.4% YoY in June 2014 from 6.1% in May
2014, which was the slowest rate since November 2012. Bank
lending to the private sector grew 7.0%, rising from 6.2% in May,
which was the slowest since September 2013. (Reuters)
RCC to set up distribution terminal in Duqm – Raysut
Cement Company (RCC) has taken a few projects in hand such
as setting up of a distribution terminal in Duqm, additional silo
capacity in the Salalah plant and off shore wheel loader system
in the north to facilitate bulk cement handling. The work is in
progressive stage for some of these projects and the company
would reap benefits from these in the early part of 2015.
(GulfBase.com)
Oman MoOG: Oman's oil production grew marginally –
According to the monthly statistics released by the Ministry of Oil
and Gas (MoOG), Oman’s production of crude oil and oil
condensates in July 2014 stood at 29,660,034 barrels, with an
average daily production of 956,775 barrels per day, reflecting a
slight growth as compared to the average daily production in
June 2014. The gross crude oil exports in July 2014 stood at
28,045,039 barrels, with an average daily export of 904,679,
indicating a growth of 14.03% as compared to June 2014.
(GulfBase.com)
Renaissance Services to sell less than 10% stake in Topaz –
Renaissance Services is planning to divest less than 10% stake
in its wholly-owned subsidiary, Topaz Energy and Marine
(Topaz) in favor of a business house. The company is also
planning to offer up to 49% investment in the Duqm permanent
accommodation for contractors (PAC) project, primarily for local
community investors, state pension funds and sovereign wealth
funds. Renaissance plans to construct facilities to accommodate
as many as 17,000 workers at an estimated cost of OMR100mn.
The company has already awarded two contracts to develop the
residential accommodation project in Duqm, spread over a total
area of 192,000 square meters. (GulfBase.com)
MSM banking sector stands fifth among GCC markets in
profitability – According to the Oman News Agency, the
Muscat Securities Market (MSM) came fifth in the growth of
profitability of the banking sector listed on the GCC financial
markets for 1H2014 as profit grew 5.6% on a YoY basis. The
banking sector in the Dubai Financial Market achieved the
highest growth in profitability among the GCC markets with
nearly 42%, while the banking sector in the Abu Dhabi
Securities Exchange grew by 25.5%, the banking sector in the
Tadawul grew by 9.3% and the banking sector in the Qatari
Exchange grew by about 7%. The banking sector in the Kuwait
Stock Exchange posted a profit growth of 2.2%, whereas the
profits of the banking sector in Bahrain Bourse retreated by
24.3%. (GulfBase.com)
BankDhofar awaits response from Bank Sohar on merger –
Bank Dhofar announced that it is waiting for a response on the
proposed swap ratio from Bank Sohar to proceed with the
merger plan. Earlier, Bank Dhofar has sent a letter to Bank
Sohar advising the completion of the preliminary study by a
specialist expert house. (Bloomberg)
Bahrain Duty Free’s BoD approves 20% interim cash
dividend for FY2014 – Bahrain Duty Free Shop Complex
Company’s board of directors has approved the distribution of
20% interim cash dividend (20 fils per share) for FY2014. The
shareholders registered on the books as of August 13, 2014 will
be eligible for the dividend distribution. The company’s shares
shall trade ex-dividend starting from August 14, 2014. (Bahrain
Bourse)
GFH signs MoU with Nasdaq Dubai to list $200mn Sukuk;
BHB announces increase in GFH paid-up capital – Gulf
Finance House (GFH) has signed a MoU with Nasdaq Dubai to
list its newly-intended $200mn Sukuk. GFH is planning to use
the proceeds from the Sukuk to repay the current outstanding
Sukuk of $84mn and undertake business acquisitions for
financial consolidation and project development in Bahrain and
Dubai. Meanwhile, the Bahrain Bourse (BHB) announced that
the paid-up capital of Gulf Finance House (GFH) has been
increased due to the issuance of 133,985,894 shares, pursuant
to the approval from the EGM held on April 14, 2014, and this
will be effective August 13, 2014. The previous total outstanding
shares were 3,487,469,938 & the new outstanding shares are
3,621,455,832, whereas the previous total paid-up capital was
$1.073bn and the new total paid-up capital is $1.113bn.
(Bahrain Bourse)
BISB’s profit rises 67% to BHD4.0mn in 1H2014 – Bahrain
Islamic Bank (BISB) has reported a net profit of BHD4.05mn in
6. Page 6 of 7
1H2014 as compared to BHD2.4mn in 1H2013, reflecting an
increase of 67%. The profit for 2Q2014 was BHD1.6mn as
against BHD1.3mn in 2Q2013. Net operating profits for 2Q2014
were BHD2.6mn as against BHD3.0mn for 2Q2013. EPS for
1H2014 amounted to 4.33 fils as against 2.57 fils for 1H2013.
BISB’s total assets as of June 30, 2014 stood at BHD906.8mn
as compared to BHD910.3mn as of December 31, 2013.
(Bahrain Bourse, GulfBase.com)
LIC (International) seeks tie-ups with financial institutions –
Bahrain-based LIC (International), a regional subsidiary of Life
Insurance Corporation of India (LIC), is in advanced negotiations
with financial institutions to be part of its distribution channel.
The company has issued 4,811 new policies and collected
$74mn first premium from January 2014 to July 2014.
(GulfBase.com)
BAC signs deal with BEONTRA – Bahrain Airport Company
(BAC), the operator of the Bahrain International Airport (BIA),
has signed a deal with BEONTRA, a Lockheed Martin company,
for the implementation of its route analysis tool. The technology
will allow BAC to calculate, analyze and present route cases to
airlines, while being able to recalculate and amend on demand.
The software is a tool that allows the user to develop and build
route cases in a clear, step-driven process. (GulfBase.com)
Bahrain MoT: Passenger traffic at BIA increases by 6% –
According to Ministry of Transportation's Undersecretary of Civil
Aviation Affairs (MoT), passenger traffic at Bahrain International
Airport (BIA) during 1H2014 increased by 6% compared with the
same period in 2013. The total number of passengers in the
period January 2014 - July 2014 was 4,586,281. (Bloomberg)
7. Contacts
Saugata Sarkar Abdullah Amin, CFA Shahan Keushgerian
Head of Research Senior Research Analyst Senior Research Analyst
Tel: (+974) 4476 6534 Tel: (+974) 4476 6569 Tel: (+974) 4476 6509
saugata.sarkar@qnbfs.com.qa abdullah.amin@qnbfs.com.qa shahan.keushgerian@qnbfs.com.qa
Sahbi Kasraoui Ahmed Al-Khoudary QNB Financial Services SPC
Manager – HNWI Head of Sales Trading – Institutional Contact Center: (+974) 4476 6666
Tel: (+974) 4476 6544 Tel: (+974) 4476 6548 PO Box 24025
sahbi.alkasraoui@qnbfs.com.qa ahmed.alkhoudary@qnbfs.com.qa Doha, Qatar
DISCLAIMER: This publication has been prepared by QNB Financial Services SPC (“QNBFS”) a wholly-owned subsidiary of Qatar National Bank (“QNB”). QNBFS is regulated by the Qatar
Financial Markets Authority and the Qatar Exchange; QNB is regulated by the Qatar Central Bank. This publication expresses the views and opinions of QNBFS at a given time only. It is not an
offer, promotion or recommendation to buy or sell securities or other investments, nor is it intended to constitute legal, tax, accounting, or financial advice. We therefore strongly advise potential
investors to seek independent professional advice before making any investment decision. Although the information in this report has been obtained from sources that QNBFS believes to be
reliable, we have not independently verified such information and it may not be accurate or complete. While this publication has been prepared with the utmost degree of care by our analysts,
QNBFS does not make any representations or warranties as to the accuracy and completeness of the information it may contain, and declines any liability in that respect. QNBFS reserves the
right to amend the views and opinions expressed in this publication at any time. It may also express viewpoints or make investment decisions that differ significantly from, or even contradict, the
views and opinions included in this report.
COPYRIGHT: No part of this document may be reproduced without the explicit written permission of QNBFS.
Page 7 of 7
Rebased Performance Daily Index Performance
Source: Bloomberg Source: Bloomberg
Source: Bloomberg Source: Bloomberg
80.0
90.0
100.0
110.0
120.0
130.0
140.0
150.0
160.0
170.0
180.0
190.0
200.0
210.0
Jul-10 Jul-11 Jul-12 Jul-13 Jul-14
QE Index S&P Pan Arab S&P GCC
(0.1%)
1.1%
0.1%
(0.7%)
(0.1%)
(0.2%) (0.2%)
(1.2%)
(0.6%)
0.0%
0.6%
1.2%
SaudiArabia
Qatar
Kuwait
Bahrain
Oman
AbuDhabi
Dubai
Asset/Currency Performance Close ($) 1D% WTD% YTD% Global Indices Performance Close 1D% WTD% YTD%
Gold/Ounce 1,309.45 0.1 (0.1) 8.6 DJ Industrial 16,560.54 (0.1) 0.0 (0.1)
Silver/Ounce 19.92 (0.5) 0.1 2.3 S&P 500 1,933.75 (0.2) 0.1 4.6
Crude Oil (Brent)/Barrel (FM
Future)
103.02 (1.6) (1.9) (7.0) NASDAQ 100 4,389.25 (0.3) 0.4 5.1
Natural Gas (Henry
Hub)/MMBtu
3.92 (0.7) 0.1 (9.8) STOXX 600 328.74 (0.2) 1.2 0.1
LPG Propane (Arab Gulf)/Ton 103.00 (0.6) 0.4 (18.6) DAX 9,069.47 (1.2) 0.7 (5.1)
LPG Butane (Arab Gulf)/Ton 121.75 (0.3) 1.0 (10.3) FTSE 100 6,632.42 (0.0) 1.0 (1.7)
Euro 1.34 (0.1) (0.3) (2.7) CAC 40 4,162.16 (0.8) 0.3 (3.1)
Yen 102.26 0.1 0.2 (2.9) Nikkei 15,161.31 0.2 2.6 (6.9)
GBP 1.68 0.1 0.2 1.5 MSCI EM 1,064.42 0.3 1.8 6.2
CHF 1.10 (0.1) (0.2) (1.6) SHANGHAI SE Composite 2,221.60 (0.1) 1.2 5.0
AUD 0.93 0.1 (0.1) 3.9 HANG SENG 24,689.41 0.2 1.5 5.9
USD Index 81.50 0.0 0.1 1.8 BSE SENSEX 25,880.77 1.4 2.2 22.2
RUB 36.15 0.6 (0.1) 10.0 Bovespa 56,442.34 (0.3) 1.6 9.6
BRL 0.44 0.0 0.4 3.9 RTS 1,198.72 (0.4) 2.4 (16.9)
190.8
161.8
145.8