Independent Call Girl Number in Kurla Mumbai📲 Pooja Nehwal 9892124323 💞 Full ...
2102 2102-1-pb
1. The Pakistan Development Review
44 : 4 Part II (Winter 2005) pp. 863–876
Performance Evaluation of Mutual
Funds in Pakistan
S. M. AAMIR SHAH and SYED TAHIR HIJAZI*
INTRODUCTION
In Pakistan Mutual Funds were introduced in 1962, when the public offering
of National Investment (Unit) Trust (NIT) was introduced which is an open-end
mutual fund. In 1966 another fund that is Investment Corporation of Pakistan
(ICP) was establishment. ICP subsequently offered a series of closed-end mutual
funds. Up to early 1990s, twenty six (26) closed-end ICP mutual funds had been
floated by Investment Corporation of Pakistan. After considering the option of
restructuring the corporation, government decided to wind up ICP in June, 2000. In
2002, the Government started Privatisation of the Investment Corporation of
Pakistan. 25 Out of 26 closed-end funds of ICP were split into two lots. There had
been a competitive bidding for the privatisation of funds. Management Right of
Lot-A comprising 12 funds was acquired by ABAMCO Limited. Out of these 12,
the first 9 funds were merged into a single closed-end fund and that was named as
ABAMCO Capital Fund, except 4th ICP mutual fund as the certificate holders of
the 4th ICP fund had not approved the scheme of arrangement of Amalgamation
into ABAMCO capital fund in their extra ordinary general meeting held on
December 20, 2003. The fund has therefore been reorganised as a separate closedend trust and named as ABAMCO Growth Fund. Rest of the three funds were
merged into another single and named as ABAMCO Stock Market Fund. So far as
the Lot-B is concerned, it comprised of 13 ICP funds, for all of these thirteen funds,
the Management Right was acquired by PICIC Asset Management Company
Limited. All of these thirteen funds were merged into a single closed-end fund
which was named as “PICIC Investment Fund”. Later on the 26th fund of ICP
(ICP-SEMF) was also acquired by PICIC Asset Management Company Limited.
The certificate holders in extraordinary general meeting held on June 16, 2004
S. M. Aamir Shah is a PhD student at Mohammad Ali Jinnah University, Islamabad and a
Lecturer Allama Iqbal Open University, Islamabad. Syed Tahir Hijazi is Dean, Faculty of Business
Administration, Mohammad Ali Jinnah University, Islamabad.
2. 864
Shah and Hijazi
approved the reorganisation of SEMF into a new closed-end scheme renamed as
PICIC Growth Fund. The Securities and Exchange Commission of Pakistan
subsequently authorised PGF on July 30, 2004.
Initially there was both public and private sector participation in the
management of these funds, but with the nationalisation in the seventies, the
government role become more dominant. Later, the government also allowed the
private sector to establish mutual funds. Currently there exist Thirty-three funds by
the end of Financial Year 2005. Twelve open-ended mutual funds are:
• public sector, 01;
• private sector, 11;
Twenty-one close-end mutual funds in Pakistan are:
• public sector, 0;
• private sector, 21.
Performance evaluation of mutual funds is important for the investors and
portfolio managers as well. Historical performance evaluation provide an
opportunity to the investors to assess the performance of portfolio managers as to
how much return has been generated and what risk level has been assumed in
generating such returns. In this way the investors can also compare the performance
of fund managers.
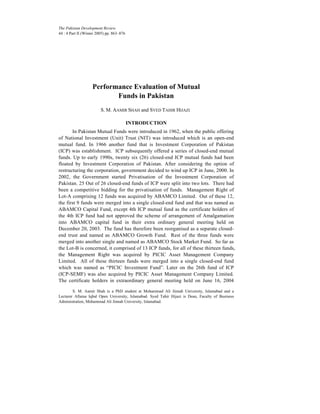
On June 2004 the net asset value of close-end mutual funds was Rs 48 billion
and open-end funds net asset value was Rs 63.86 billion. Whereas on June 1997 the
net asset value of closed-end mutual funds was Rs 04 billion and open-end mutual
funds net asset value was Rs 25 billion. Total net assets value in 1997 was Rs 29
billion and at the end June 2004, raised to Rs 112 billion. There is a big increase of
investment (entrusted amount) in this sector since 1997 to 2004 which necessitate the
performance evaluation of funds free of manipulation.
Rupees in Billion
Rupees in Billion
Total Net Asset Value
120,000,000,000
100,000,000,000
80,000,000,000
60,000,000,000
NAV Closed-end funds
NAV Open-end funds
40,000,000,000
20,000,000,000
0
Total NAV
1
2
3
4
5
Years 1997-2004
6
7
8
3. 865
Performance of Mutual Funds
Net Assets Value-Closed end Mutual Funds
Net Assets Value—Closed-end Mutual Funds
Rupees in Billion
60,000,000,000
50,000,000,000
40,000,000,000
Series1
30,000,000,000
20,000,000,000
10,000,000,000
0
1
2
3
4
5
6
7
8
Years 1997-2004
Net Assets Value—Closed-end Mutual Funds
Net Assets Value-Open end Mutual Funds
70000000000
Rupees in Billion
60000000000
Series 1
50000000000
40000000000
30000000000
20000000000
10000000000
0
1
2
3
4
5
Years 1997-2004
6
7
8
In the last few years mutual fund industry has shown significant progress with
reference to saving mobilisation and important part of the overall financial markets.
But still we are far behind the developed countries mutual fund industry. Growth in
mutual funds worldwide is because of the overall growth in both the size and
maturity of many foreign capital markets. These nations have increasingly used debt
and equity securities rather than bank loans to finance economic expansion. The
Pakistan economy can prosper because of the benefits of new investment
opportunities arising from economic reform, privatisation, lowered trade barriers and
rapid economic growth.
4. 866
Shah and Hijazi
Individuals throughout the world have the same basic needs that are education
for their children, health, good living standard and comfortable retirement. In our
country where people are religious minded, mostly they avoid bank schemes for
investments, if they are provided an investment opportunity which suits the religion,
we can mobilise savings from masses which may be laying an idle money at present.
By doing so we would be able to improve the living standard of our countrymen
through economic prosperity. This can be achieved through the introduction of
different species of mutual funds and their performance. The success of this sector
depends on the performance and the role of regulatory bodies. Excellent performance
and stringent regulations will increase the popularity of mutual funds in Pakistan.
LITERATURE REVIEW
In Gruber (1996) in his article based on USA data claims that most of the
older studies are subject to survivorship bias. When this effect is adjusted, is argued
that mutual funds on average under-perform the market proxy by the amount of
expenses they charge the investors.
Otten and Bams (2002) Maastricht University, in 2002 carried a research on
European mutual funds. Results suggest that Europeans mutual funds especially
small capitalisation funds are able to add value. If the management fee is added back,
some exhibits significant out performance. The author also pointed out that
European mutual funds industry is still lagging behind the US industry both in total
assets size and market capitalisation.
Malkiel and Radisich (2001) finds that index funds have regularly produced
rates of return exceeding those of active funds by 100 to 200 basis points per annum
in the United States over the 1990s and find that there are two reasons for the excess
performance by passive funds: management fee and trading costs.
Wermers (2000) carried out a research on mutual funds performance in
America and found that funds hold stocks that out perform by market 1.3 percent per
year, but their net results under perform by one percent. Out of this 1.6 percent is
due to expense and transaction costs.
Blake and Timmermann (1998) University of California, carried out a
research in 1998 on performance evaluation of UK mutual funds and found that the
average UK equity fund appears to under perform by around 1.8 percent per annum
on a risk-adjusted basis. The authors says that there is also some evidence of
persistence of performance, on average, a portfolio composed of the historically bestperforming quartile of mutual funds performs better in the subsequent period than a
portfolio composed of the historically worst-performing quartile of funds.
In 2002 Research conducted by Bauer, Koedijk, and Otten (2002) using an
international database containing German, UK and US ethical funds remarked that
the existing empirical evidence on US data suggests that ethical screening leads to
similar or slightly less performance relative to comparable unrestricted portfolios.
5. Performance of Mutual Funds
867
Evidence on the performance of ethical mutual funds is mostly limited to the US and
UK markets. For UK market four influential papers appeared during the last decade.
The early studies compared ethical funds to market wide indices like the FT all share
index. Using this methodology Luther, Matatko and Corner (1992) investigated the
returns of 15 ethical unit trusts. Their results provided some weak evidence that
ethical funds tend to out perform general market indices.
In 2004, Otten and Bams (2004) in article titled “How to measure mutual fund
performance: economic versus statistical relevance” says that the majority of US
studies conclude that actively managed portfolios, on average, under perform market
indices. He quoted the examples of the studies conducted by Jensen (1968) and
Sharpe (1966). He argued mutual funds under perform the market by the amount of
expenses they charge the investors.
Gupta and Gupta (2001) in their studies on Indian mutual funds industry
investigated that on Septmeber 30, 1999 total assets under the management of mutual
fund industry stood at Rs 85,487 crore (Rs 850 billion). Further more that the mutual
fund industry has four types of players i.e. (1) UTI; (2) public sector banks; (3) insurance
corporations; and (4) private sector funds. These four types consist of 37 players, 11 are
in the public sector including UTI, and the remaining ones are the private sector. The
UTI alone accounts for Rs 63, 113 crore which is 74 percent of total assets of the industry.
The share of other public sector funds is Rs 8831 crore that is 10.2 percent of total funds
in the industry. The remaining resources of Rs 13, 543 crore that is 15.8 percent are
available to the private sector funds. Total number of schemes offered by all funds is 311
out of which 182 are closed-ended; and 142 are open ended.
El-Khouri (1993) in his studies conducted on Risk-Return Relationship based
on Amman Stock Exchange data concluded that debt equity ratio appears to be
insignificantly correlated to required return in all regression.
RESEARCH METHODOLOGY AND EMPIRICAL RESULTS
The Sample
After 2002, mutual fund industry in Pakistan has witnessed significant changes
and growth in terms of private sector participation, divestment of public sector funds.
At present we have 33 funds–21 closed-ends, out of which 09 are the infant
commenced in between 2003 and 2004 some of which emerged due to divestment and
then merger of ICP funds while others are newly introduced. We have 12 open-end
funds, out of these funds 10 funds are infant, which introduced in between 2003 and
2004. As we are concerned with survivorship bias controlled data, ICP funds which no
more exist at the end of June 2004 and merged into other funds are excluded from the
research sample and other funds which have life of two to three years have also been
excluded from the evaluation. Rests of 14 funds out of total 33 funds have lived a long
life and still operative which serve our research purpose.
6. 868
Shah and Hijazi
Sources of Data
Annual reports of equity and balanced funds for the period from 1997 to 2004
have been used for data collection. For this purpose different sources have been
used; Asset Management Companies of the funds, Stock exchanges, SECP and
internet. Data for Treasury bills rate was collected from Statistical Bulletins of State
Bank of Pakistan.
Variables
Variables picked for the performance evaluation of mutual funds are net
income after taxes of funds, net asset value, number of certificates/shares outstanding,
earning per certificate and net asset value per certificate/share, monthly returns of
KSE 100 index. Six months Treasury bill rates. Return of fund was calculated
dividing return per certificate by opening net asset value per certificate. Return per
certificate was calculated dividing fund income after taxes by total number of
certificates outstanding for the year. Net asset value per certificate was calculated by
deducting total liabilities from total assets of the year or by taking shareholders
equity. Return of a fund may also be calculated dividing net income after taxes of a
fund by opening net assets of the fund for that year.
Methodology and Empirical Results
There are four models which are used worldwide for the performance
evaluation of mutual funds (1) Sharpe Measure (2) Treynor Measure (3) Jenson
differential Measure (4) Fama French Measure. We have used first three measures
excluding Fama French Measure. The reason for not using Fama French Model is
that for this model we needed data on book to market ratio for all companies listed at
KSE from 1997 to 2004 which could not be made available.
The Sharpe Model
In 1960 William F. Sharpe started to work on portfolio theory as thesis project.
He introduced the concept of risk free asset. Combing the risk free asset with the
Markowitz efficient portfolio he introduced the capital market line as the efficient
portfolio line.
The model given by Sharpe, 1 we can proceed further to use it for the
determination of expected rate of return for a risky asset, which led to the
development of CAPM capital asset pricing model. Through this model an investor
can know what should be the required rate of return for a risky asset. The required
rate of return has a great significance for the valuation of securities, by discounting
its cash flows with the required rate of return.
1
In 1990, Sharpe’s role in developing the CAPM was recognised by the Nobel Prize committee.
Sharpe shared the Nobel Memorial Prize in Economic Sciences that year with Markowitz and Merton
Miller, the University of Chicago Economist.
7. 869
Performance of Mutual Funds
In order to determine which portfolio offering the most favourable risk/return
trade-off, we compute the ratio of the historical returns in excess of the risk-free rate
to the standard deviation of the portfolio returns. The portfolio offering the highest
reward/risk ratio then is the only risky portfolio in which investors will choose to
invest. Using average returns of the portfolio uses Sharpe ratio to measure ex-post
portfolio performance.
Sharpe introduced the following reward to variability ratio (known as Sharpe
ratio):
Sharpe Ratio =
(Rp − R f )
δp
Rp = the observed average fund return;
Rf = the average risk free return;
δ p = the standard deviation of fund returns.
This model is used to measure the performance of a managed portfolio in
respect of return per unit of risk. This ratio also measures the portfolio manager’s
ability on the basis of rate of return performance and diversification by taking into
account total risk of the portfolio.
The study computes of the ratio of the historical returns, (ex-post returns) in
excess of the risk-free rate to the standard deviation of the portfolio returns of the funds
for the period from 1997 to 2004. Weighted average of six months Treasury bills rate was
used as a risk free rate. Results show, (Table 1) that some of the funds have negative
Table 1
Name of Fund
Closed-end Funds
Almeezan Mutual Fund
Asian Stock Fund
First Capital Fund
KASAB Premier Fund
Golden Arrow Fund
BSJS Balance Fund
Prudential Stock Fund
Safeway Mutual Fund
Tri Star Mutual Fund
ICP (SEMF)
4th ICP Mutual Fund
Open-end Fund
National Investment (Unit) Trust-equity Fund
Unit Trust of Pakistan–Balance Fund
Overall position/industry
Average
Return
1997-2004
Standard
Deviation
Sharpe
Ratio
0.2437
0.0248
0.0353
0.1863
0.1996
0.2053
0.0220
0.1486
–0.1706
0.3197
0.3162
0.2899
0.3663
0.3119
0.3851
0.2831
0.1849
0.2195
0.2918
0.7837
0.3105
0.2147
0.5483
–0.1636
–0.1584
0.2637
0.4057
0.6518
–0.2857
0.2189
–0.3258
0.7564
1.0778
0.2468
0.1770
0.1504
0.1757
0.0870
0.1384
0.9219
1.0597
0.4738
8. 870
Shah and Hijazi
sharpe ratio which indicate the managers inability in diversification but on overall
basis Sharpe ratio of funds is 0.47 (as compared to market which is 0.27) risk
premium of per one percent of standard deviation which shows better performance as
compared to market.
The Treynor Model
Treynor introduced two types of risks. One risk is called Systematic risk
which is associated with market and cannot be diversified away. However, this type
of risk can by calculated through “beta”. Treynor says that portfolio expected return
depend on its beta. The other type of risk which he separated from systematic risk is
unsystematic risk. Unsystematic risk is specific to a company. The uncertainty
attached with the specific company can be diversified away.
Treynor model is used to measure the performance of a managed portfolio in
respect of return per unit of risk (systemic risk). In this way the mutual fund
provides the highest return per unit of risk (systemic risk) will be preferred as
compared to the fund provides low return per unit of risk. Treynor ratio uses Beta as
a risk measure hence considers the Systematic risk. This ratio also measures the
portfolio manager’s ability on the basis of rate of return performance and
diversification by taking into account systemic risk of the portfolio. This ratio
measures the historical performance of managed portfolio in terms of return per unit
of risk (systemic risk).
Treynor Ratio =
(Rp − R f )
β
Rp = the observed average fund return;
Rf = the average risk free return;
β = coefficient as a measure of systematic risk.
Beta =
rm
ri
rf
n
=
=
=
=
∑ (rm − rf ) * (ri − rf ) − n * ∑ (rm − rf ) / n * ∑ (ri − rf ) / n −
∑ (rm − rf )2 − n * ∑ ((rm − rf ) / n))2
market return
portfolio return
risk free return
number of observations.
Treynor Ratio indicate that the portfolio offering the highest reward/risk
(systemic risk) ratio will be the only risky portfolio in which investors will choose to
invest. The assumption is that the portfolio manager has diversified away the
diversifiable risk (unsystematic risk/company specific risk) and the matter of concern
for the investor should be the systematic risk (non-diversifiable/market risk) only,
9. 871
Performance of Mutual Funds
instead of total risk. I computed the ratio of the historical returns, in excess of the
risk-free rate (T-Bill rate) to the systemic risk of the portfolio returns of the Pakistani
funds for the period from 1997 to 2004. Results show (Table 2) that all funds have
beta less than 1, in some cases significantly less than 1, regarding systemic risk we
can conclude that all mutual funds are defensive in their movement of returns as
compared to the market returns (KSE 100 index). Treynor ratio on overall
basis/industry is 0.13 risk premium of per one percent of systemic risk show
reasonable risk premium per one percent of systemic risk. If the diversifiable risk
which is company specific is fully diversified away by the funds portfolio manager,
the results of Sharpe ratio and Treynor ratio are same. Our funds are facing the
diversification problem that is why the results of both ratios are not the same.
Table 2
Name of Fund/Fund Objective
Closed-end Funds
Almeezan Mutual Fund
Asian Stock Fund
First Capital Fund
KASAB Premier Fund
Golden Arrow Fund
BSJS Balance Fund
Prudential Stock Fund
Safeway Mutual Fund
Tri Star Mutual Fund
ICP (SEMF)
4th ICP Mutual Fund
Open-end Funds
National Investment (Unit)Trust-equity Fund
Unit Trust of Pakistan—Balance Fund
Overall/Industry Position
Average
Return
1997-2004
Beta
Treynor
Ratio
0.2437
0.0248
0.0353
0.1863
0.1996
0.2053
0.0220
0.1486
–0.1706
0.3197
0.3162
0.75
0.83
0.63
0.93
0.71
0.41
0.54
0.62
0.28
0.38
0.15
0.2103
–0.0714
–0.0783
0.1093
0.1618
0.2911
–0.1162
0.1032
–0.9121
0.6183
1.5400
0.2468
0.1770
0.1504
0.64
0.17
0.50
0.2572
0.5428
0.1347
Jensen Differential Measure
Jensen in 1969 introduced alpha (α) in the capital asset pricing model to
measure the abnormal return of a portfolio—that is difference between the actual
average return earned by a portfolio and the return that should have been earned by
the portfolio given the market conditions and the risk of the portfolio.
Jensen measure is calculated as follows:
Rp – Rf = α p + β p [Rm – Rf] + €p
Rp = the observed returns of the portfolio;
10. 872
Shah and Hijazi
Rf
Rm
€p
α and β
= the risk free returns;
= the return on the market index; and
= the error term
= are the parameters of the model.
This measure has great appeal for practitioners as has been derived from
the capital market theory Jensen differential measure applied on the data of
mutual funds for the period from 1998 to 2004, the result shows (Table 3) that
although few funds show negative alpha but on overall basis funds industry
alpha is positive alpha of 6.03. Positive alpha of the mutual funds is an
indication that the funds outperform the market proxy—KSE 100 index by 0.86
percent per annum.
Table 3
Name of Fund
Closed-end Funds
Almeezan Mutual Fund
Asian Stock Fund
First Capital Fund
KASAB Premier Fund
Golden Arrow Fund
BSJS Balance Fund
Prudential Stock Fund
Safeway Mutual Fund
Tri Star Mutual Fund
ICP (SEMF)
4th ICP Mutual Fund
Open-end Funds
National Investment (Unit) Trust-equity Fund
Unit Trust of Pakistan—Balance Fund
Overall Position/Industry
Alpha
9.18
–13.06
–5.07
2.67
5.88
8.5
–11.20
1.20
–29.13
19.25
24.0
0.57
7.45
6.027
Results of descriptive statistics Table 4, show that in the last seven years
from 1998 to 2004 mutual funds, on average earned return of 15 percent with the
standard deviation of 13.8 percent, whereas market return in this period was 19.5
percent with the standard deviation of 40.5 percent which indicates the controlled
risk of funds. Therefore Sharpe ratio of funds is 0.47 (as compared to market
which is 0.27) risk premium of per one percent of standard deviation which
represents reasonable risk premium. This investigation also proves funds better
performance to the market.
11. Performance of Mutual Funds
873
Table 4
Descriptive Statistics
Descriptive Summary Statistics of Mutual Funds and KSE 100 Index
Returns from 1997-2004
Description
Mutual Funds
KSE 100 Index
Mean
0.150
0.195
Standard Deviation
0.138
0.405
Standard Error
0.038
0.153
Median
0.186
0.257
Minimum
–0.171
–0.560
Maximum
0.32
0.67
CONCLUSION
This paper provides an overview of the Pakistani mutual fund industry and
investigates the mutual funds risk adjusted performance using mutual fund performance
evaluation models. Survivorship bias controlled data of equity and balanced funds is used
for the performance evaluation of funds. Mutual fund industry in Pakistan is still in
growing phase. Result shows that on overall basis, funds industry outperform the market
proxy by 0.86 percent. They are investing in the market very defensively as evident from
their beta. Mutual Fund industry’s Sharpe ratio is 0.47 as compared to market that is 0.27
risk premium per one percent of standard deviation. Results of Jensen differential
measure also show positive after cost alpha. Hence overall results suggest that mutual
funds in Pakistan are able to add value. Where as results also show some of the funds
under perform, these funds are facing the diversification problem. Worldwide there had
been a tremendous growth in this industry; this growth in mutual funds worldwide is
because of the overall growth in both the size and maturity of many foreign capital
markets, we are far behind. The need of an hour is to mobilise saving of the individual
investors through the offering of variety of funds (with different investment objectives).
The funds should also disclose the level of risk associated with return in their annual
reports for the information of investors and prospective investors. This will enable the
investors to compare the level of return with the level of risk. The success of this sector
depends on the performance of funds industry and the role of regulatory bodies. Excellent
performance and stringent regulations will increase the popularity of mutual funds in
Pakistan.
REFERENCES
Bauer, Rob, Keen Koedijk, and Roger Otter (2002) International Evidence on
Ethical Mutual Fund Performance and Investment Style. ABP Investments
Maastricht University, 1–28.
12. 874
Shah and Hijazi
Blake, David, and Allan Timmermann (1998) Mutual Fund Performance: Evidence
from UK. European Finance Review 2, 57–77.
Dechow, Patricia M., G. Sloan Richard, and Mark T. Soliman (2004) Implied Equity
Duration: A New Measure of Equity Risk. Review of Accounting Studies 9, 197–
225.
El Khouri, Ritab (1993) Risk-Return Relationship: Evidence from Amman Stock
Exchange. Yarmouk University The Middle East Business and Economic Review
5:2.
Elton, E., M. Gruber, S. Das, and C. Blake (1996) The Persistence of Risk-adjusted
Mutual Fund Performance. Journal of Business 69, 133–157.
Gupta, O. P., and Amitabh Gupta (2001) Research Methodology for Performance
Evaluation of Mutual Funds. Chandigarh: University Business School, Panjab
University, Chapter 30.
Jensen, C. Michael (1968) The Performance of Mutual Funds in the Period 1945–
1964. Journal of Finance 23:2, 389–416.
Luther, Matatko, and Corner (1992) The Investment Performance of UK “Ethical”
Unit Trusts. Journal of Accounting, Auditing and Accountability 5:4, April.
Malkiel, Burton G., and Radisich (2001) The Growth of Index Funds and the Pricing
of Equity Securities. Journal of Portfolio Management 26:2, 9–21.
Otten, Roger, and Dennis Bams (2004) How to Measure Mutual Funds
Performance: Economic Versus Statistical Relevance. Journal of Accounting and
Finance 44, 203–222.
Roger, Otten, and Dennis Bams (2002) European Mutual Fund Performance.
European Financial Management 8:1, 75–101.
Sharpe, William F. (1966) Mutual Fund Performance. Journal of Business 39
(January), Supplement on Security Prices, 119–38.
Warmer, R. (2000) Mutual Funds Performance: An Empirical Decomposition into
Stock-picking Talent, Styles, Transaction Cost and Expenses. Journal of Finance
4: August.
13. Comments
The authors deserve appreciations for choosing this topic at a time when the
mutual funds are rapidly growing worldwide because of the expansion of the growth
and expansion in international capital markets. The authors also deserve appreciation
for exploring a research area which can contribute towards an understanding how
savings could be mobilised through mutual funds in Pakistan. The historical
performance of mutual funds further highlights their importance as these funds have
shown tremendous increase during the past decade. I agree with the authors that in
our country, people avoid interest-based conventional schemes of investment. If
alternative schemes are provided which are religiously permissible, this can certainly
boost up savings in the country and mutual funds can offer such opportunity.
With these appreciations, I would like to point out some areas where authors
can pay more attention while revising their paper for final submission.
It is sometimes a matter of concern how different classes of investors perceive
the risk and return hence investors’ perception needs to be considered as essential
ingredient of the rating process. A study indicates two factors which may affect the
perception of investors’ risk and their investment decision; (i) index-based
investment, and (ii) investors’ perception of the market capitalisation. According to
PACRA’s sources (newspapers of September 1, 2004) ‘Every mutual fund investor
has a distinct set of investment objectives and preferences. It is, therefore, difficult to
capture these preferences in a single yardstick for guiding investment decisions’.
Hence a new methodology has been pioneered by PACRA for rating of mutual funds
and asset managers in Pakistan. The first such rating was carried out in 1999. This
rating provides a measure of the asset managers’ capacity to master the risk inherent
in asset management. It covers the assessment of the quality of business structure,
independence, control and communication systems, investment process and risk
management. Since the paper is about Pakistan, it may add to the value of paper if
PACRA’s methodology is included in the review of literature and is also considered
for analysis if feasible.
PACRA divides different funds into four groups:
Income Fund: a fund that primarily invests in debt securities including
money market instruments.
Equity Fund: a fund that primarily invests in equity securities.
Balanced Fund: a fund that carries a reasonable mix of equity and debt
securities.
Islamic Fund: a fund that invests in Shariah compliant instruments only.
14. 876
Nisar H. Hamdani
The evaluation by groups may provide absolute and risk adjusted performance
of fund and is comparable evaluation of whether the fund has been managed by
manager’s skill or by market circumstances (see http://www.pacra.com/ for details
about PACRA’s detailed Asset Manager Rating Methodology).
The paper applies three popular measures of performance such as Jensen
index, Treynor index and Sharpe index. It however, does not explain why two other
measures in addition to the above mentioned three measures of performance have not
been considered. These measures are Sharpe Differential Return and Fama’s
Decomposition(2). There is a need to consider the measure which may capture the
effect of unexpected events as 9/11 or recent earthquake.
Another point may be helpful for the authors that they have used Tyenor
measure in the analysis but the study has neither been referred in the main text nor in
references. Sharpe’s and Jenson’s references are is also missing. Sharpe’s story of
noble prize also seems redundant. It can be put in the footnote. The review of
literature may be made more consistent. It is also suggested that in the tables given at
the end, significance of parameters should be given for a better understanding of the
trends.
Nisar H. Hamdani
University of Azad Jammu and Kashmir,
Muzaffarabad.