Downloaded 39 times


![CoinGecko 2024 Q3 Crypto Industry Report
Track DEXes and real-time cryptocurrency prices on www.geckoterminal.com.
Stay updated with GeckoTerminal:
by
Mobile Price Alerts
Now available on iOS and
Android! Get price alerts for
your favorite tokens on-the-go.
[Quick guide]
Top Holders Tab
Get the total no. of token holders,
token distribution among holders,
and details of the top 50 largest
holders – now available on Solana,
TON, SUI, and more networks soon.
What’s new?
Trending Categories
View the list of hottest and rising
categories in the DEX space,
curated by GeckoTerminal.
[Check it out]
171
Blockchains
1,200+
DEXes
4.4M+
Pools
3.8M+
Tokens
Get market
data for:](https://image.slidesharecdn.com/2024q3cryptoindustryreport-241014073954-62b961c7/75/2024-Q3-Crypto-Industry-Report-CoinGecko-28-2048.jpg)


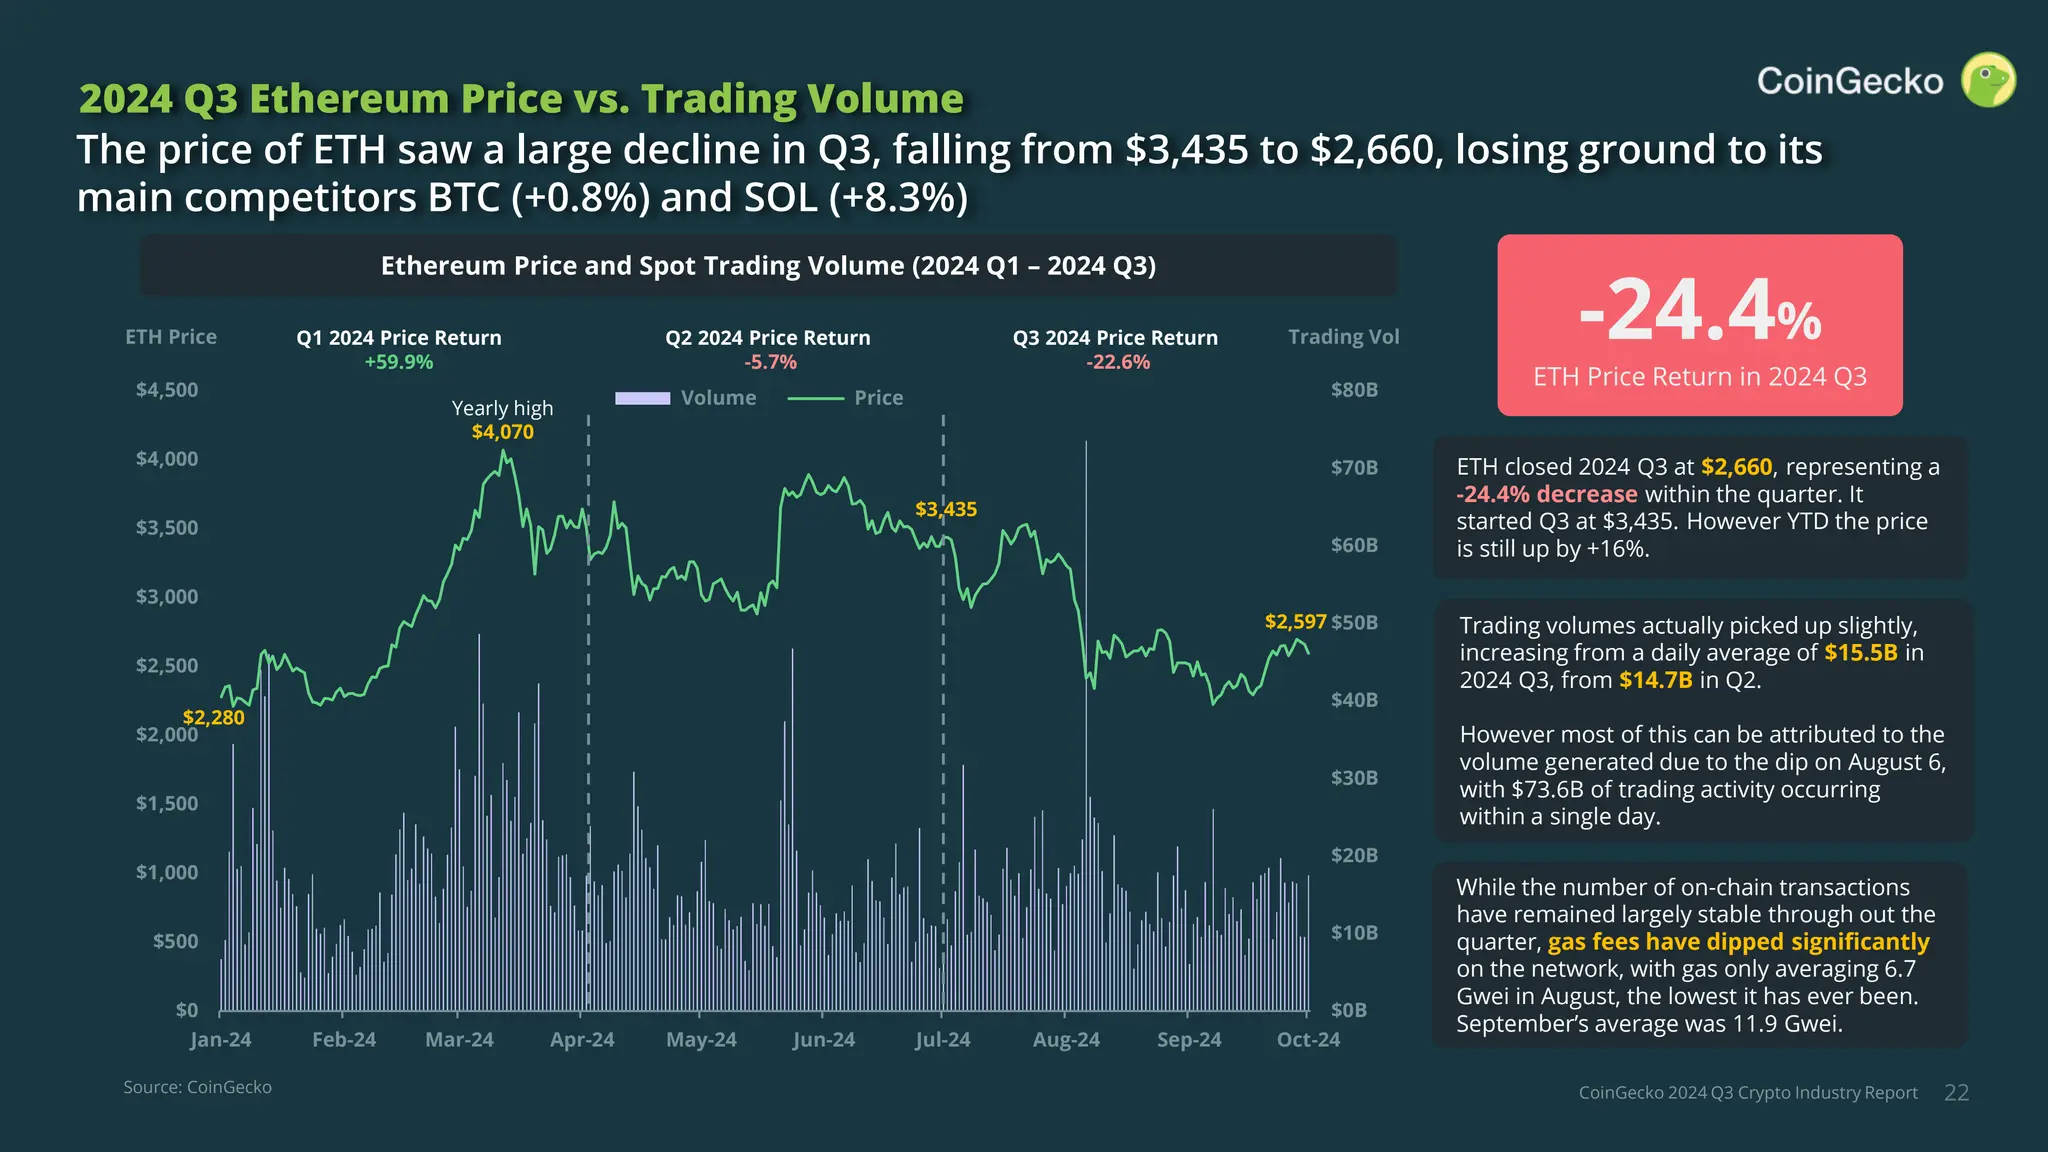
The CoinGecko Q3 2024 Crypto Industry Report highlights that the total crypto market cap remained flat at $2.33 trillion amidst significant volatility influenced by macroeconomic factors and geopolitical events. Bitcoin saw an increase in dominance while Ethereum declined, and several stablecoins experienced growth with USDT and USDC leading the market. Additionally, notable trends included the rise of memecoins, stablecoin interest, and developments in prediction markets due to the US presidential elections.