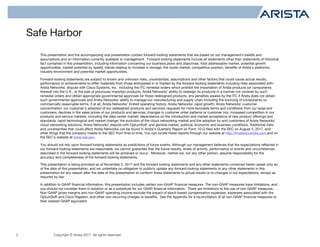
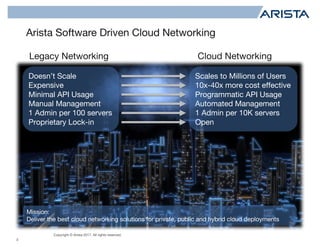
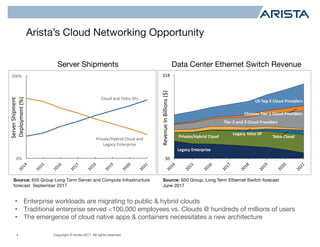
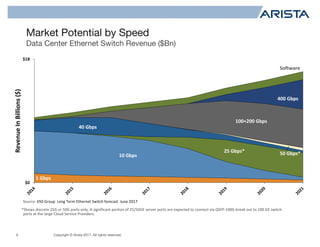
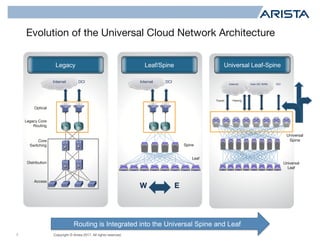
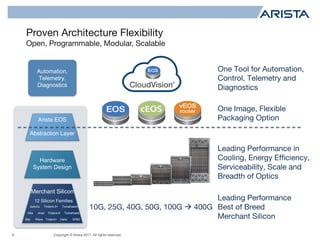
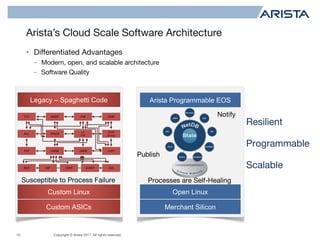
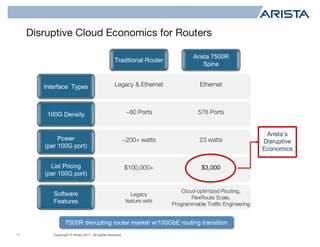
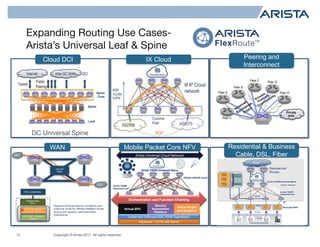
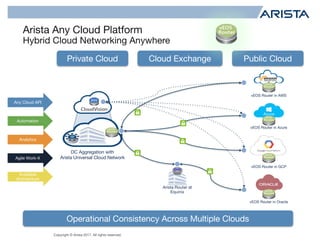
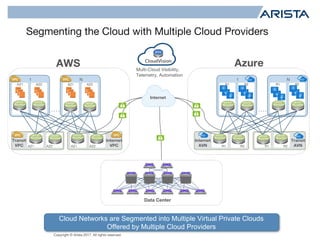
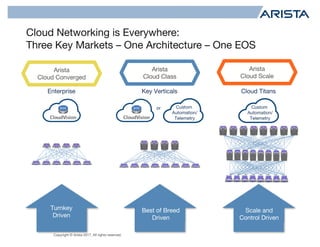
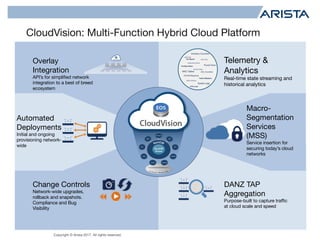
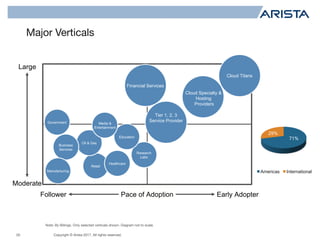
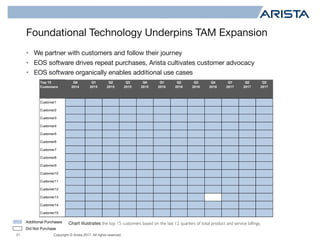
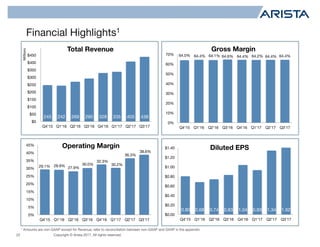
More Related Content
Similar to 2017 highlights-q3 (20)
2017 highlights-q3
- 1. Copyright © Arista 2017. All rights reserved.Copyright © Arista 2017. All rights reserved.
Arista in Q3 2017
- 2. Copyright © Arista 2017. All rights reserved.
Safe Harbor
2
This presentation and the accompanying oral presentation contain forward-looking statements that are based on our management’s beliefs and
assumptions and on information currently available to management. Forward-looking statements include all statements other than statements of historical
fact contained in this presentation, including information concerning our business plans and objectives, total addressable market, potential growth
opportunities, market potential by speed, trends relating to increase in storage, the router market, competitive position, benefits of Arista’s platforms,
industry environment and potential market opportunities.
Forward-looking statements are subject to known and unknown risks, uncertainties, assumptions and other factors that could cause actual results,
performance or achievements to differ materially from those anticipated in or implied by the forward-looking statements including risks associated with:
Arista Networks’ dispute with Cisco Systems, Inc. including the ITC remedial orders which prohibit the importation of Arista products (or components
thereof) into the U.S., or the sale of previously imported products, Arista Networks’ ability to redesign its products in a manner not covered by such
remedial orders and obtain appropriate governmental approvals for those redesigned products, any penalties assess by the ITC if Arista does not obtain
such governmental approvals and Arista Networks’ ability to manage our manufacturing and supply chain including the sourcing of components on
commercially reasonable terms, if at all; Arista Networks’ limited operating history; Arista Networks’ rapid growth; Arista Networks’ customer
concentration; our customer’s adoption of our redesigned products and services; requests for more favorable terms and conditions from our large end
customers; declines in the sales prices of our products and services; changes in customer order patterns or customer mix; increased competition in our
products and service markets, including the data center market; dependence on the introduction and market acceptance of new product offerings and
standards; rapid technological and market change; the evolution of the cloud networking market and the adoption by end customers of Arista Networks’
cloud networking solutions; Arista Networks’ dispute with OptumSoft; and general market, political, economic and business conditions. Additional risks
and uncertainties that could affect Arista Networks can be found in Arista’s Quarterly Report on Form 10-Q filed with the SEC on August 4, 2017, and
other filings that the company makes to the SEC from time to time. You can locate these reports through our website at http://investors.arista.com and on
the SEC’s website at www.sec.gov.
You should not rely upon forward-looking statements as predictions of future events. Although our management believes that the expectations reflected in
our forward-looking statements are reasonable, we cannot guarantee that the future results, levels of activity, performance or events and circumstances
described in the forward-looking statements will be achieved or occur. Moreover, neither we, nor any other person, assume responsibility for the
accuracy and completeness of the forward-looking statements.
This presentation is being provided as of November 2, 2017 and the forward looking statements and any other statements contained herein speak only as
of the date of this presentation, and we undertake no obligation to publicly update any forward-looking statements or any other statements in this
presentation for any reason after the date of this presentation to conform these statements to actual results or to changes in our expectations, except as
required by law.
In addition to GAAP financial information, this presentation includes certain non-GAAP financial measures. The non-GAAP measures have limitations, and
you should not consider them in isolation or as a substitute for our GAAP financial information. There are limitations to the use of non-GAAP measures.
Non-GAAP gross margins and non-GAAP operating income exclude the impact of stock-based compensation expenses, expenses associated with the
OptumSoft and Cisco litigation, and other non-recurring charges or benefits. See the Appendix for a reconciliation of all non-GAAP financial measures to
their nearest GAAP equivalent.
- 3. Copyright © Arista 2017. All rights reserved.
Arista Software Driven Cloud Networking
3
Doesn’t Scale
Expensive
Minimal API Usage
Manual Management
1 Admin per 100 servers
Proprietary Lock-in
Scales to Millions of Users
10x-40x more cost effective
Programmatic API Usage
Automated Management
1 Admin per 10K servers
Open
Legacy Networking Cloud Networking
Mission:
Deliver the best cloud networking solutions for private, public and hybrid cloud deployments
- 4. Copyright © Arista 2017. All rights reserved.
Arista’s Cloud Networking Opportunity
4
Source: 650 Group Long Term Server and Compute Infrastructure
forecast September 2017
Server Shipments Data Center Ethernet Switch Revenue
• Enterprise workloads are migrating to public & hybrid clouds
• Traditional enterprise served <100,000 employees vs. Clouds @ hundreds of millions of users
• The emergence of cloud native apps & containers necessitates a new architecture
Source: 650 Group, Long Term Ethernet Switch forecast
June 2017
$0
$18
Revenue In Billions ($)
Legacy Telco SP
Private/Hybrid Cloud
Legacy Enterprise
Chinese Tier 1 Cloud Providers
Tier 2 and 3 Cloud Providers
US Top 5 Cloud Providers
Telco Cloud
0%
100%
Server Shipment
Deployment (%)
Cloud and Telco SPs
Private/Hybrid Cloud and
Legacy Enterprise
- 5. Copyright © Arista 2017. All rights reserved.
Share in Dollars Share in Ports
Note: Excludes blade switches
Source: Crehan Research Datacenter Switch Market Share Report Q2’2017
Arista
Cisco
Arista
Cisco
Arista Market Share vs Cisco
High Speed Data Center Switching Market
- 6. Copyright © Arista 2017. All rights reserved.
Market Potential by Speed
Data Center Ethernet Switch Revenue ($Bn)
6
1 GE
10 GE
40 GE
> 100 GE
50 GE*
25 GE*
Source: 650 Group Long Term Ethernet Switch forecast June 2017
*Shows discrete 25G or 50G ports only. A significant portion of 25/50GE server ports are expected to connect via QSFP-100G break out to 100 GE switch
ports at the large Cloud Service Providers.
$0
$18
Revenue In Billions ($)
25 Gbps*
10 Gbps
1 Gbps
40 Gbps
100+200 Gbps
400 Gbps
Software
50 Gbps*
- 7. Copyright © Arista 2017. All rights reserved.
Evolution of the Universal Cloud Network Architecture
7
Access
Distribution
Core
Switching
Legacy Core
Routing
Optical
DCIInternet DCIInternet
Spine
Leaf
EW
Universal
Spine
DCI
Transit Peering
Universal
Leaf
Internet Inter-DC WAN
Universal Leaf-SpineLeaf/SpineLegacy
Routing is Integrated into the Universal Spine and Leaf
- 8. Copyright © Arista 2017. All rights reserved.
Proven Architecture Flexibility
Open, Programmable, Modular, Scalable
8
One Image, Flexible
Packaging Option
One Tool for Automation,
Control, Telemetry and
Diagnostics
Arista EOS
Abstraction Layer
Hardware
System Design
Merchant Silicon
10G, 25G, 40G, 50G, 100G à 400G
Leading Performance in
Cooling, Energy Efficiency,
Serviceability, Scale and
Breadth of Optics
Leading Performance
Best of Breed
Merchant SiliconBali
Alta
Petra
Arad
Jericho
Trident+
Trident-II
Trident-II+
Tomahawk
Tomahawk+
Helix XP80
12 Silicon Families
Automation,
Telemetry,
Diagnostics
- 9. Copyright © Arista 2017. All rights reserved.
A Single Image Architecture Underpins a Sustainable
Competitive Advantage
9
Switching,
Routing, DCI on
Universal Leaf,
Universal Spine
Containerized
EOS, running on
Arista or whitebox
*PICs – Places in the Cloud – i.e. On Premise Leaf/Spine, CoLo, Public Cloud
Q: Why a single image?
A: It improves network availability, saves time and money. How? Dramatically reduces new
release qualification time. Simplifies PIC interoperability. Simplifies and scales automation.
Seamless
Private/Hybrid
Cloud Integration
- 10. Copyright © Arista 2017. All rights reserved.
Arista’s Cloud Scale Software Architecture
10
Processes are Self-Healing
Legacy – Spaghetti Code Arista Programmable EOS
Susceptible to Process Failure
OTV MSDP PIM IGMP
IGMP
Snoop
CoPP
ISISEIGRPOSPFRIPBGP
STP
ACL
U4RIB U6RIB
IPQOS
LC
FIB
Custom Linux Open Linux
Custom ASICs Merchant Silicon
Publish
Notify
Scalable
Resilient
Programmable
• Differentiated Advantages
- Modern, open, and scalable architecture
- Software Quality
- 11. Copyright © Arista 2017. All rights reserved.
Disruptive Cloud Economics for Routers
11
Interface Types
100G Density
Software
Features
Power
(per 100G port)
List Pricing
(per 100G port)
Legacy & Ethernet Ethernet
~80 Ports 576 Ports
~200+ watts 23 watts
$100,000+ $3,000
Legacy
feature sets
Cloud-optimized Routing,
FlexRoute Scale,
Programmable Traffic Engineering
Traditional Router
Arista 7500R
Spine
7500R disrupting router market w/100GbE routing transition
Arista’s
Disruptive
Economics
- 12. Copyright © Arista 2017. All rights reserved.
Expanding Routing Use Cases-
Arista’s Universal Leaf & Spine
12
DC Universal Spine
Cloud DCI
Spine
Leaf
Internet
Inter-DC WAN
Spine
Core
DCI
Transit
Public
Peering
Cloud DC
Cloud DCI
Universal
Spine
Spine
Leaf
Spine
Core
Spine
Leaf
AS2906 AS8075
IX IP Cloud
network
Customer
Edge
BGP
VxLAN
EVPN
BGP
IX CloudIX Cloud
Content Provider
Peer D
Peer E
Peer C
Peer F Peer G
Peer H
Private
WAN
Peering and
Interconnect
Residential & Business
Cable, DSL, Fiber
Path computation
IGP, BGP - Segment
Routing
MPLS TE signaling
Programmatic
API’s
DC2
DC1
Segment Routing reduces complexity and
improves scale by offering intelligent source
routing with globally optimized traffic
engineering
x
Inter-DC
Traffic
WAN
WAN
Residential
Router
Cloud network
Arista 7500R Universal Spine
Arista 7280R
Universal Leaf
x86
vCMTS /
vCCAP
vCMTS /
vCCAP
vCMTS /
vCCAP
Remote PHY
Cable Headend NFV
IP
RPHY
Customer premise
Fiber
Cable
Headend
RPHY RPHY RPHY
Coax
Arista 7500R Universal Spine
Arista 7280R
Universal Leaf
Arista Universal Cloud Network
Orchestration and Function Chaining
25GbE/100GbE Cloud
Hardware – COTS x86 Server
Hypervisor (VMware ESXi, KVM/ Openstack)
Virtual EPC
Virtual Probe
and Analytics
Service
Automation
Platform
Mobile Packet Core NFV
- 13. Copyright © Arista 2017. All rights reserved.
Arista Any Cloud Platform
Hybrid Cloud Networking Anywhere
13
Operational Consistency Across Multiple Clouds
Arista Router at
Equinix
DC Aggregation with
Arista Universal Cloud Network
vEOS Router in AWS
vEOS Router in Azure
vEOS Router in Oracle
Private Cloud Public Cloud
Analytics
Automation
Any Cloud API
Agile Work-X
Available
Architecture
Cloud Exchange
vEOS Router in GCP
- 14. Copyright © Arista 2017. All rights reserved.
Internet
AVN
Internet
VPC
Transit
AVN
Data Center
AZ1 AZ2 AZ1 AZ2
AZ2
1 N
AZ1 AZ2AZ1
R1 R2 R1 R2
R2
1 N
R1 R2R1
Internet
Transit
VPC
AWS Azure
Segmenting the Cloud with Multiple Cloud Providers
Cloud Networks are Segmented into Multiple Virtual Private Clouds
Offered by Multiple Cloud Providers
Multi-Cloud Visibility,
Telemetry, Automation
- 15. Copyright © Arista 2017. All rights reserved.
Expanding Ecosystem
15
Virtualization/
Containers
Cloud and
Storage
Leaders
Network
Security /
Workflow
Automation
• Drive Automation with best of breed partners: security, overlays, orchestration, and storage
• Advanced Analytics and network wide services
• Any Work-X with CloudVision for workloads, workflows and work-streams
Analytics
Automation
Any Cloud API
Agile Work-X
Available
Architecture
- 16. Copyright © Arista 2017. All rights reserved.
Cloud-Class Market Leadership Platform Portfolio
16
Diverse Merchant Silicon Architectures
Single-Image Arista EOS Across All Platforms
7500E/R Series
7150, 7160 & 7280R Series7050X/7060X Series
Leaf
EOS
7300X
Series
Spine/SplineTMLeaf
Volume Value
- 17. Copyright © Arista 2017. All rights reserved.
Scaling up the Cloud
Next Generation (R2) Universal Spine and Leaf
Common single EOS
image, Deep Buffer,
Lossless Architecture,
Large Tables
Choice of form factors,
density and port speeds
for varying use cases
Standards based switching
for reliable deployments
48 10/25G-SFP / 6 QSFP100
1.3M FlexRoute and AlgoMatch
7500R Systems
60 QSFP100
1.3M and 2M FlexRoute, AlgoMatch and sFlow
30 QSFP100
1.3M and 2M FlexRoute, AlgoMatch and sFlow
7500R Universal Spine
7280R Universal Leaf
36 100G QSFP ports
MACSEC and 1.3M FlexRoute
36 100G QSFP ports
1.3M and 2M FlexRoute, AlgoMatch and sFlow
18 100G QSFP ports
1.3M FlexRoute
48 10G/25-SFP+, 2 x 100G ports
2M FlexRoute, AlgoMatch and sFlow
7500R Line Cards
- 18. Copyright © Arista 2017. All rights reserved.
Cloud Networking is Everywhere:
Three Key Markets – One Architecture – One EOS
18
Turnkey
Driven
Arista
Cloud Converged
Enterprise
Best of Breed
Driven
Arista
Cloud Class
Custom
Automation/
Telemetry
or
Key Verticals
Scale and
Control Driven
Arista
Cloud Scale
Custom
Automation/
Telemetry
Cloud Titans
- 19. Copyright © Arista 2017. All rights reserved.
CloudVision: Multi-Function Hybrid Cloud Platform
Overlay
Integration
API’s for simplified network
integration to a best of breed
ecosystem
Change Controls
Network-wide upgrades,
rollback and snapshots.
Compliance and Bug
Visibility
Telemetry &
Analytics
Real-time state streaming and
historical analytics
DANZ TAP
Aggregation
Purpose-built to capture traffic
at cloud scale and speed
Automated
Deployments
Initial and ongoing
provisioning network-
wide
Macro-
Segmentation
Services
(MSS)
Service insertion for
securing today’s cloud
networks
- 20. Copyright © Arista 2017. All rights reserved.
Major Verticals
20
Note: By Billings. Only selected verticals shown. Diagram not to scale.
71%
29%
Americas International
Moderate
Large
Follower Early AdopterPace of Adoption
Financial Services
Tier 1, 2, 3
Service Provider
Cloud Specialty &
Hosting
Providers
Rest of
Enterprise
Cloud Titans
Retail
Government
Oil & Gas
Business
Services
Manufacturing
Research
Labs
Healthcare
Education
Media &
Entertainment
- 21. Copyright © Arista 2017. All rights reserved.
Foundational Technology Underpins TAM Expansion
• We partner with customers and follow their journey
• EOS software drives repeat purchases, Arista cultivates customer advocacy
• EOS software organically enables additional use cases
21
Chart illustrates the top 15 customers based on the last 12 quarters of total product and service billings.Additional Purchases
Did Not Purchase
Top 15
Customers
Q4
2014
Q1
2015
Q2
2015
Q3
2015
Q4
2015
Q1
2016
Q2
2016
Q3
2016
Q4
2016
Q1
2017
Q2
2017
Q3
2017
Customer1
Customer2
Customer3
Customer4
Customer5
Customer6
Customer7
Customer8
Customer9
Customer10
Customer11
Customer12
Customer13
Customer14
Customer15
- 22. Copyright © Arista 2017. All rights reserved.
1 Amounts are non-GAAP except for Revenue; refer to reconciliation between non-GAAP and GAAP in the appendix.
22
Financial Highlights1
245 242 269 290 328 335 405 438
$0
$50
$100
$150
$200
$250
$300
$350
$400
$450
Q4'15 Q1'16 Q2'16 Q3'16 Q4'16 Q1'17 Q2'17 Q3'17
Millions
Total Revenue
64.0% 64.4% 64.1% 64.6% 64.4% 64.2% 64.4% 64.4%
0%
10%
20%
30%
40%
50%
60%
70%
Q4'15 Q1'16 Q2'16 Q3'16 Q4'16 Q1'17 Q2'17 Q3'17
Gross Margin
29.1% 28.9% 27.9%
30.0%
32.3%
30.2%
36.3%
38.6%
0%
5%
10%
15%
20%
25%
30%
35%
40%
45%
Q4'15 Q1'16 Q2'16 Q3'16 Q4'16 Q1'17 Q2'17 Q3'17
Operating Margin
0.80 0.68 0.74 0.83 1.04 0.93 1.34 1.62
$0.00
$0.20
$0.40
$0.60
$0.80
$1.00
$1.20
$1.40
Q4'15 Q1'16 Q2'16 Q3'16 Q4'16 Q1'17 Q2'17 Q3'17
Diluted EPS
- 23. Copyright © Arista 2017. All rights reserved.23
Balance Sheet & Cash Conversion Cycle
210 253 209 270 213
67
71
56
61
45
0
10
20
30
40
50
60
70
80
$0
$50
$100
$150
$200
$250
$300
Q3'16 Q4'16 Q1'17 Q2'17 Q3'17
Millions
AR and DSO AR
DSO
162 236 287 364 333
2.7
2.2
1.7 1.6 1.7
0.0
0.5
1.0
1.5
2.0
2.5
3.0
$0
$50
$100
$150
$200
$250
$300
$350
$400
Q3'16 Q4'16 Q1'17 Q2'17 Q3'17
Millions
Inventory and Turns
Inventory
Turns
133
177
228 232
244
0
50
100
150
200
250
300
Q3'16 Q4'16 Q1'17 Q2'17 Q3'17
Cash Conversion Cycle
(R)
800 868 1,043 1,125 1,343
$0
$100
$200
$300
$400
$500
$600
$700
$800
$900
$1,000
$1,100
$1,200
$1,300
$1,400
Q3'16 Q4'16 Q1'17 Q2'17 Q3'17
Millions
(R)
Cash, Cash Equivalents &
Marketable Securities
- 24. Copyright © Arista 2017. All rights reserved.
Arista in Q3 2017
24
Mission:
Deliver the best cloud networking solutions for private, public and hybrid cloud deployments
Key Highlights Financial Results (non-GAAP)1
1 Amounts are non-GAAP except for Revenue; refer to reconciliation between non-GAAP and GAAP in the appendix.
Introduced Arista Any Cloud software
platform, reducing operational costs and
complexity for enterprises by simplifying
integration and management of hybrid
clouds across private cloud datacenters and
public cloud providers.
Arista Networks makes the top 10 in
FORTUNE magazines 100 Fastest-Growing
Companies September 2017 issue.
Continued adoption of Cloud Networking
across key verticals.
Q3’17 Revenue: $437.6M
Q3’17 EPS: $1.62
Q3’16-Q3’17 YOY Revenue Growth: 51%
Q3’17 Gross Margin: 64.4%
Q3’17 Operating Margin: 38.6%
- 25. Copyright © Arista 2017. All rights reserved.25
Appendix: GAAP to Non-GAAP Reconciliation
In 000's except per share data Q4’15 Q1’16 Q2’16 Q3’16 Q4’16 Q1’17 Q2'17 Q3'17
GAAP gross profit $ 156,168 $ 155,090 $ 171,451 $ 186,420 $ 210,155 $ 214,210 $ 259,777 $ 280,617
GAAP gross margin 63.6% 64.0% 63.8% 64.2% 64.1% 63.9% 64.1% 64.1%
Stock-based compensation expense 842 793 868 955 1,004 1,024 1,087 1,113
Non-GAAP gross profit $ 157,010 $ 155,883 $ 172,319 $ 187,375 $ 211,159 $ 215,234 $ 260,864 $ 281,730
Non-GAAP gross margin 64.0% 64.4% 64.1% 64.6% 64.4% 64.2% 64.4% 64.4%
GAAP income from operations $ 49,397 $ 49,735 $ 53,158 $ 63,021 $ 77,495 $ 73,418 $ 116,634 $ 140,832
GAAP operating margin 20.1% 20.5% 19.8% 21.7% 23.6% 21.9% 28.8% 32.2%
Stock-based compensation expense 12,978 13,360 14,232 15,116 16,324 16,439 18,400 20,152
Litgation expenses 8,956 7,005 7,594 9,025 12,209 11,466 11,957 7,857
Non-GAAP income from operations $ 71,331 $ 70,100 $ 74,984 $ 87,162 $ 106,028 $ 101,323 $ 146,991 $ 168,841
Non-GAAP operating margin 29.1% 28.9% 27.9% 30.0% 32.3% 30.2% 36.3% 38.6%
GAAP diluted net income to common stockholders $ 43,464 $ 34,941 $ 38,635 $ 50,980 $ 58,542 $ 82,716 $ 102,474 $ 133,555
Net income attributable to participating securities 460 304 269 277 241 245 211 167
Stock-based compensation expense 12,978 13,360 14,232 15,116 16,324 16,439 18,400 20,152
Litigation expenses 8,956 7,005 7,594 9,025 12,209 11,466 11,957 7,857
Excess tax benefits on stock-based awards - - - - - (28,790) (19,079) (23,826)
Release of income tax reserves (968) - - (6,293) - - - -
Tax effect of non-GAAP exclusions (7,424) (6,524) (7,056) (7,924) (9,836) (10,269) (8,493) (9,683)
Non-GAAP net income $ 57,466 $ 49,086 $ 53,674 $ 61,181 $ 77,480 $ 71,807 $ 105,470 $ 128,222
GAAP diluted income per share to common stockholders $ 0.60 $ 0.48 $ 0.53 $ 0.69 $ 0.79 $ 1.07 $ 1.30 $ 1.68
Non-GAAP adjustments to net income per share 0.20 0.20 0.21 0.14 0.25 (0.14) 0.04 (0.06)
Non-GAAP diluted income per share $ 0.80 $ 0.68 $ 0.74 $ 0.83 $ 1.04 $ 0.93 $ 1.34 $ 1.62
GAAP and non-GAAP weighted diluted shares 72,062 72,214 72,817 73,453 74,384 77,516 78,756 79,322
- 26. Copyright © Arista 2017. All rights reserved.Copyright © Arista 2017. All rights reserved.
www.arista.com
Thank You