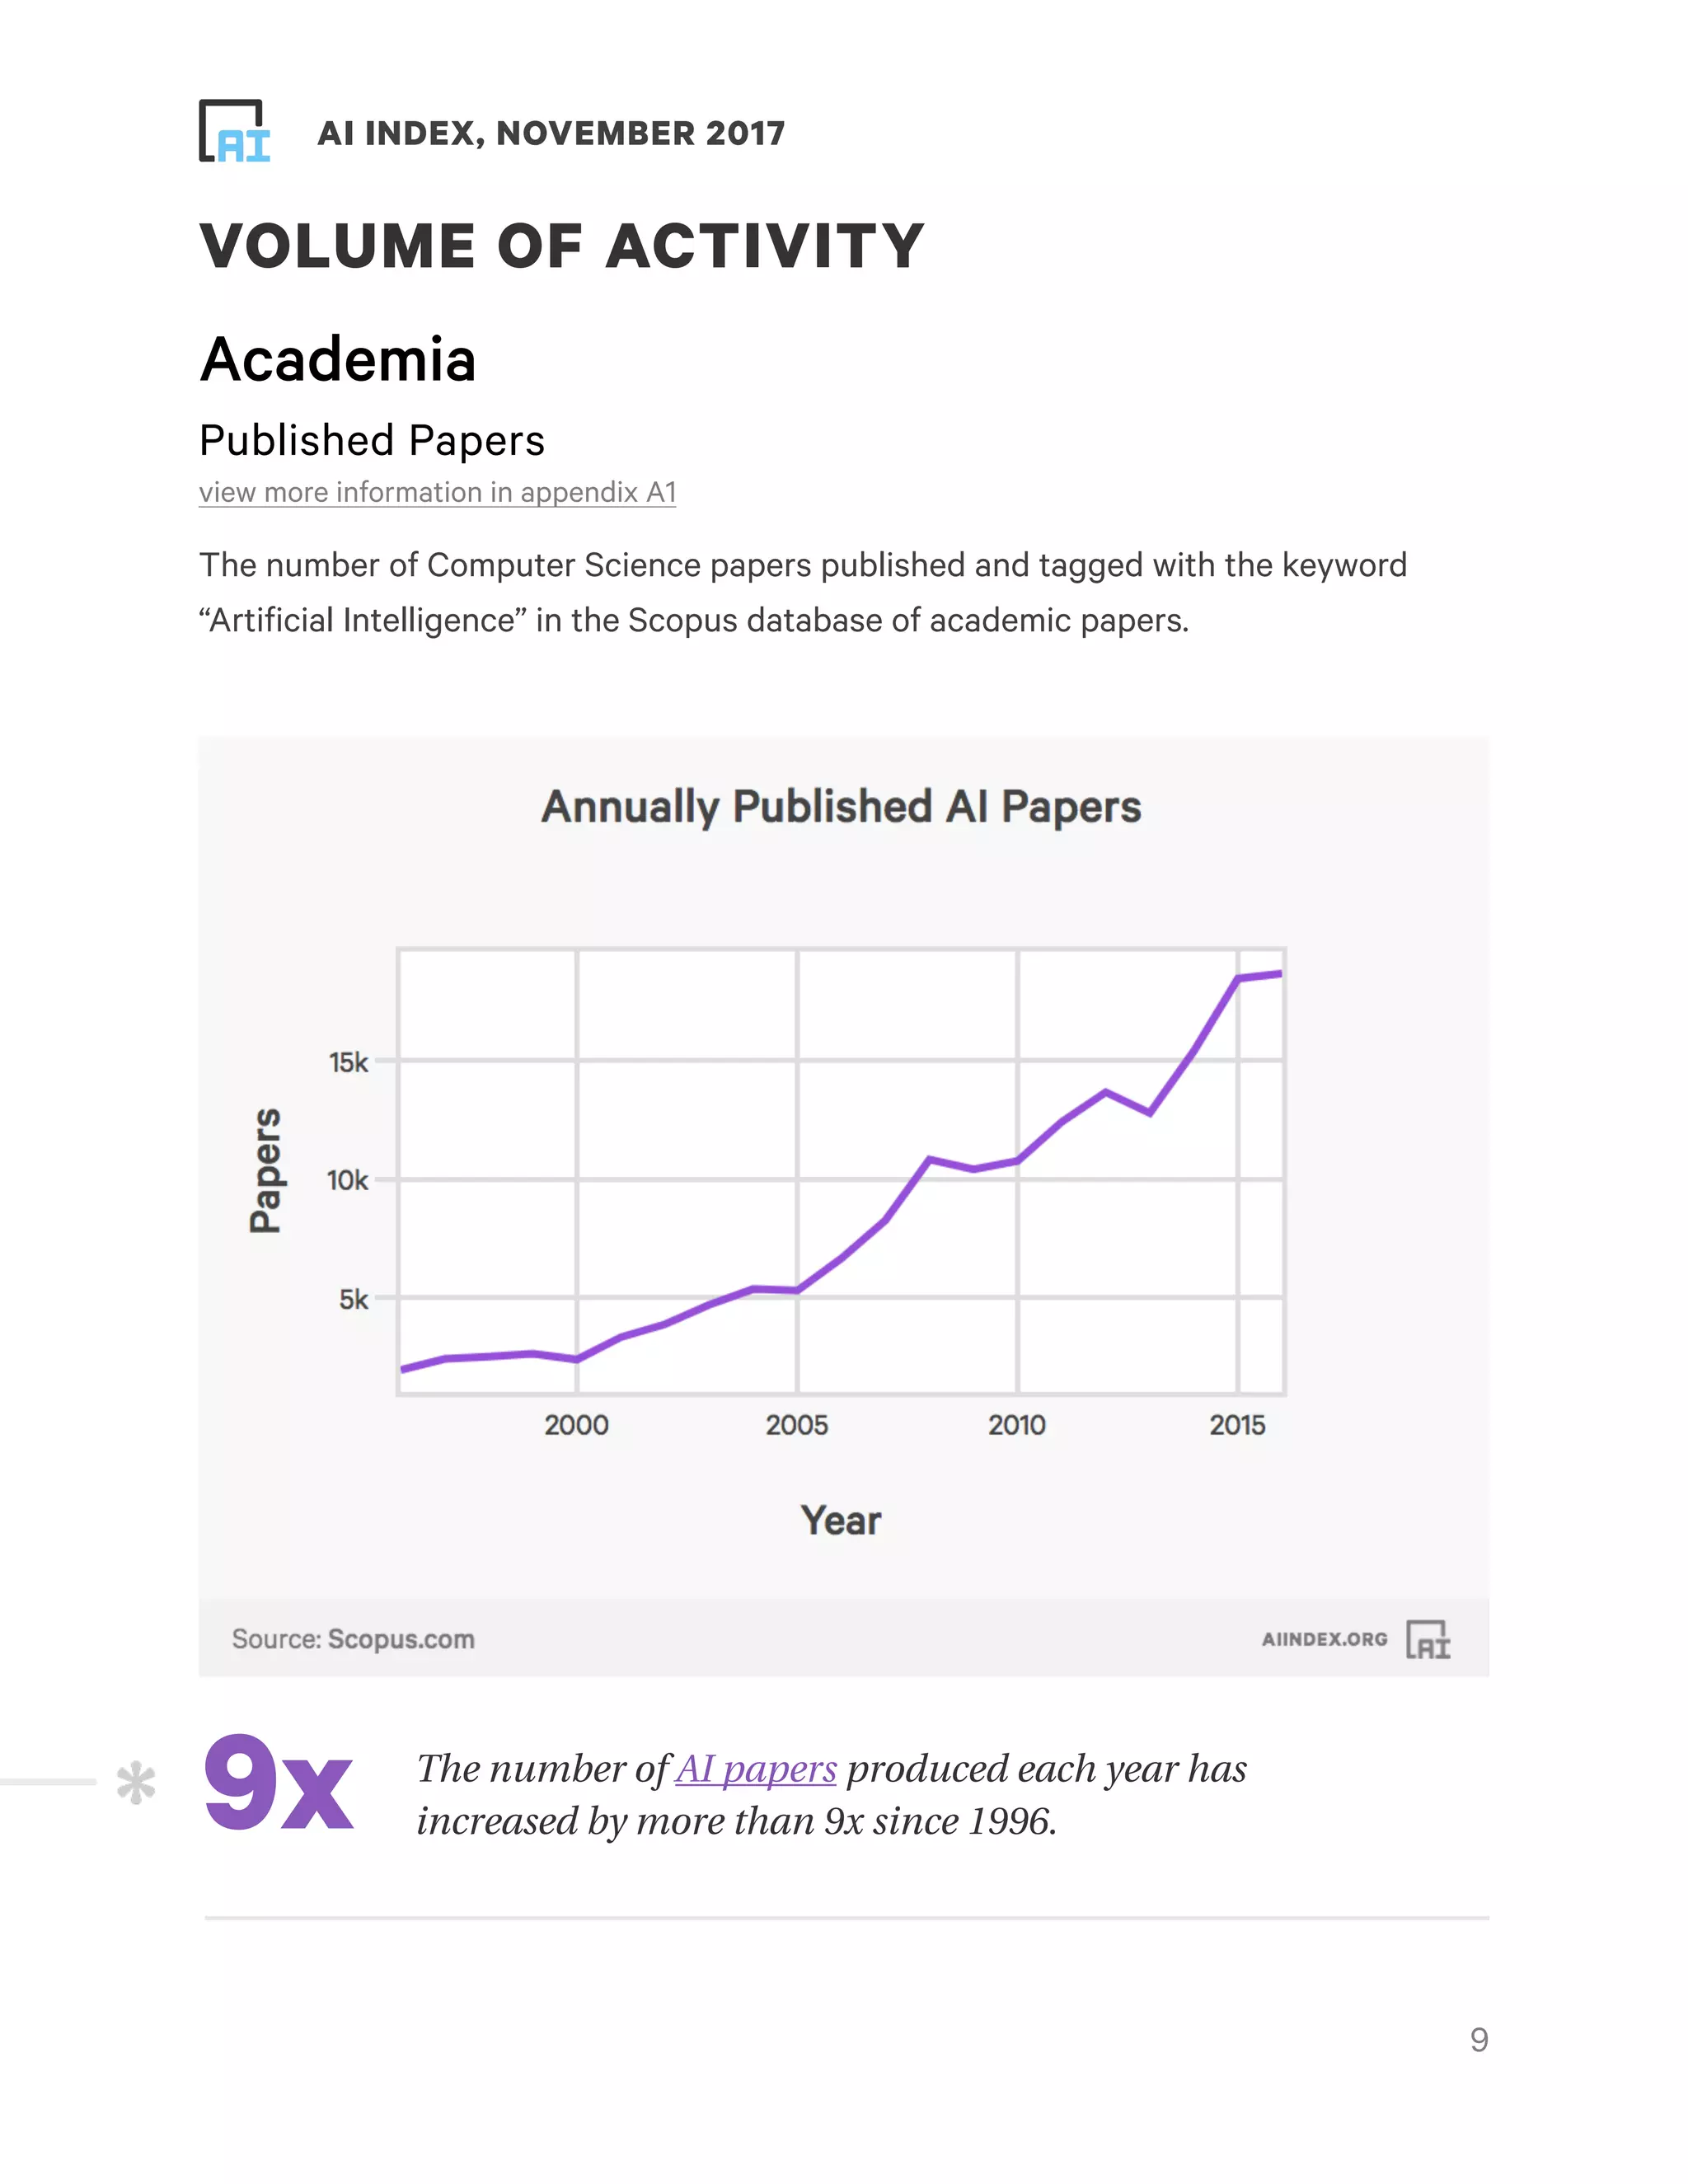
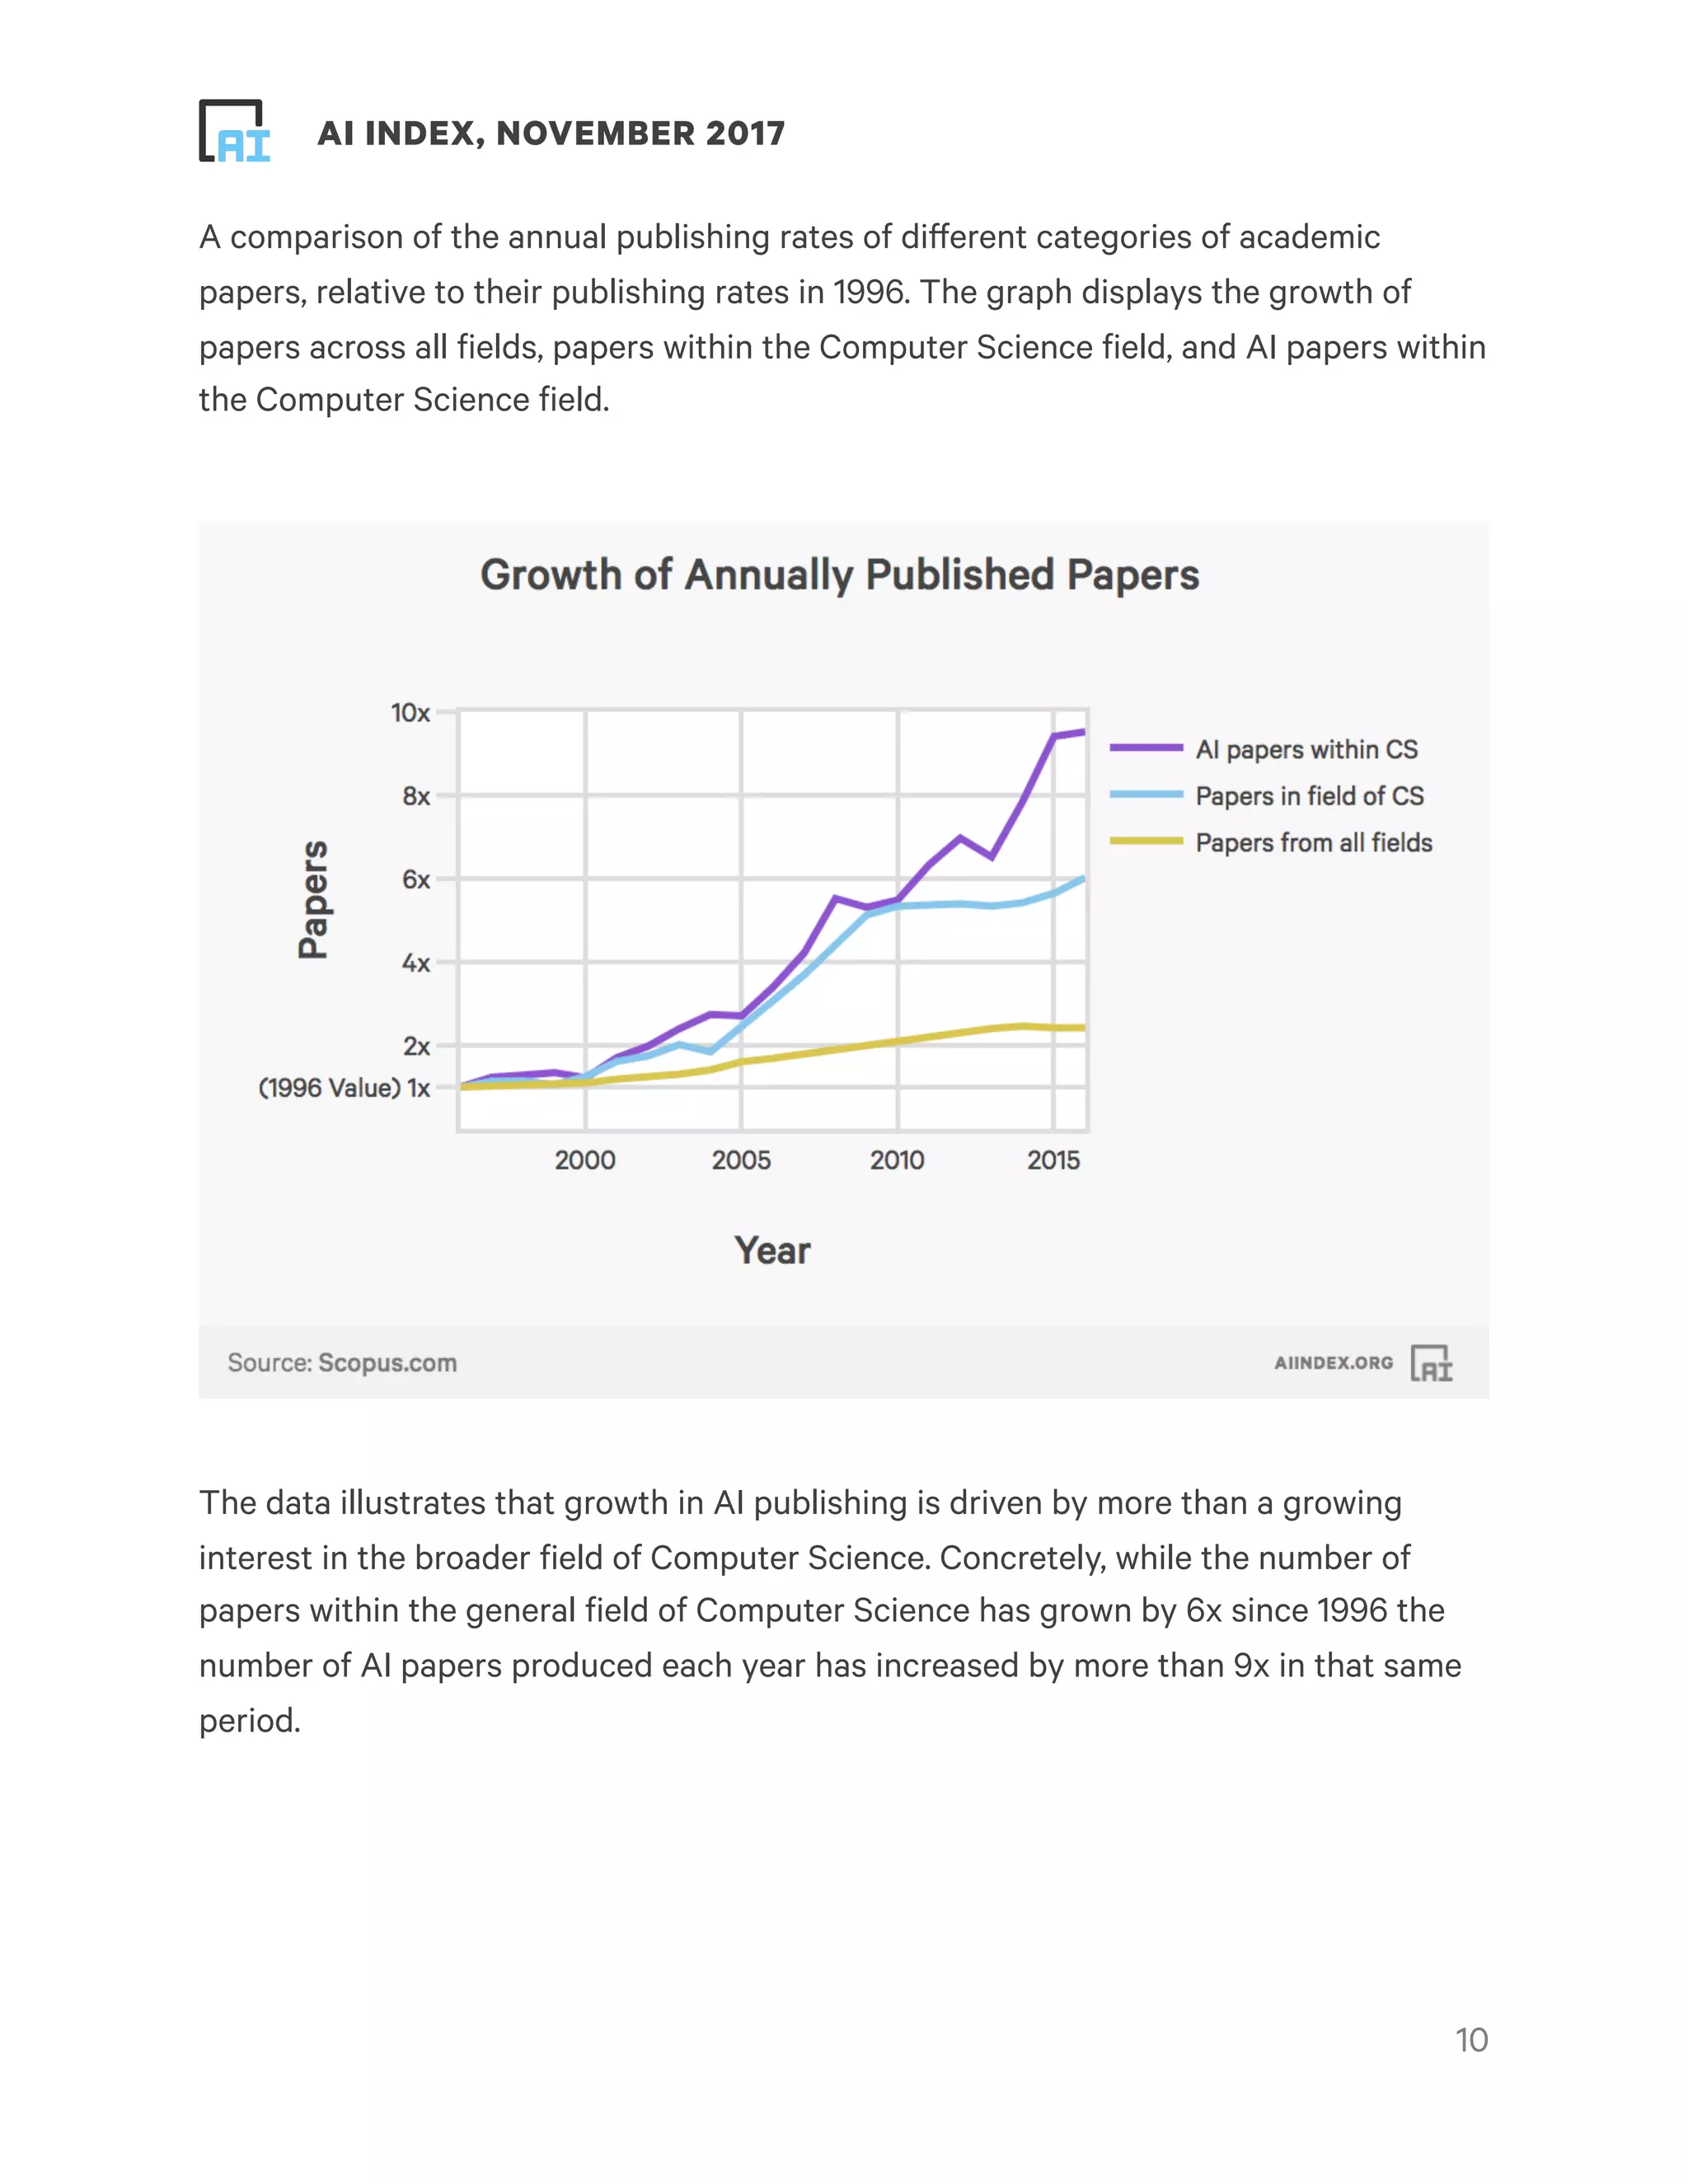
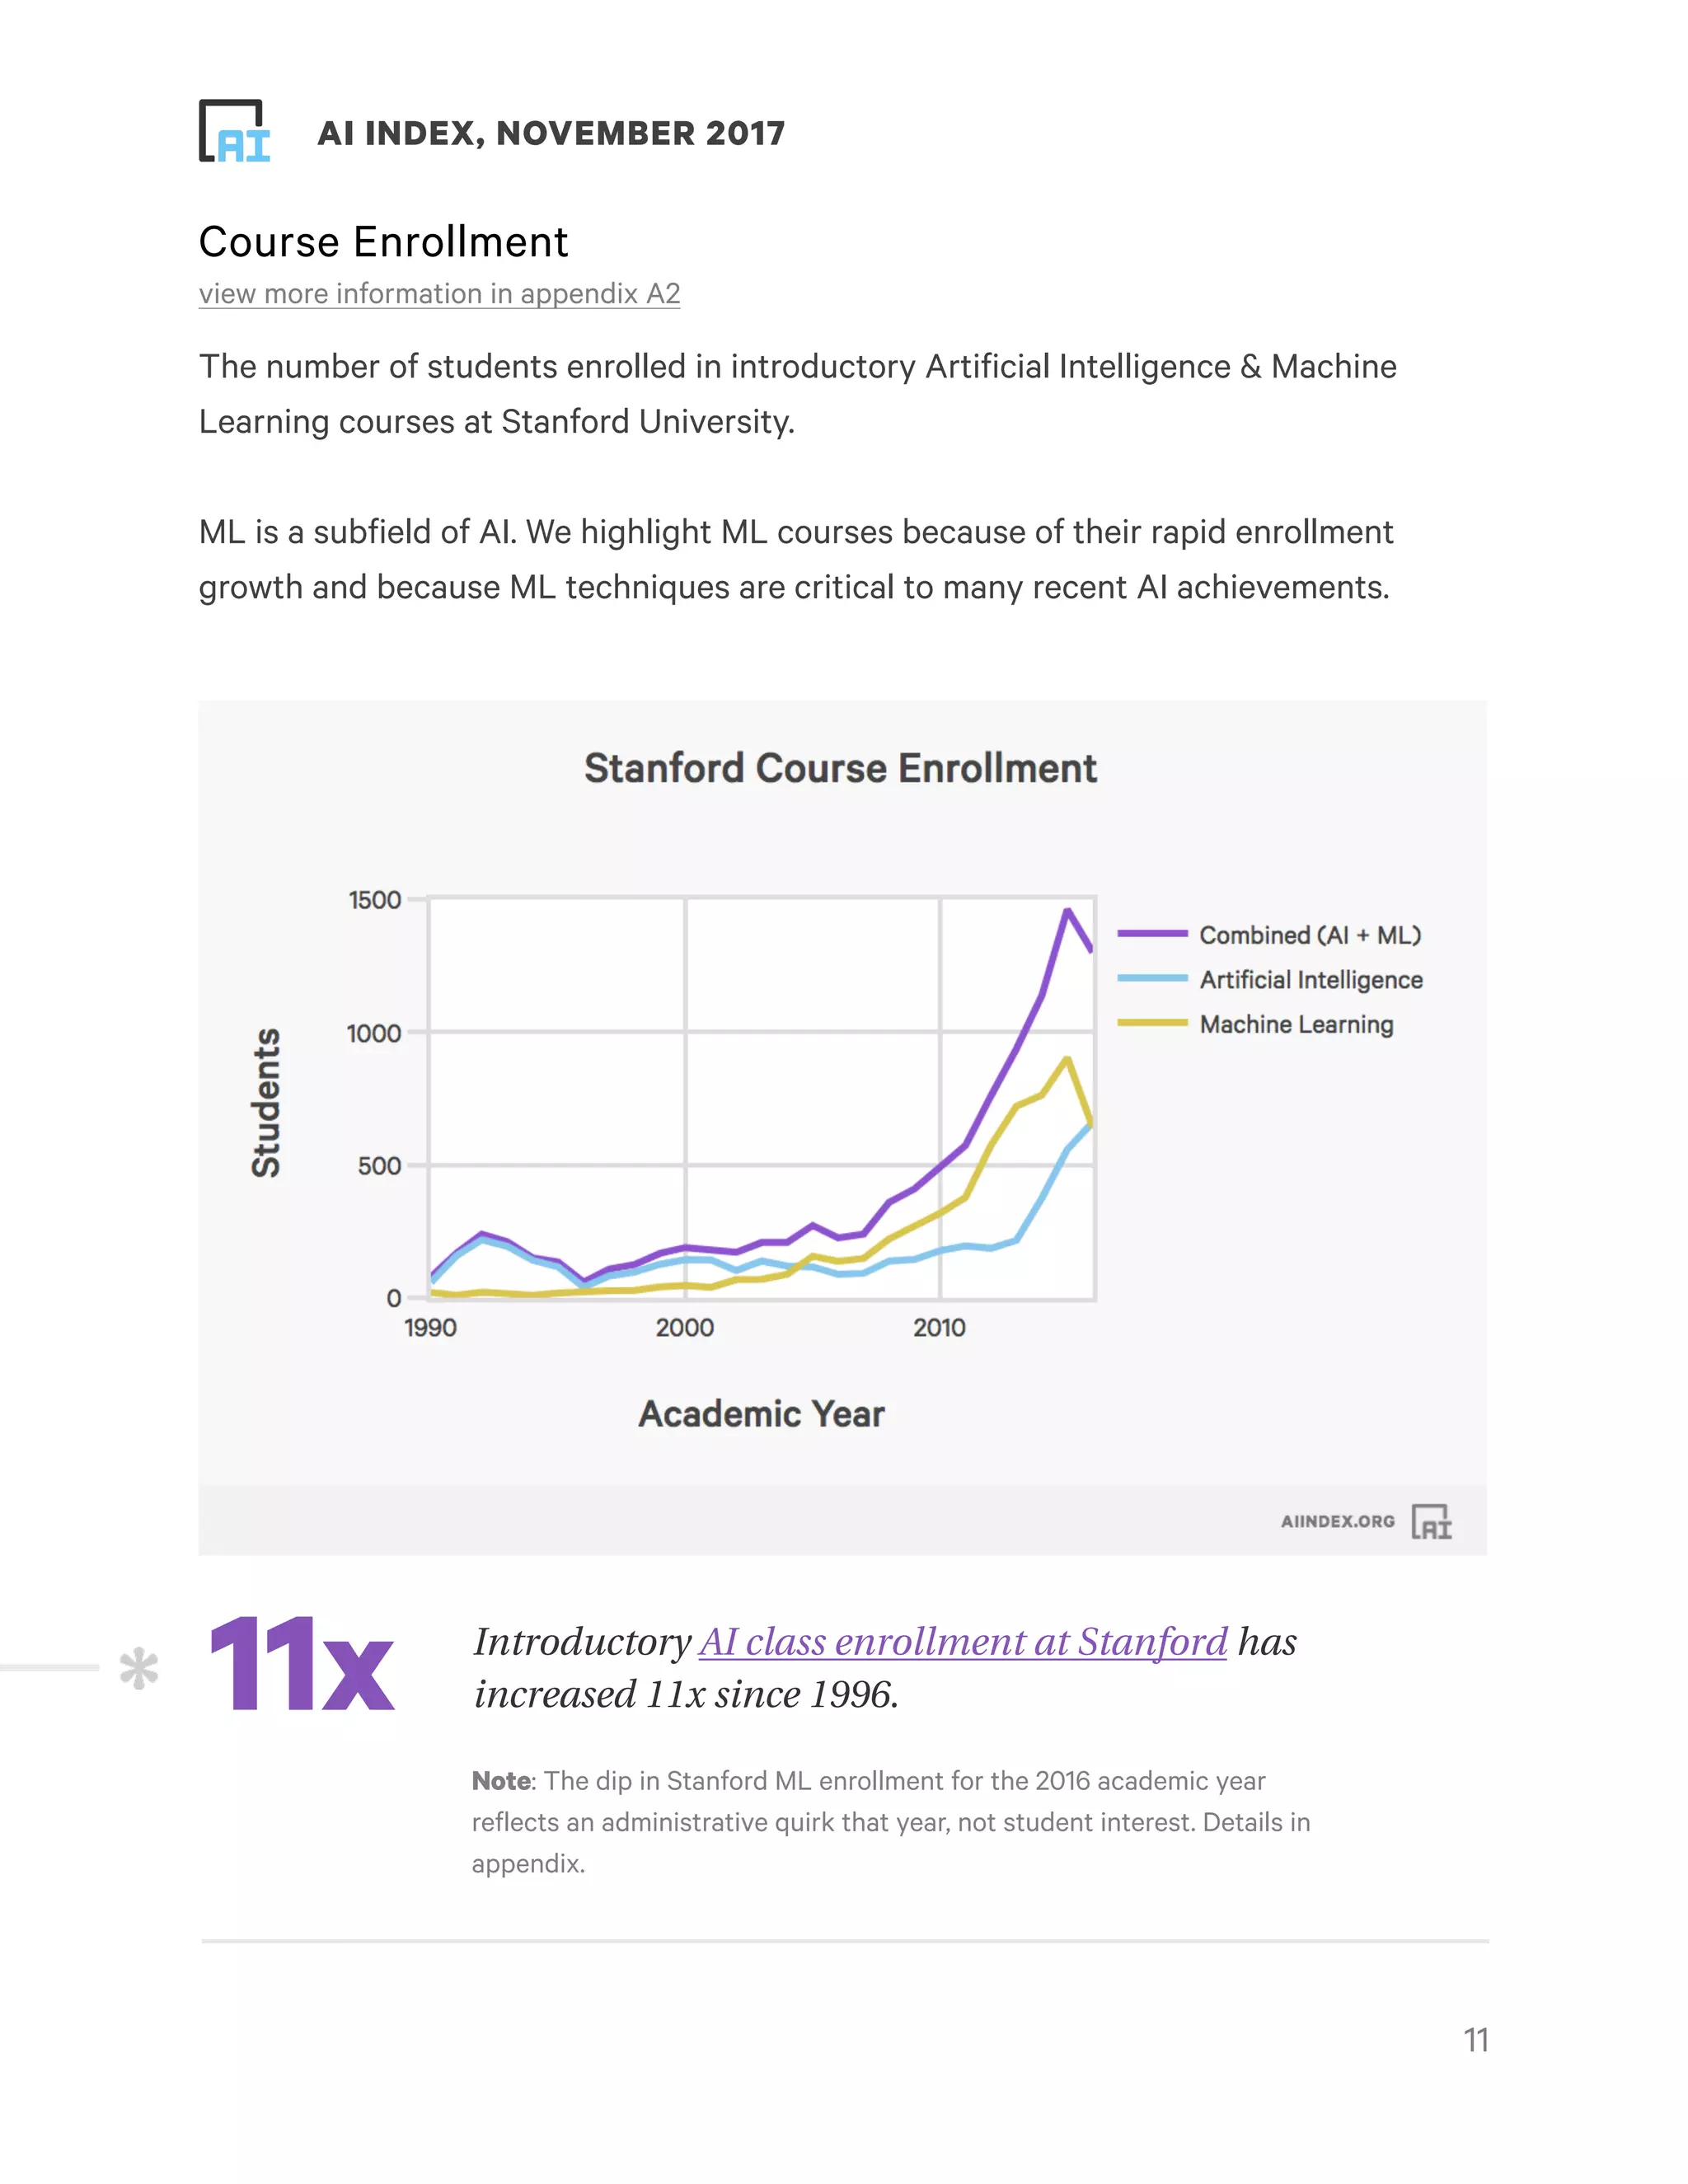
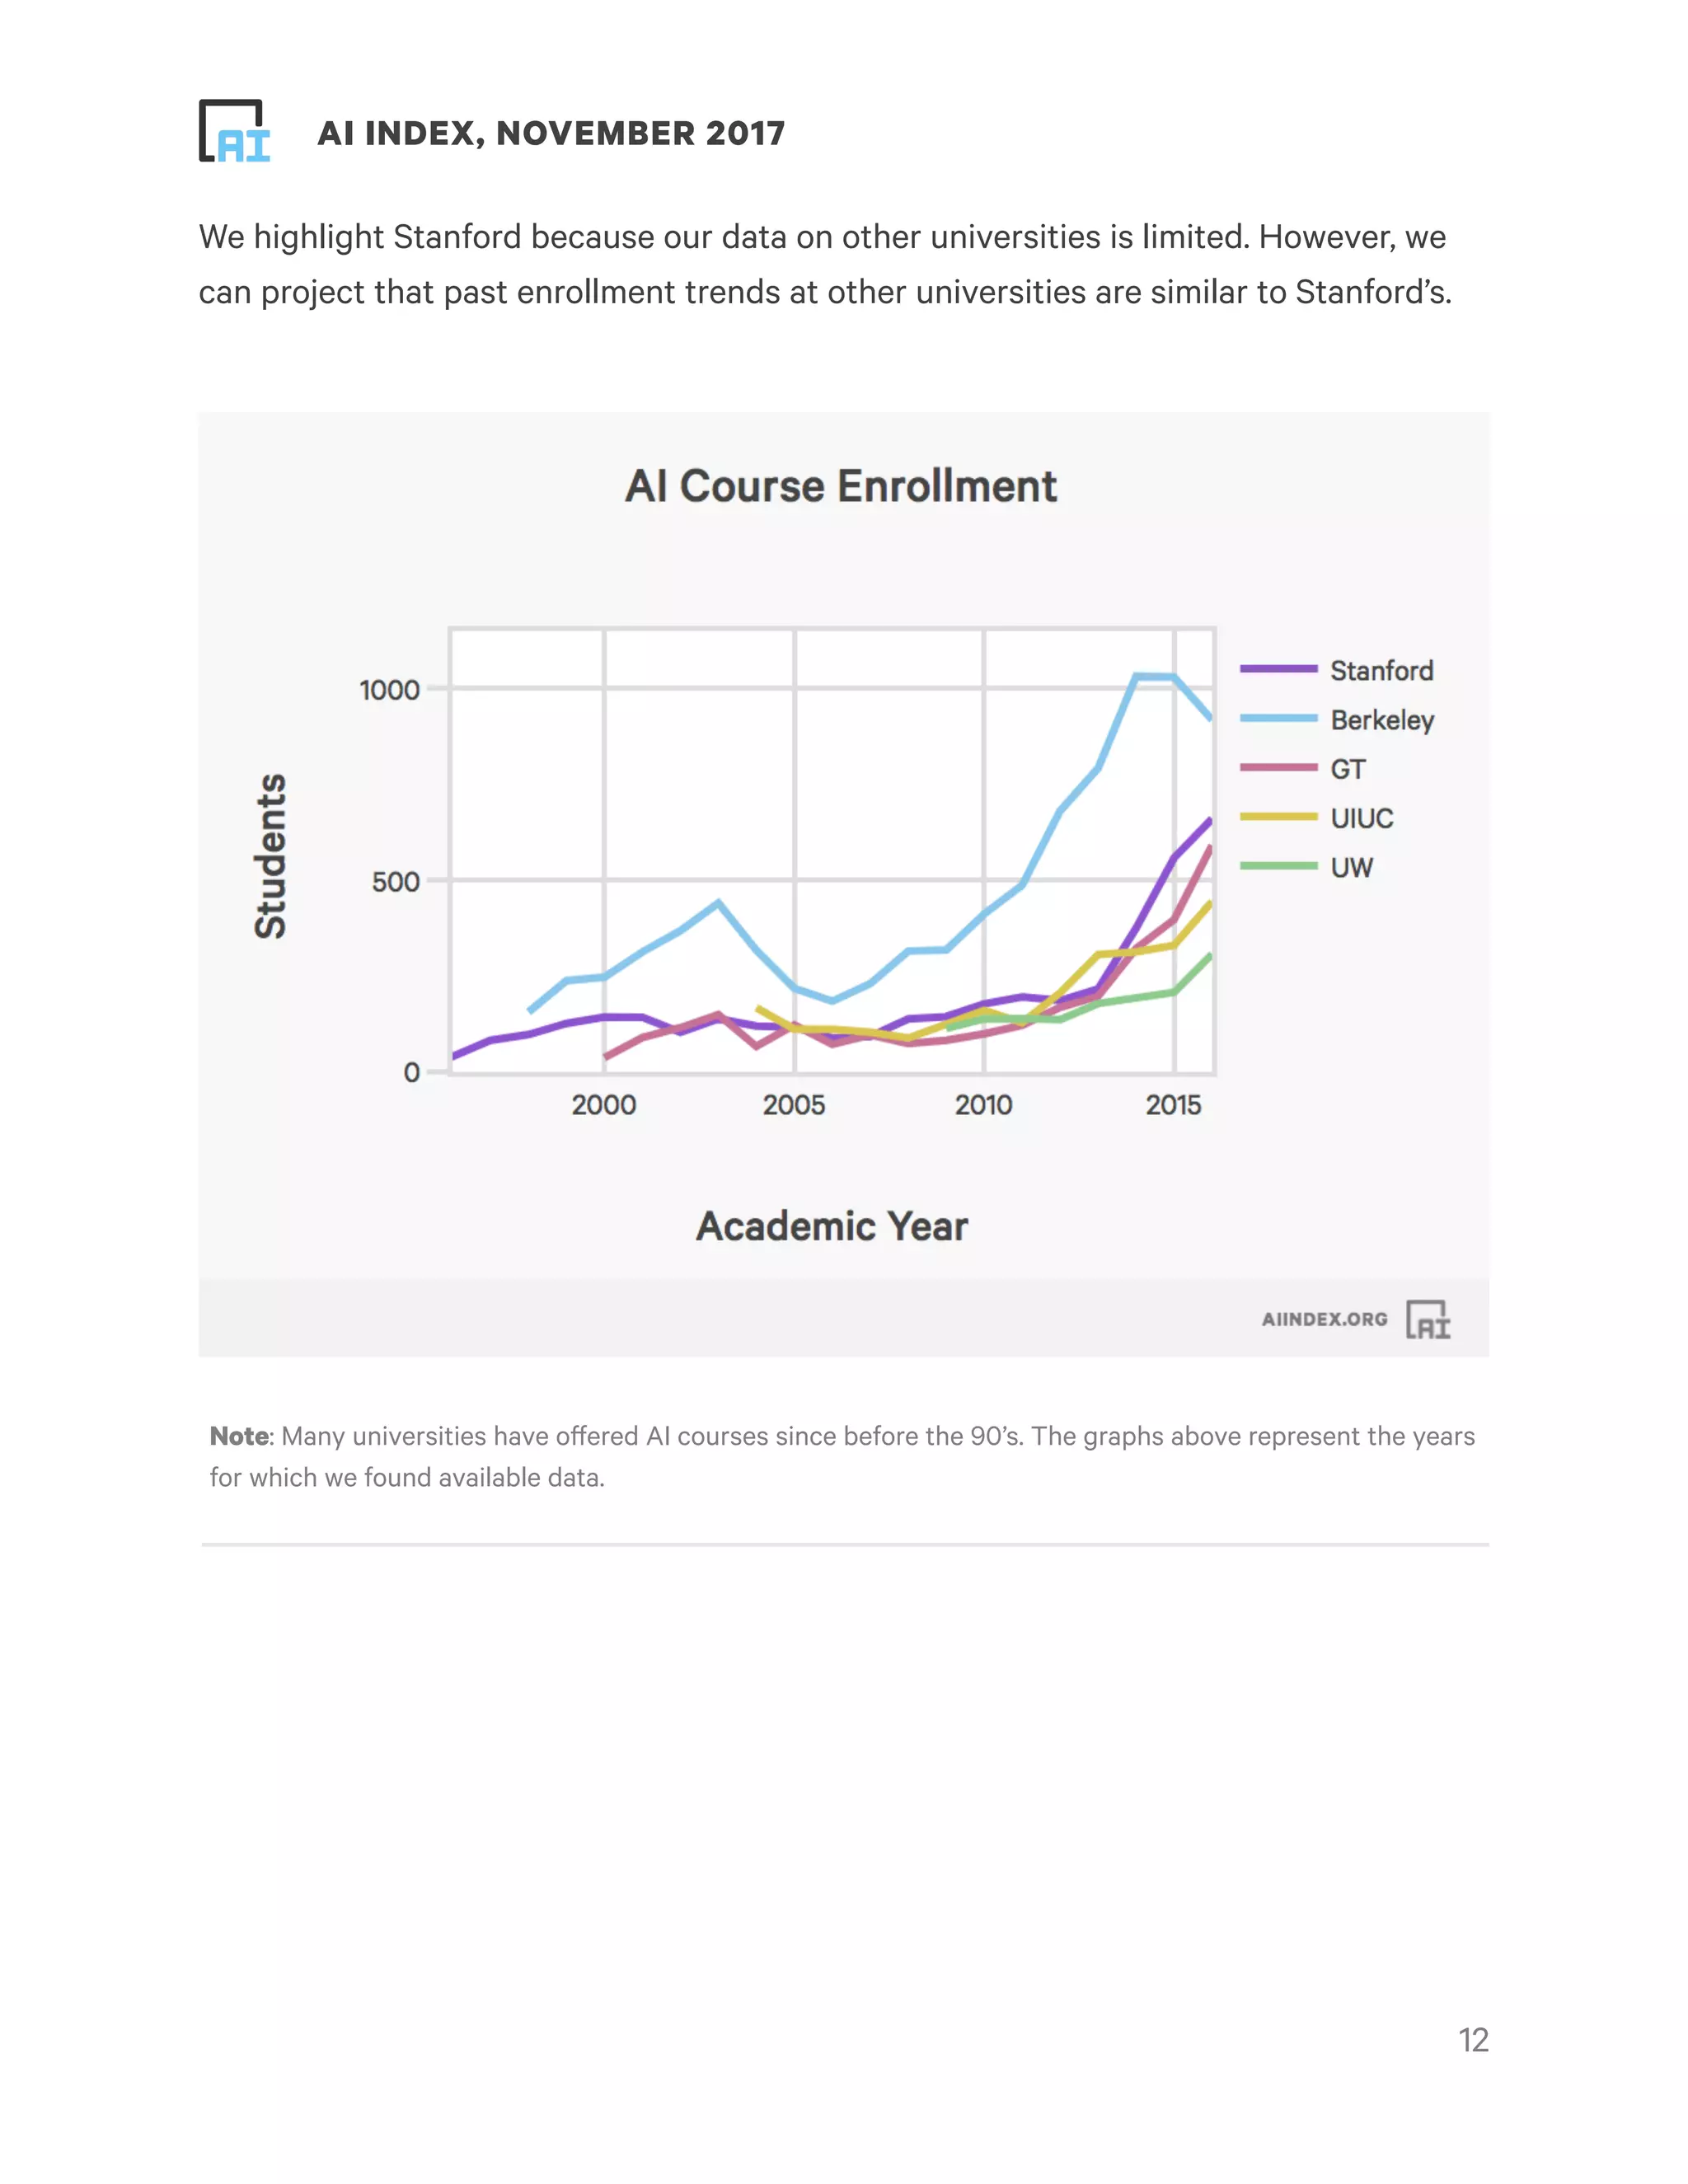
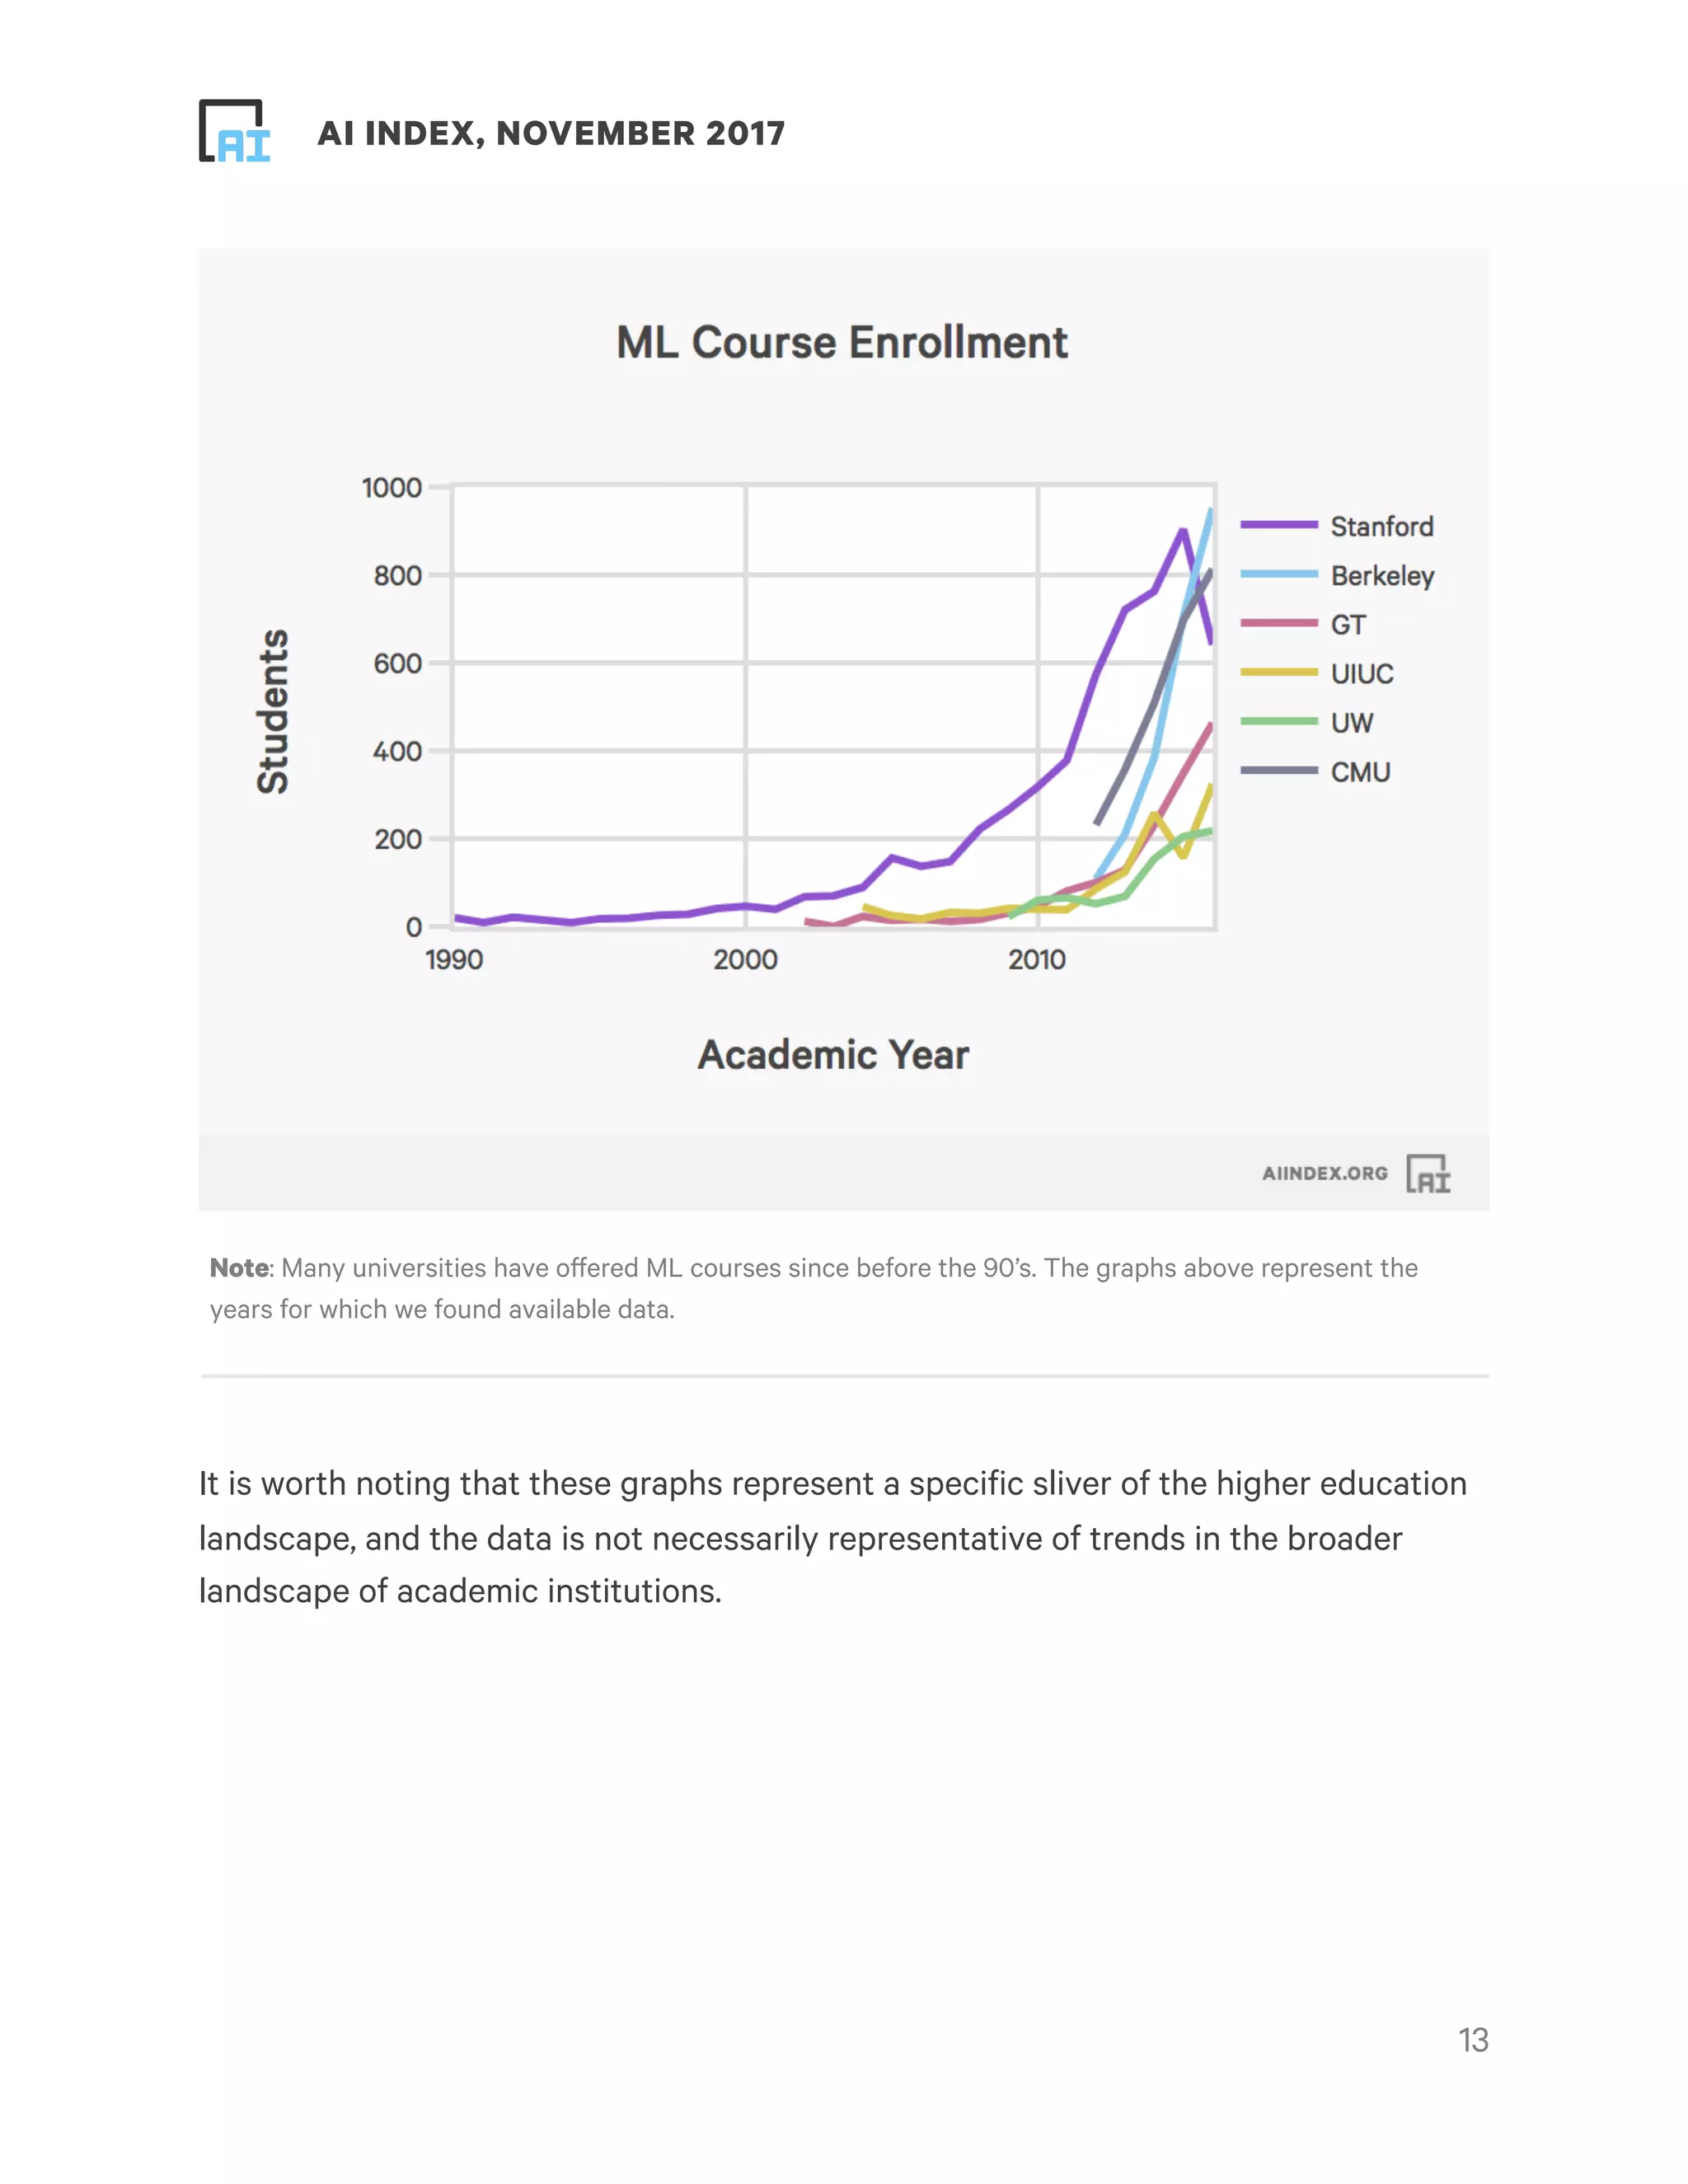
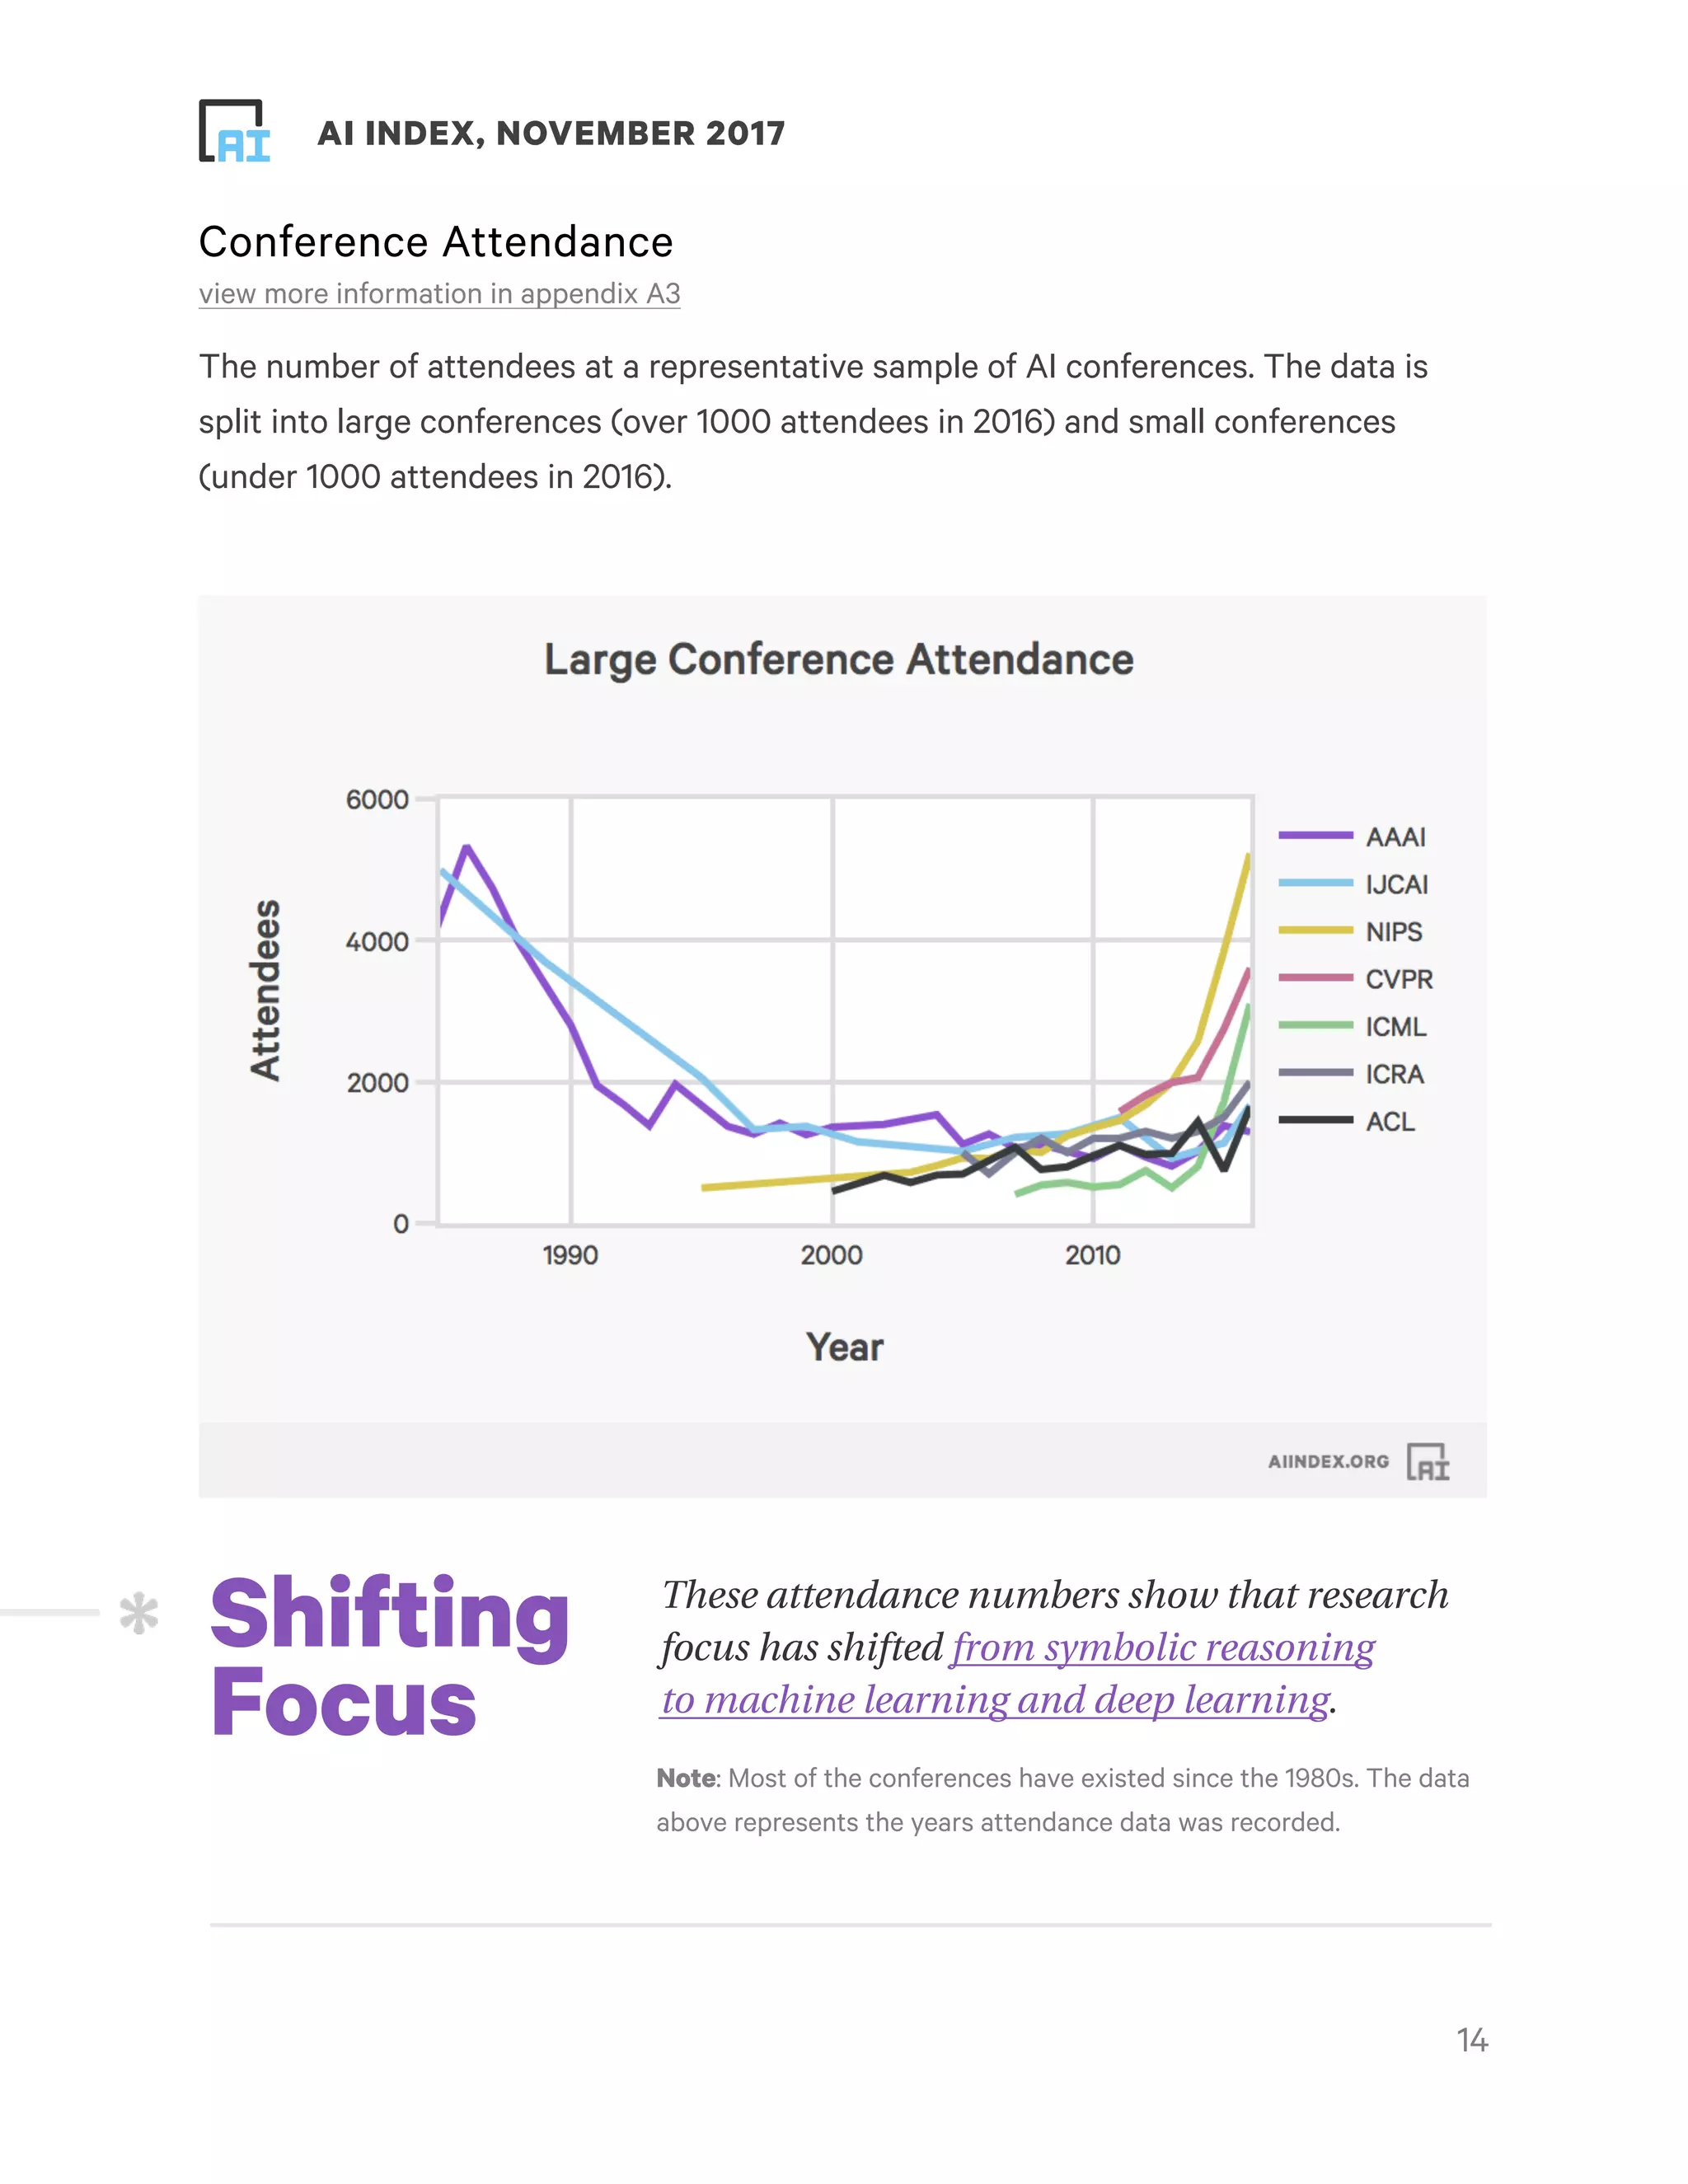
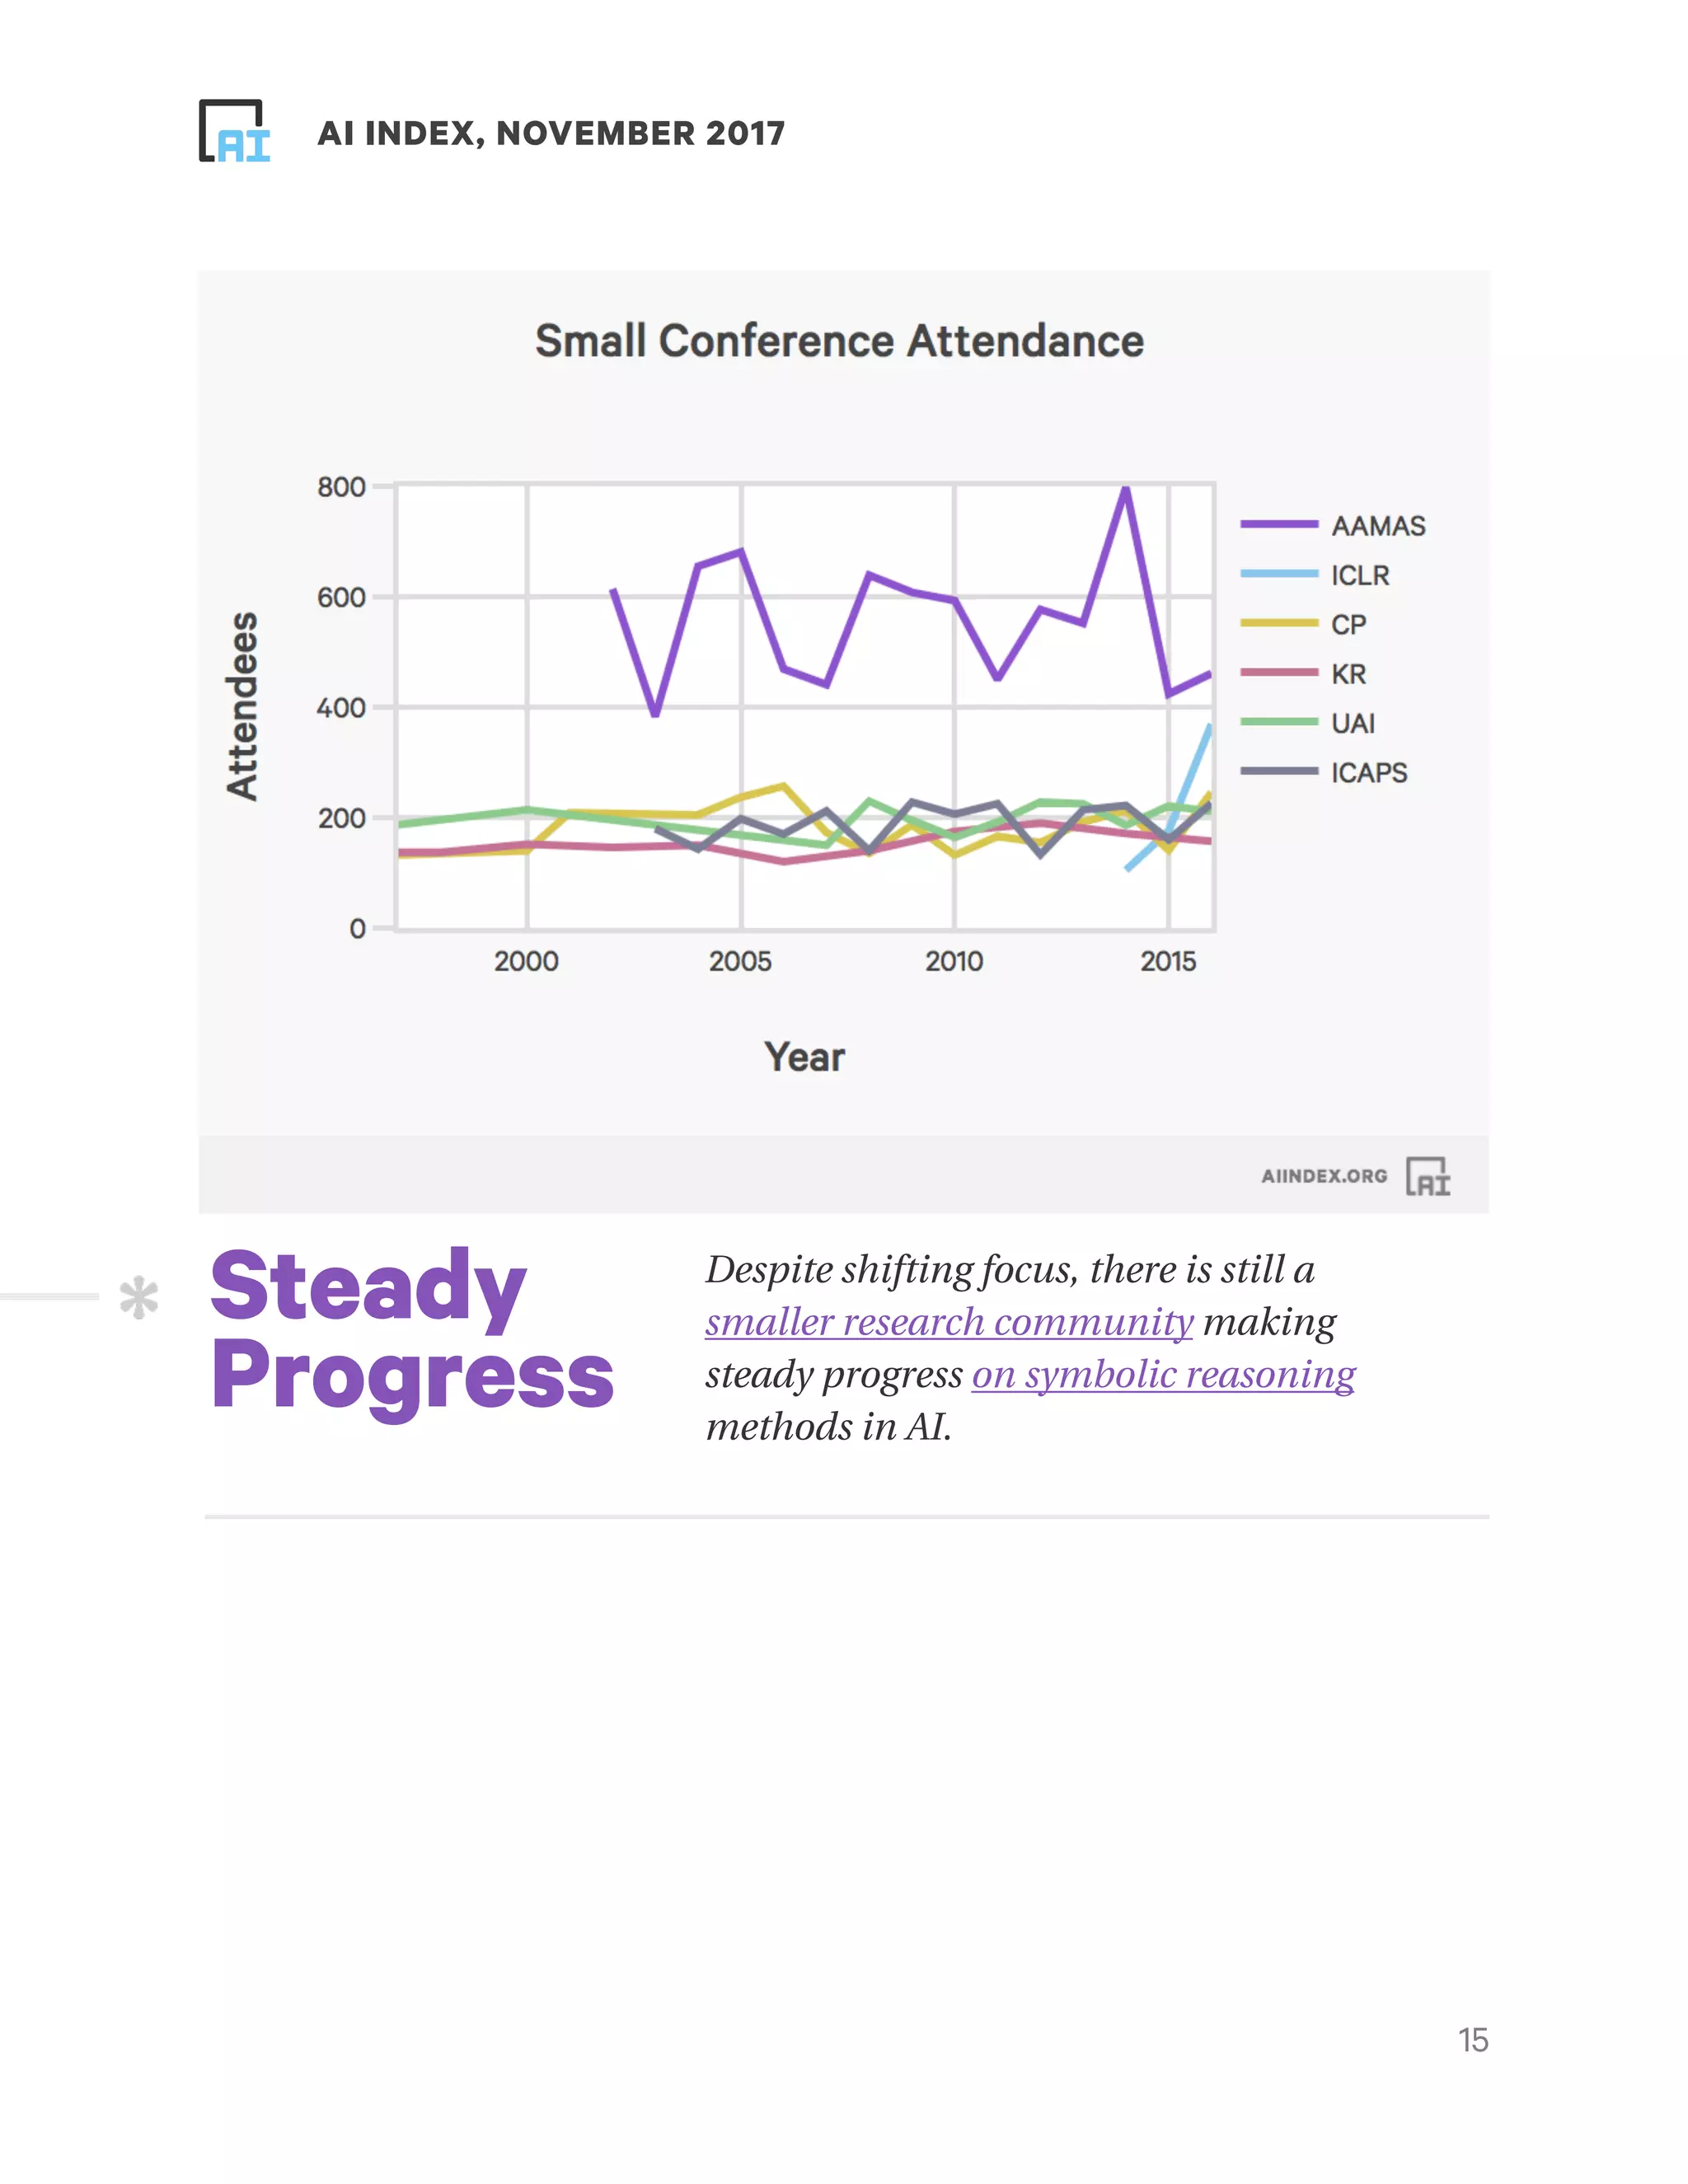
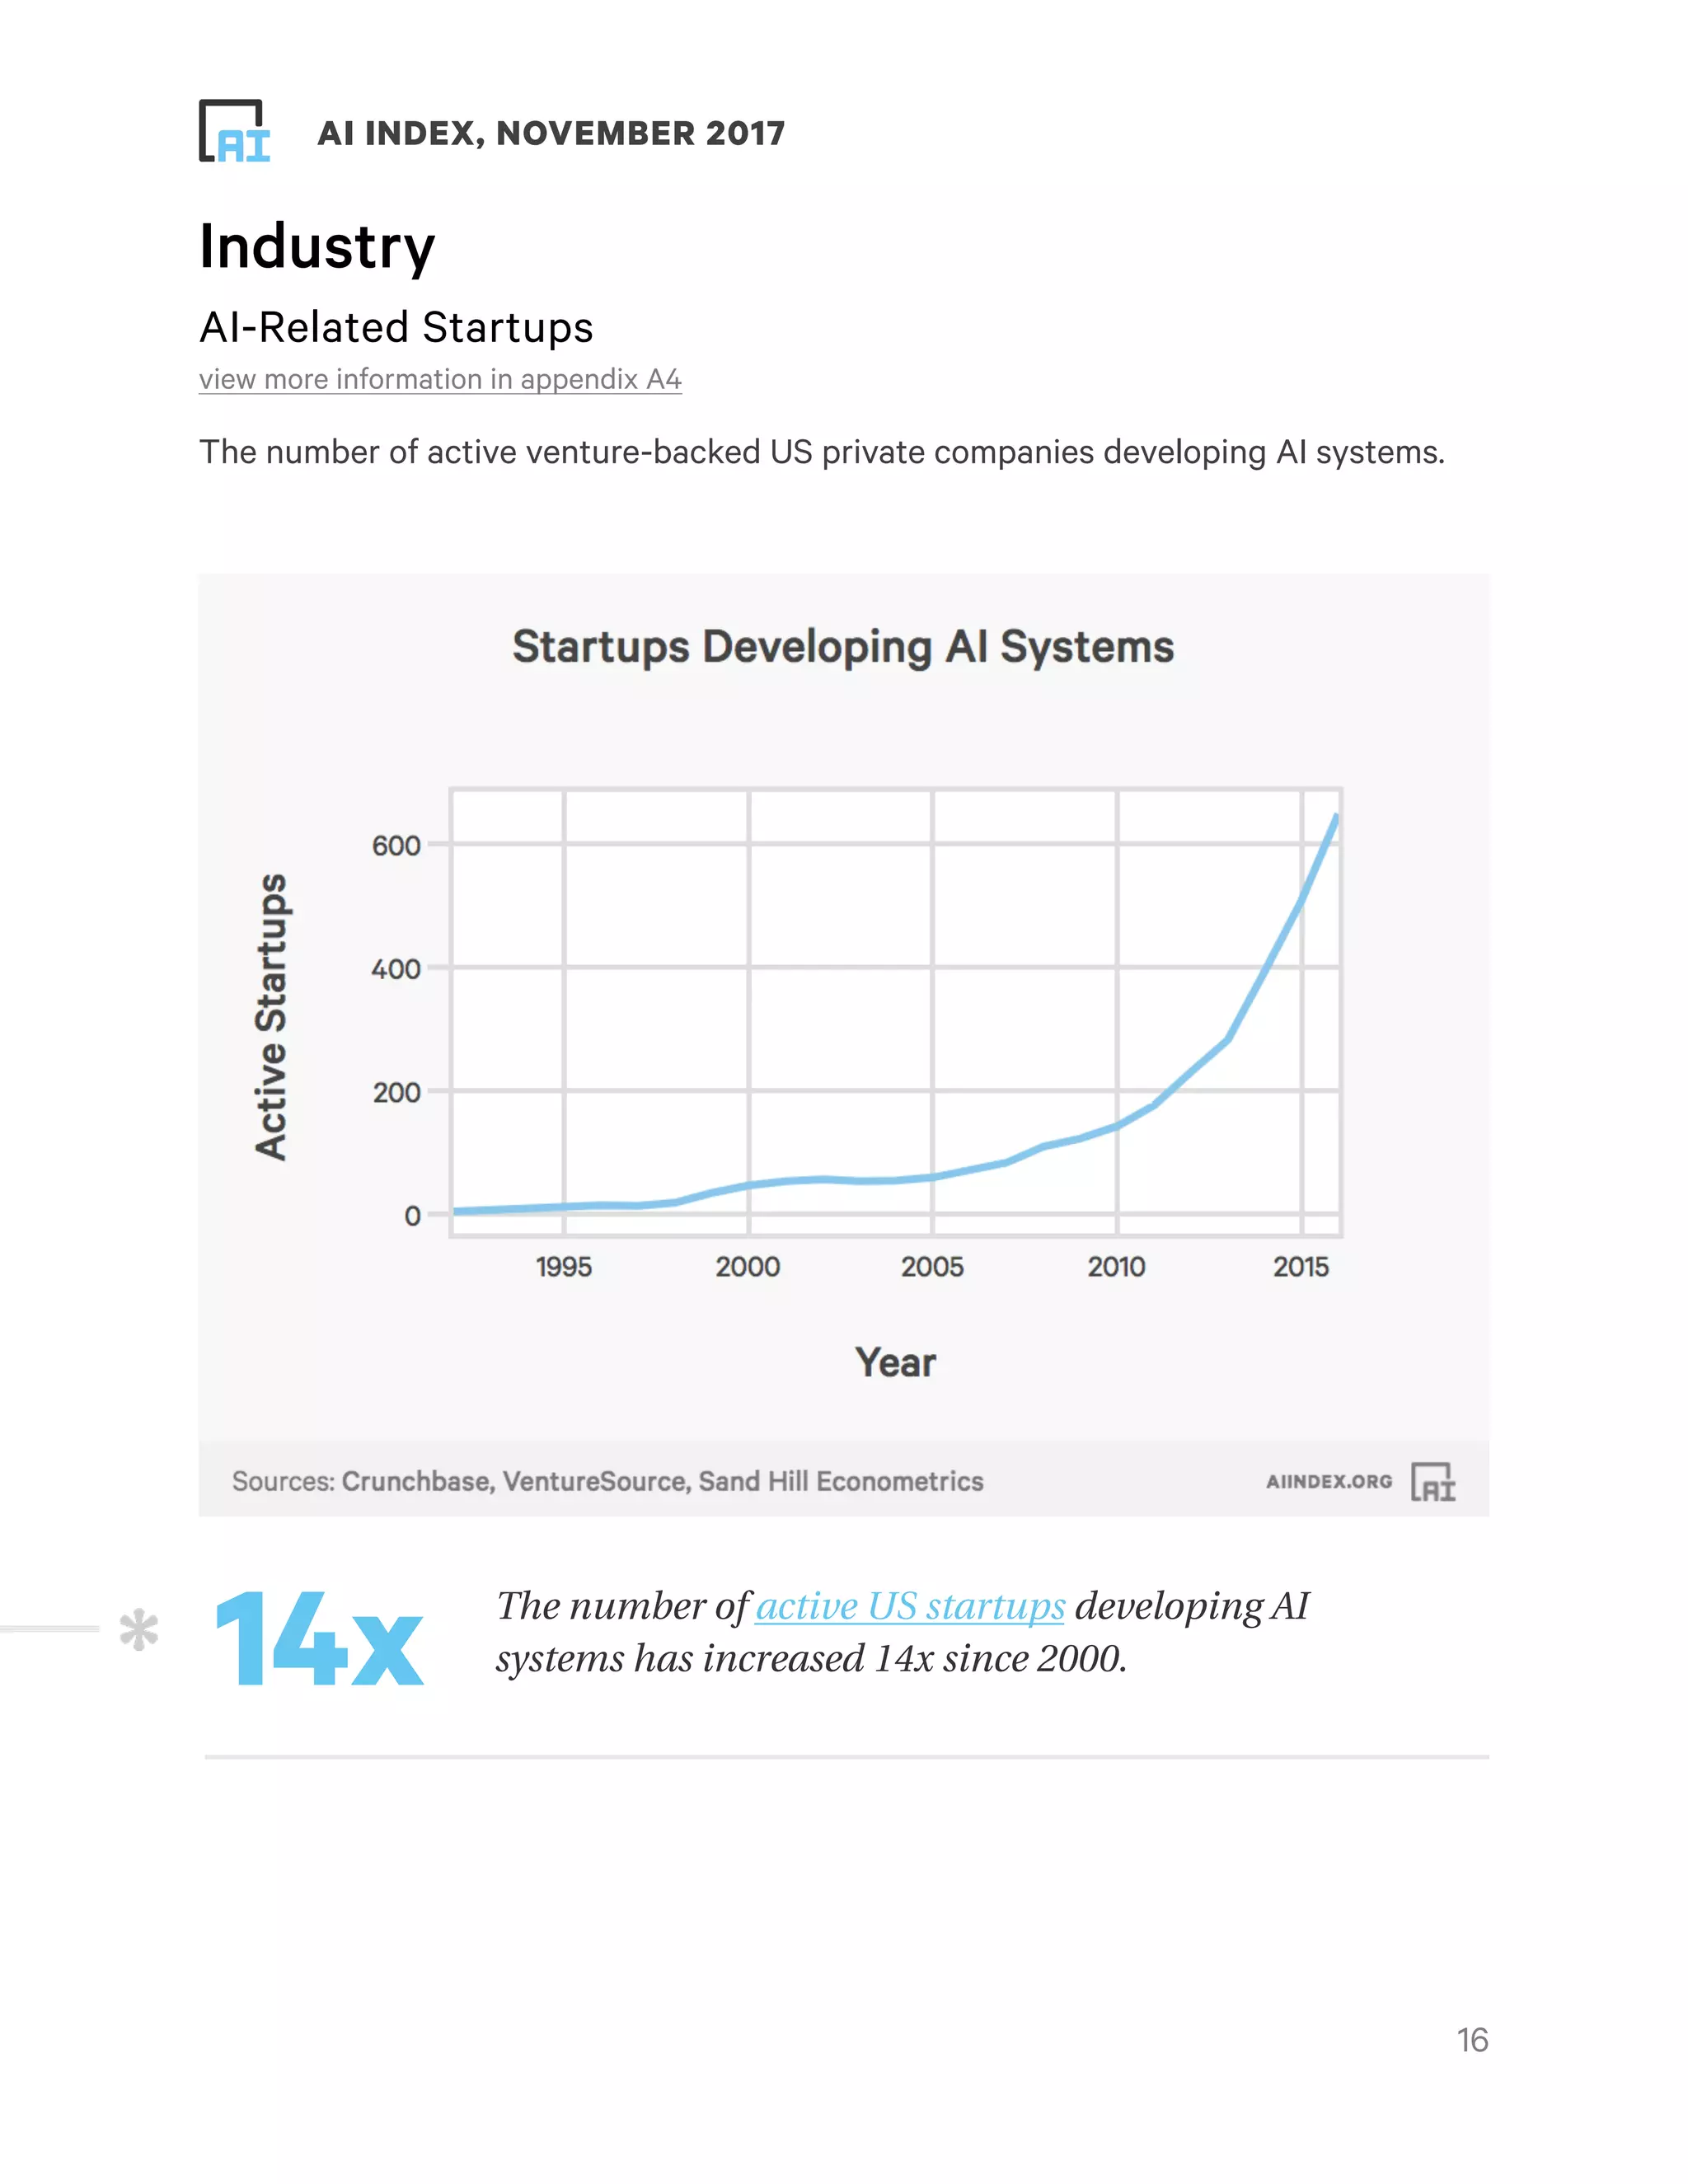
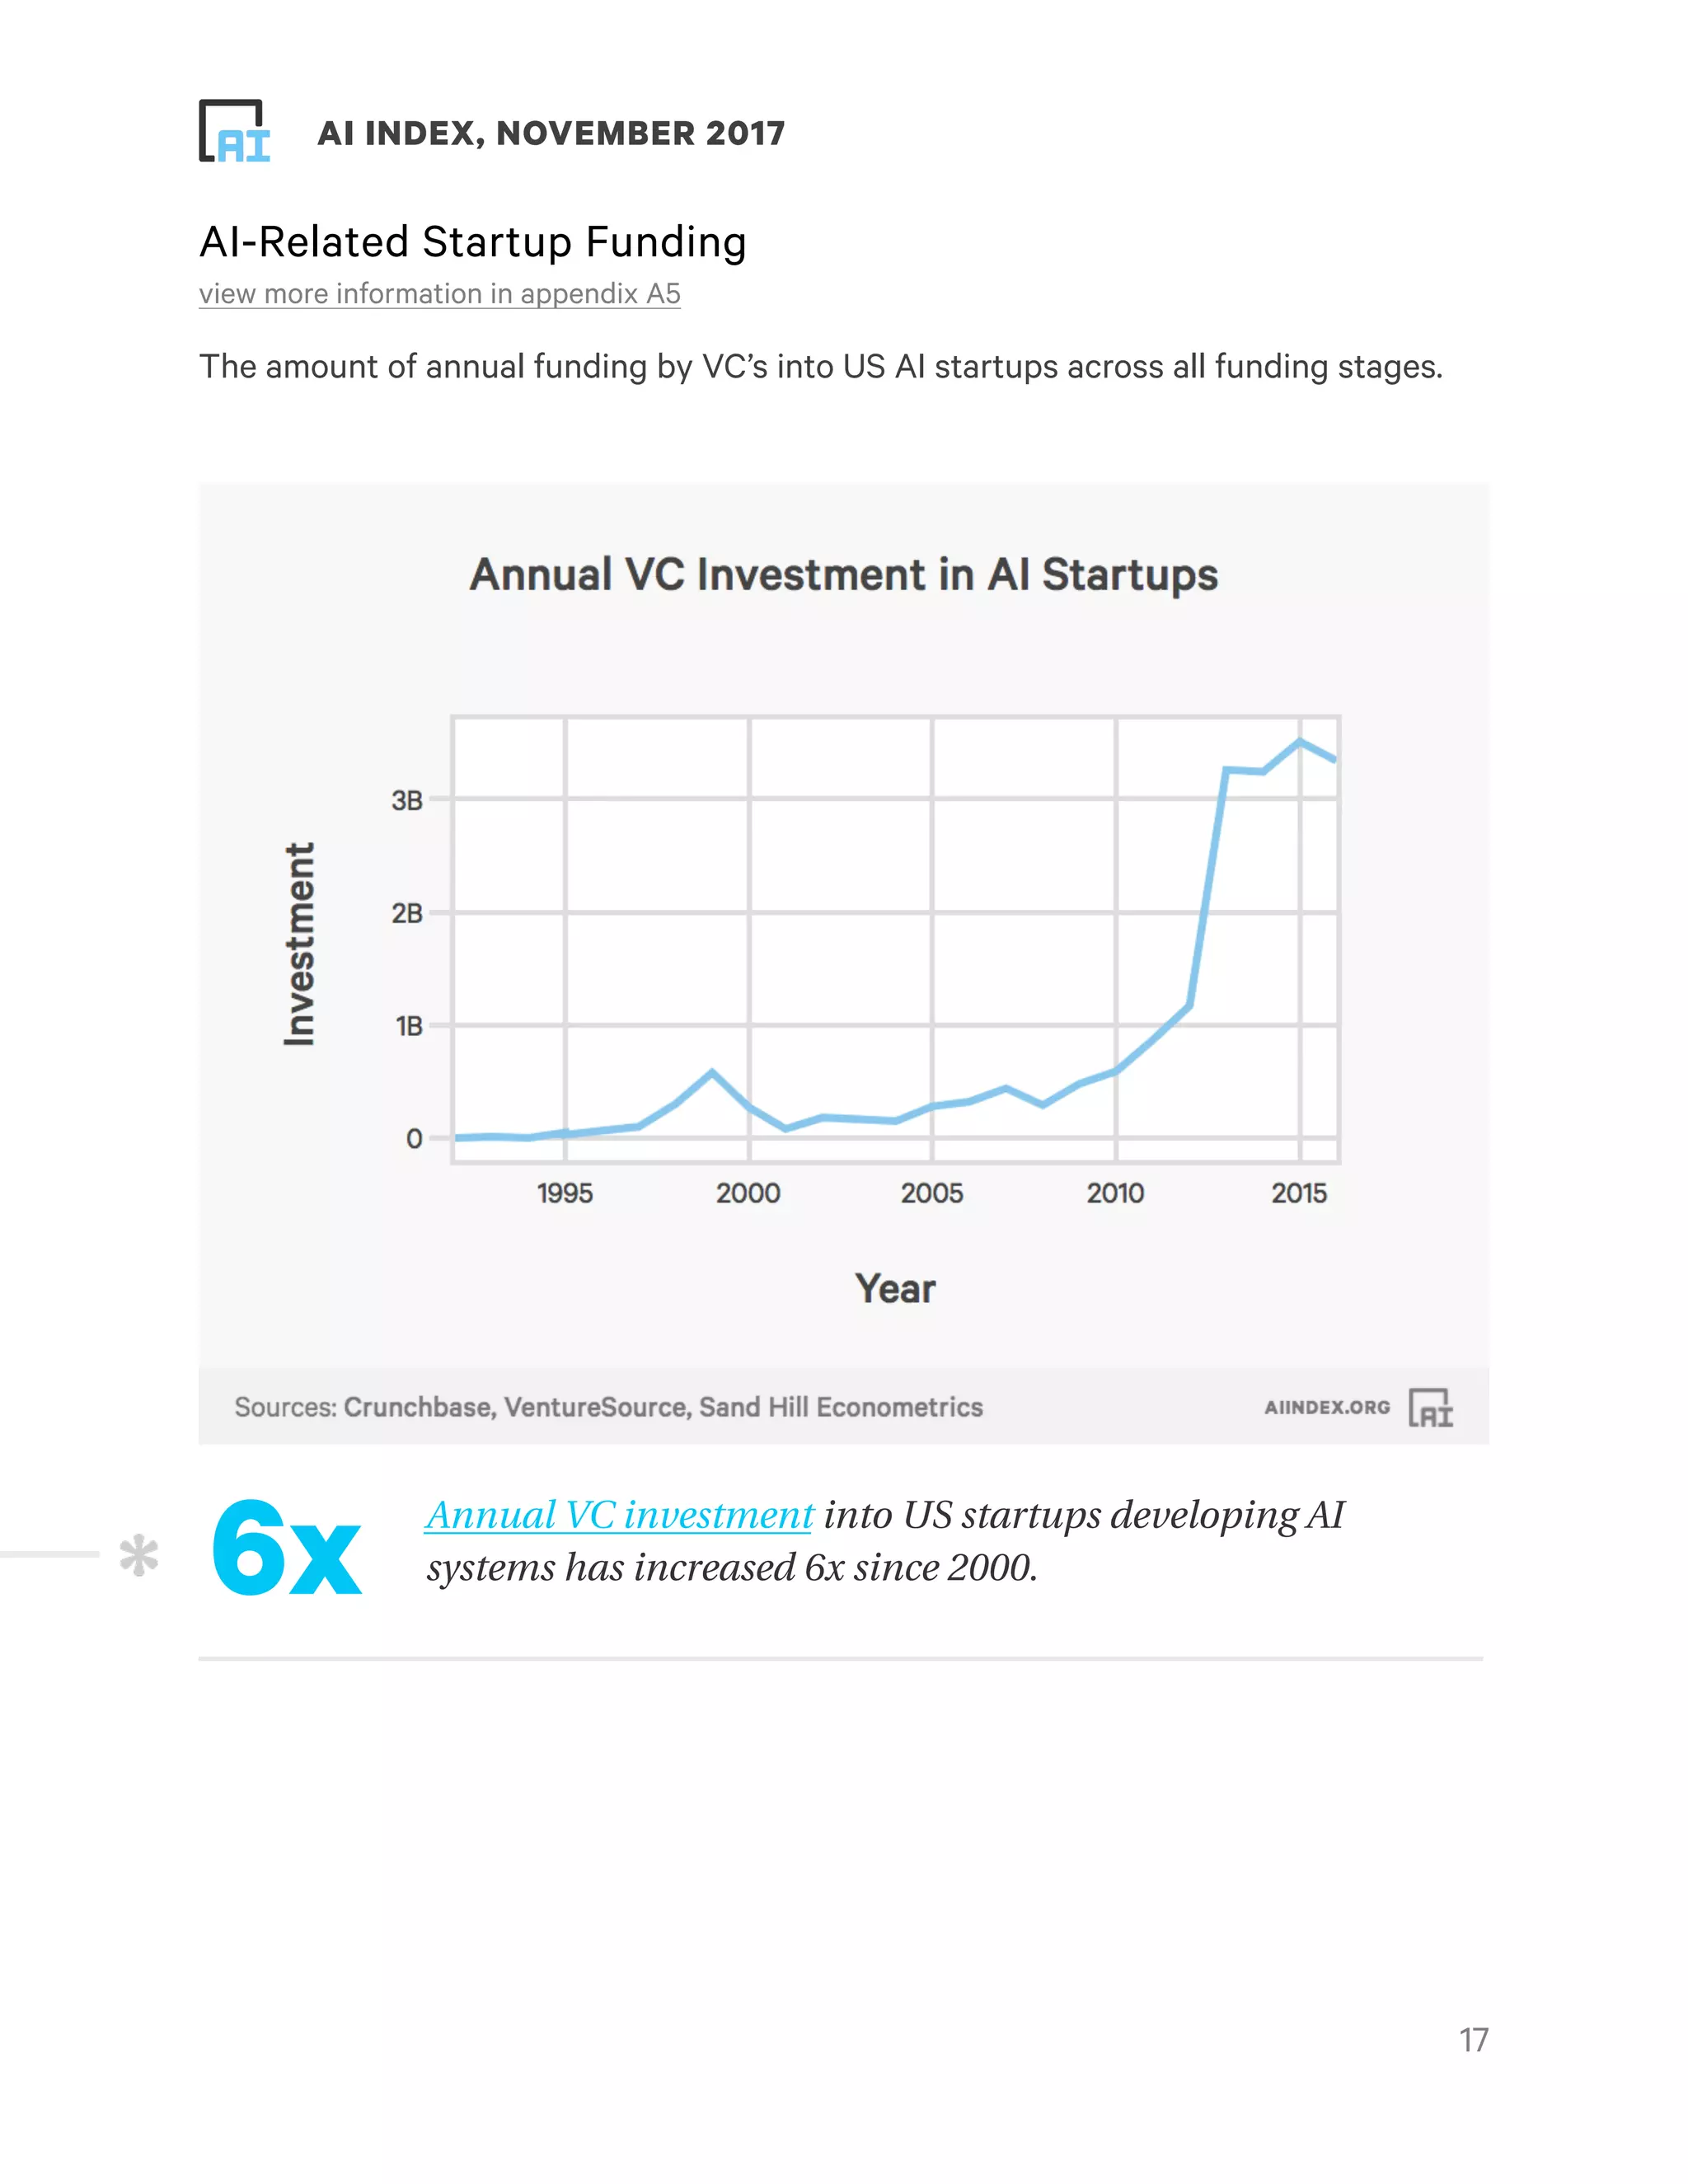
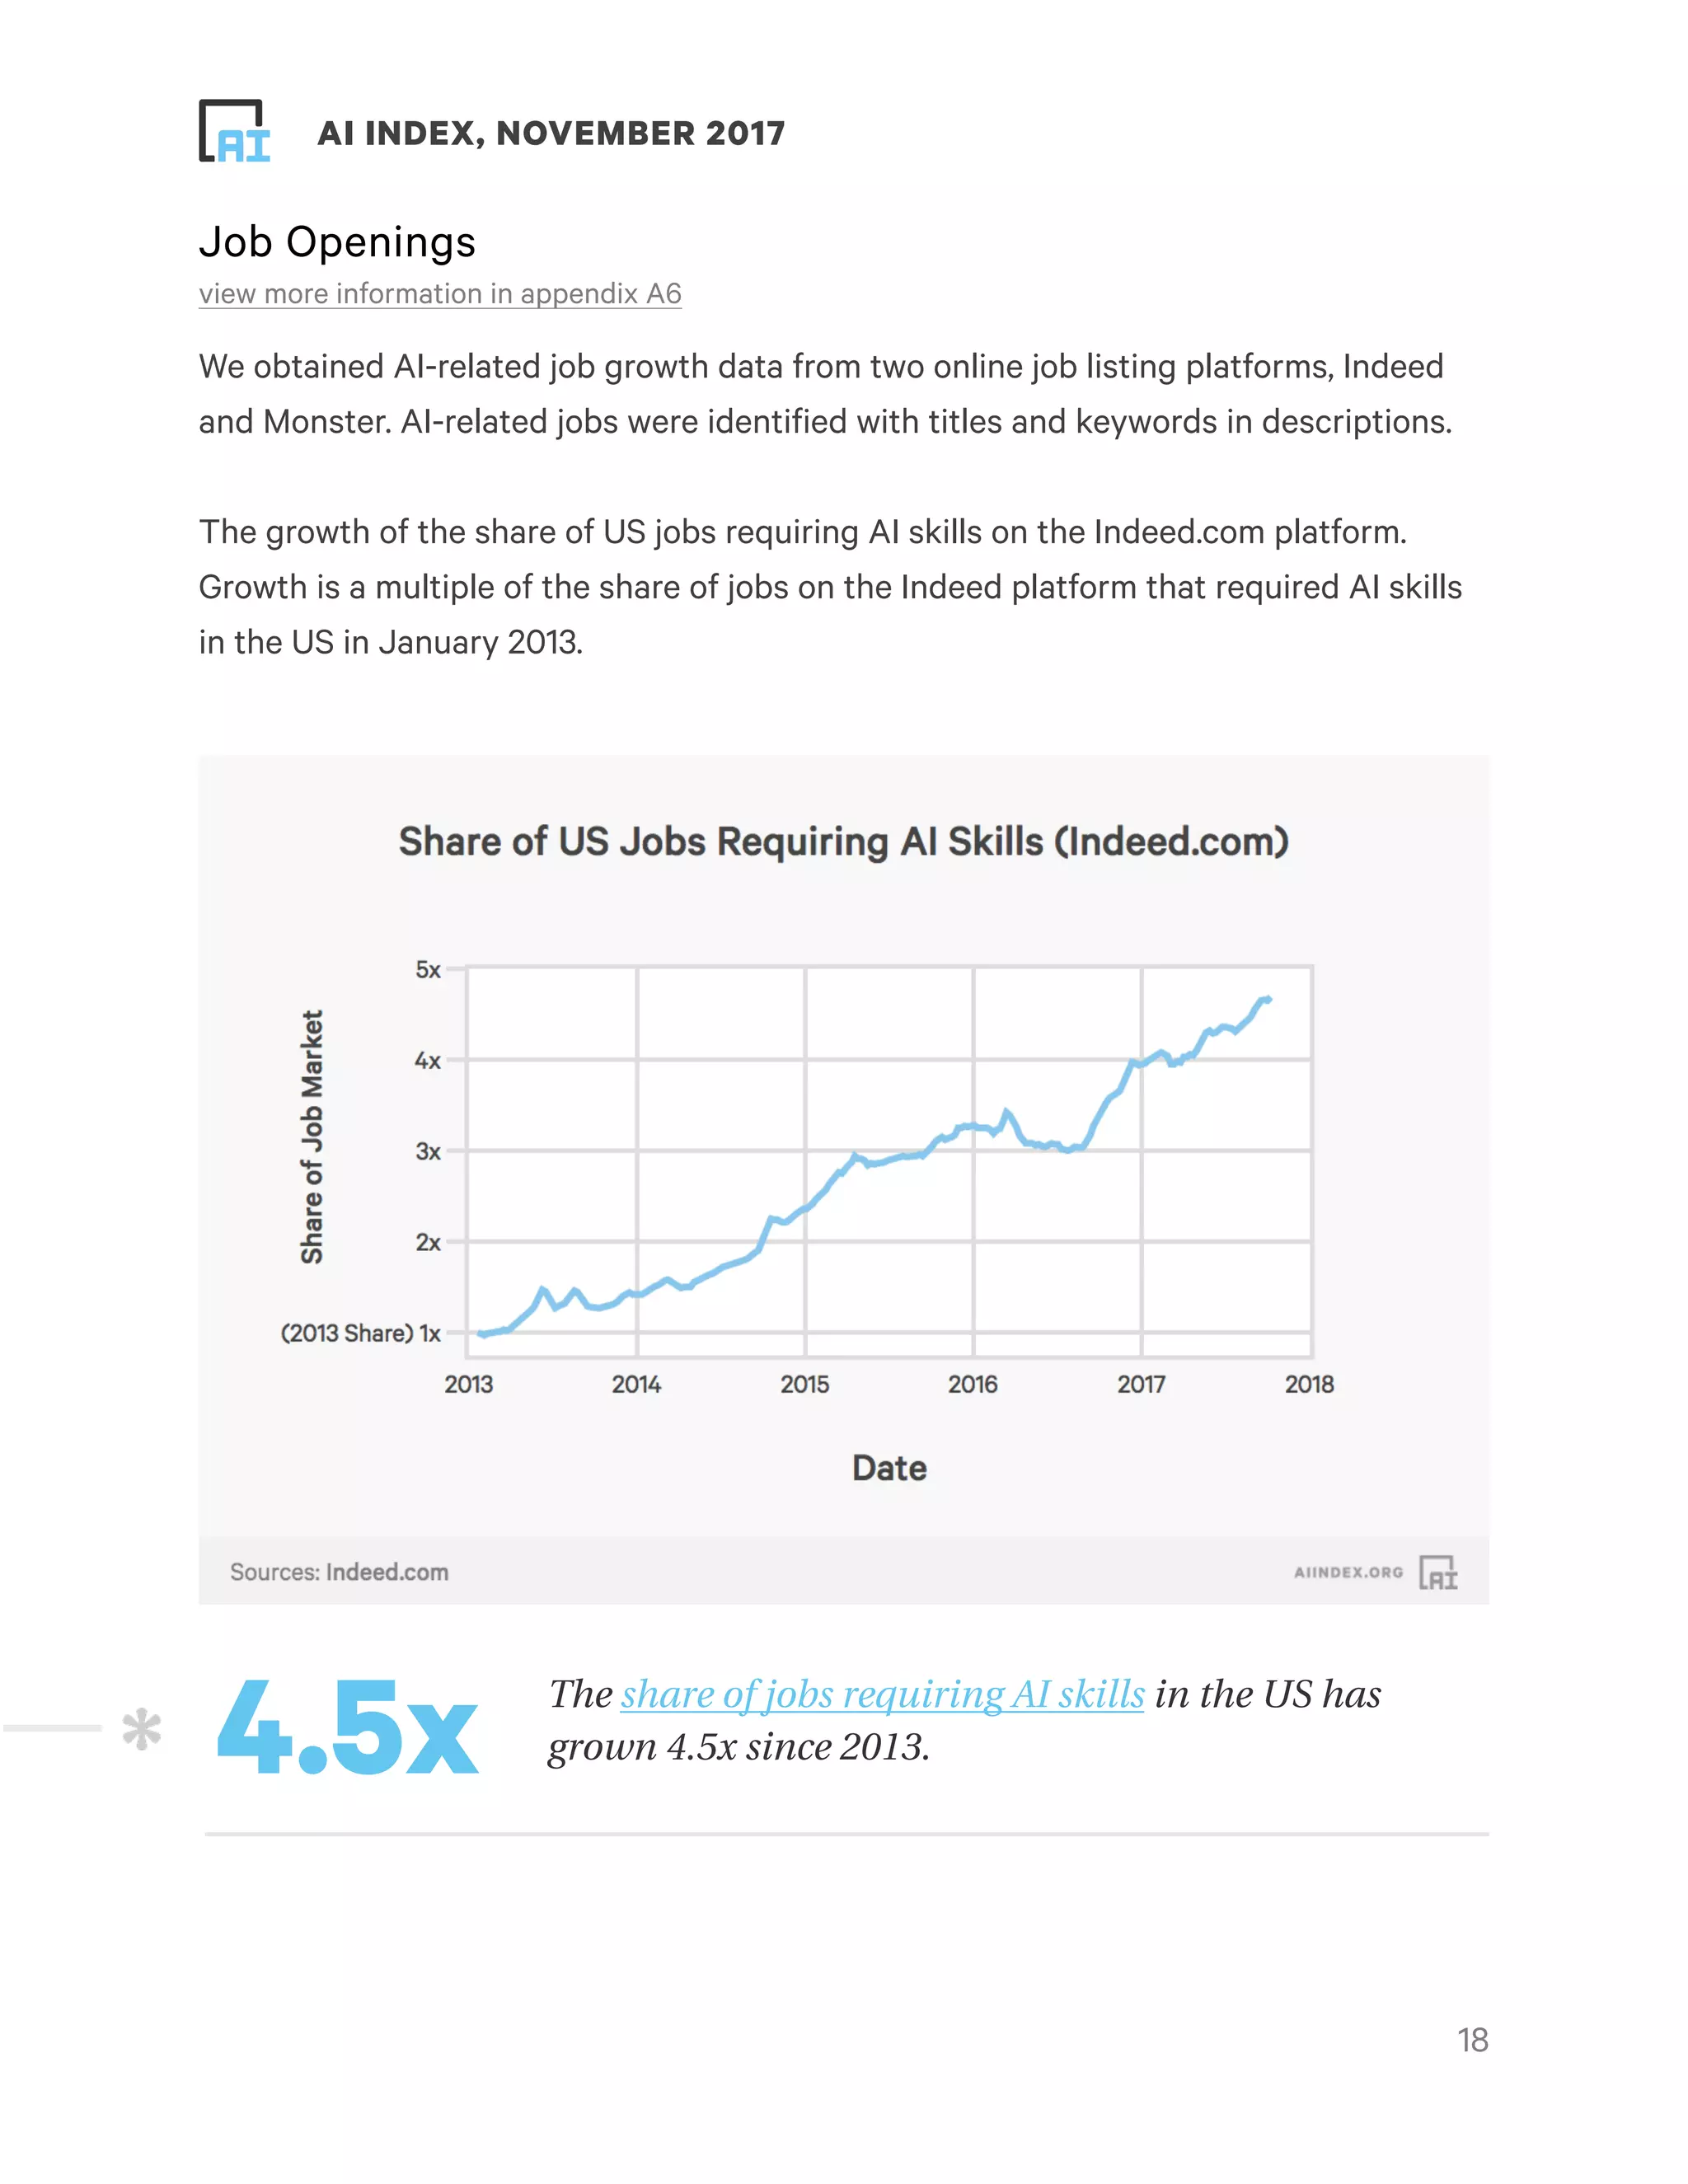
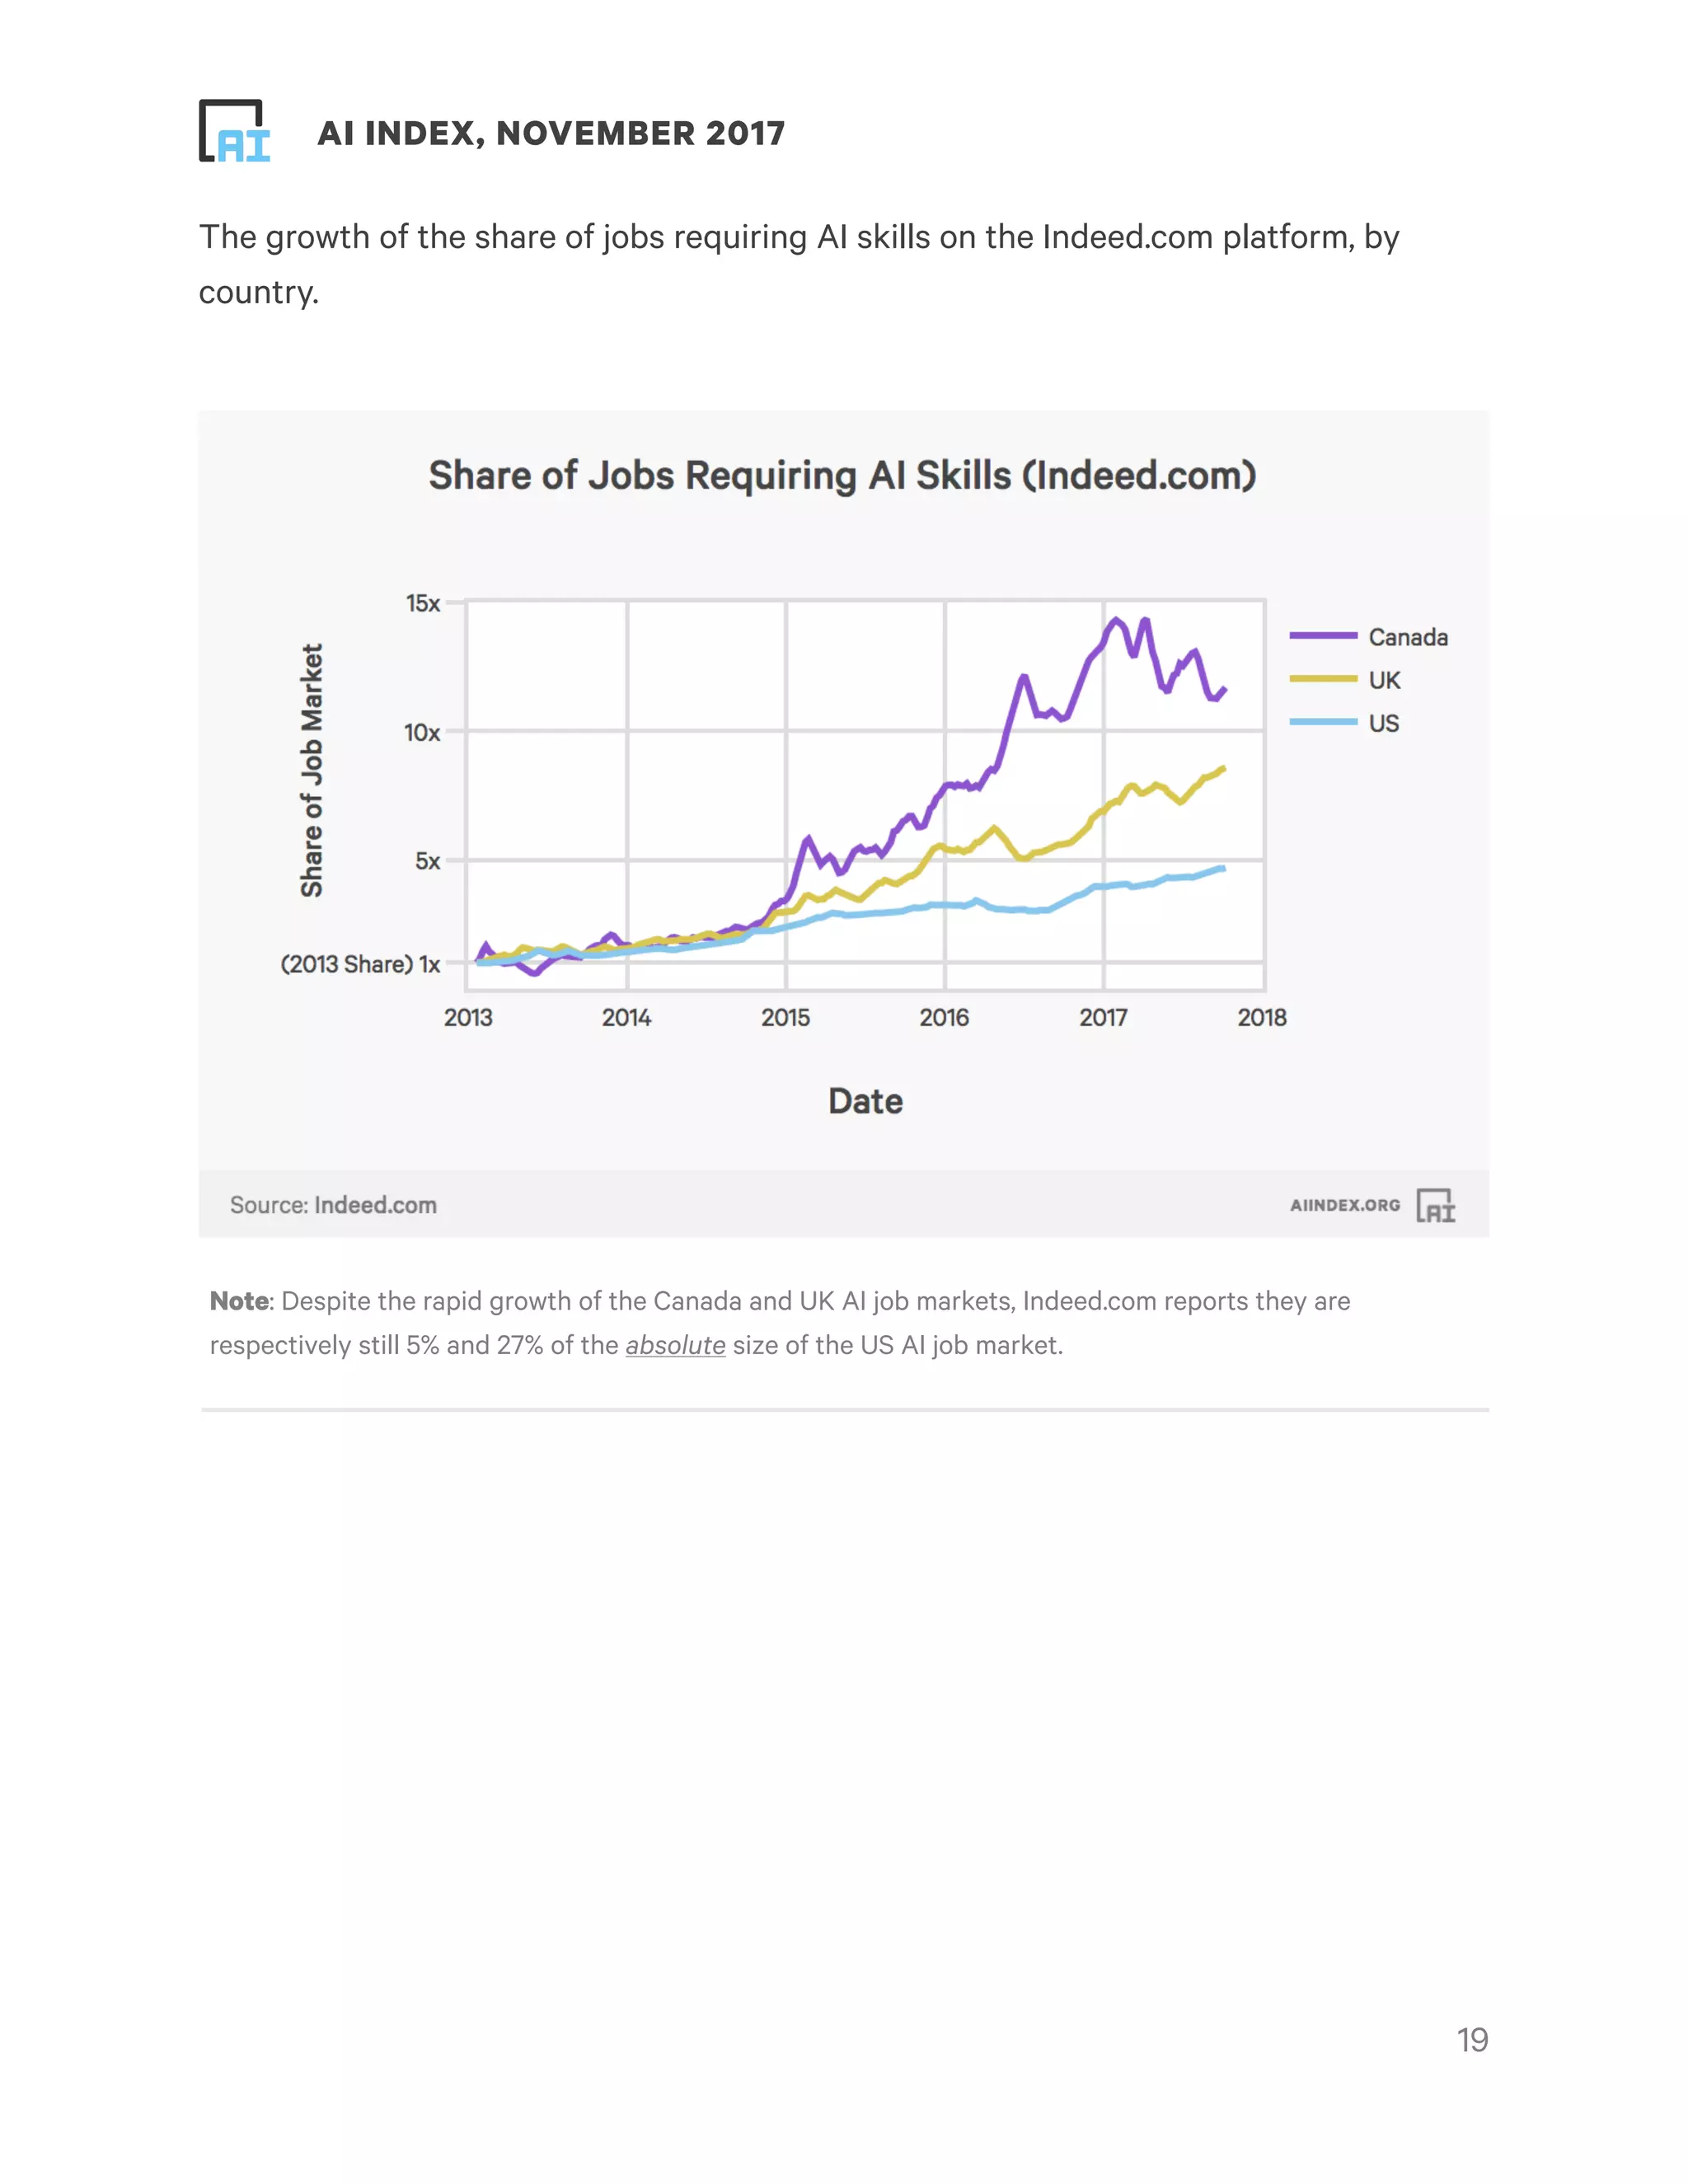
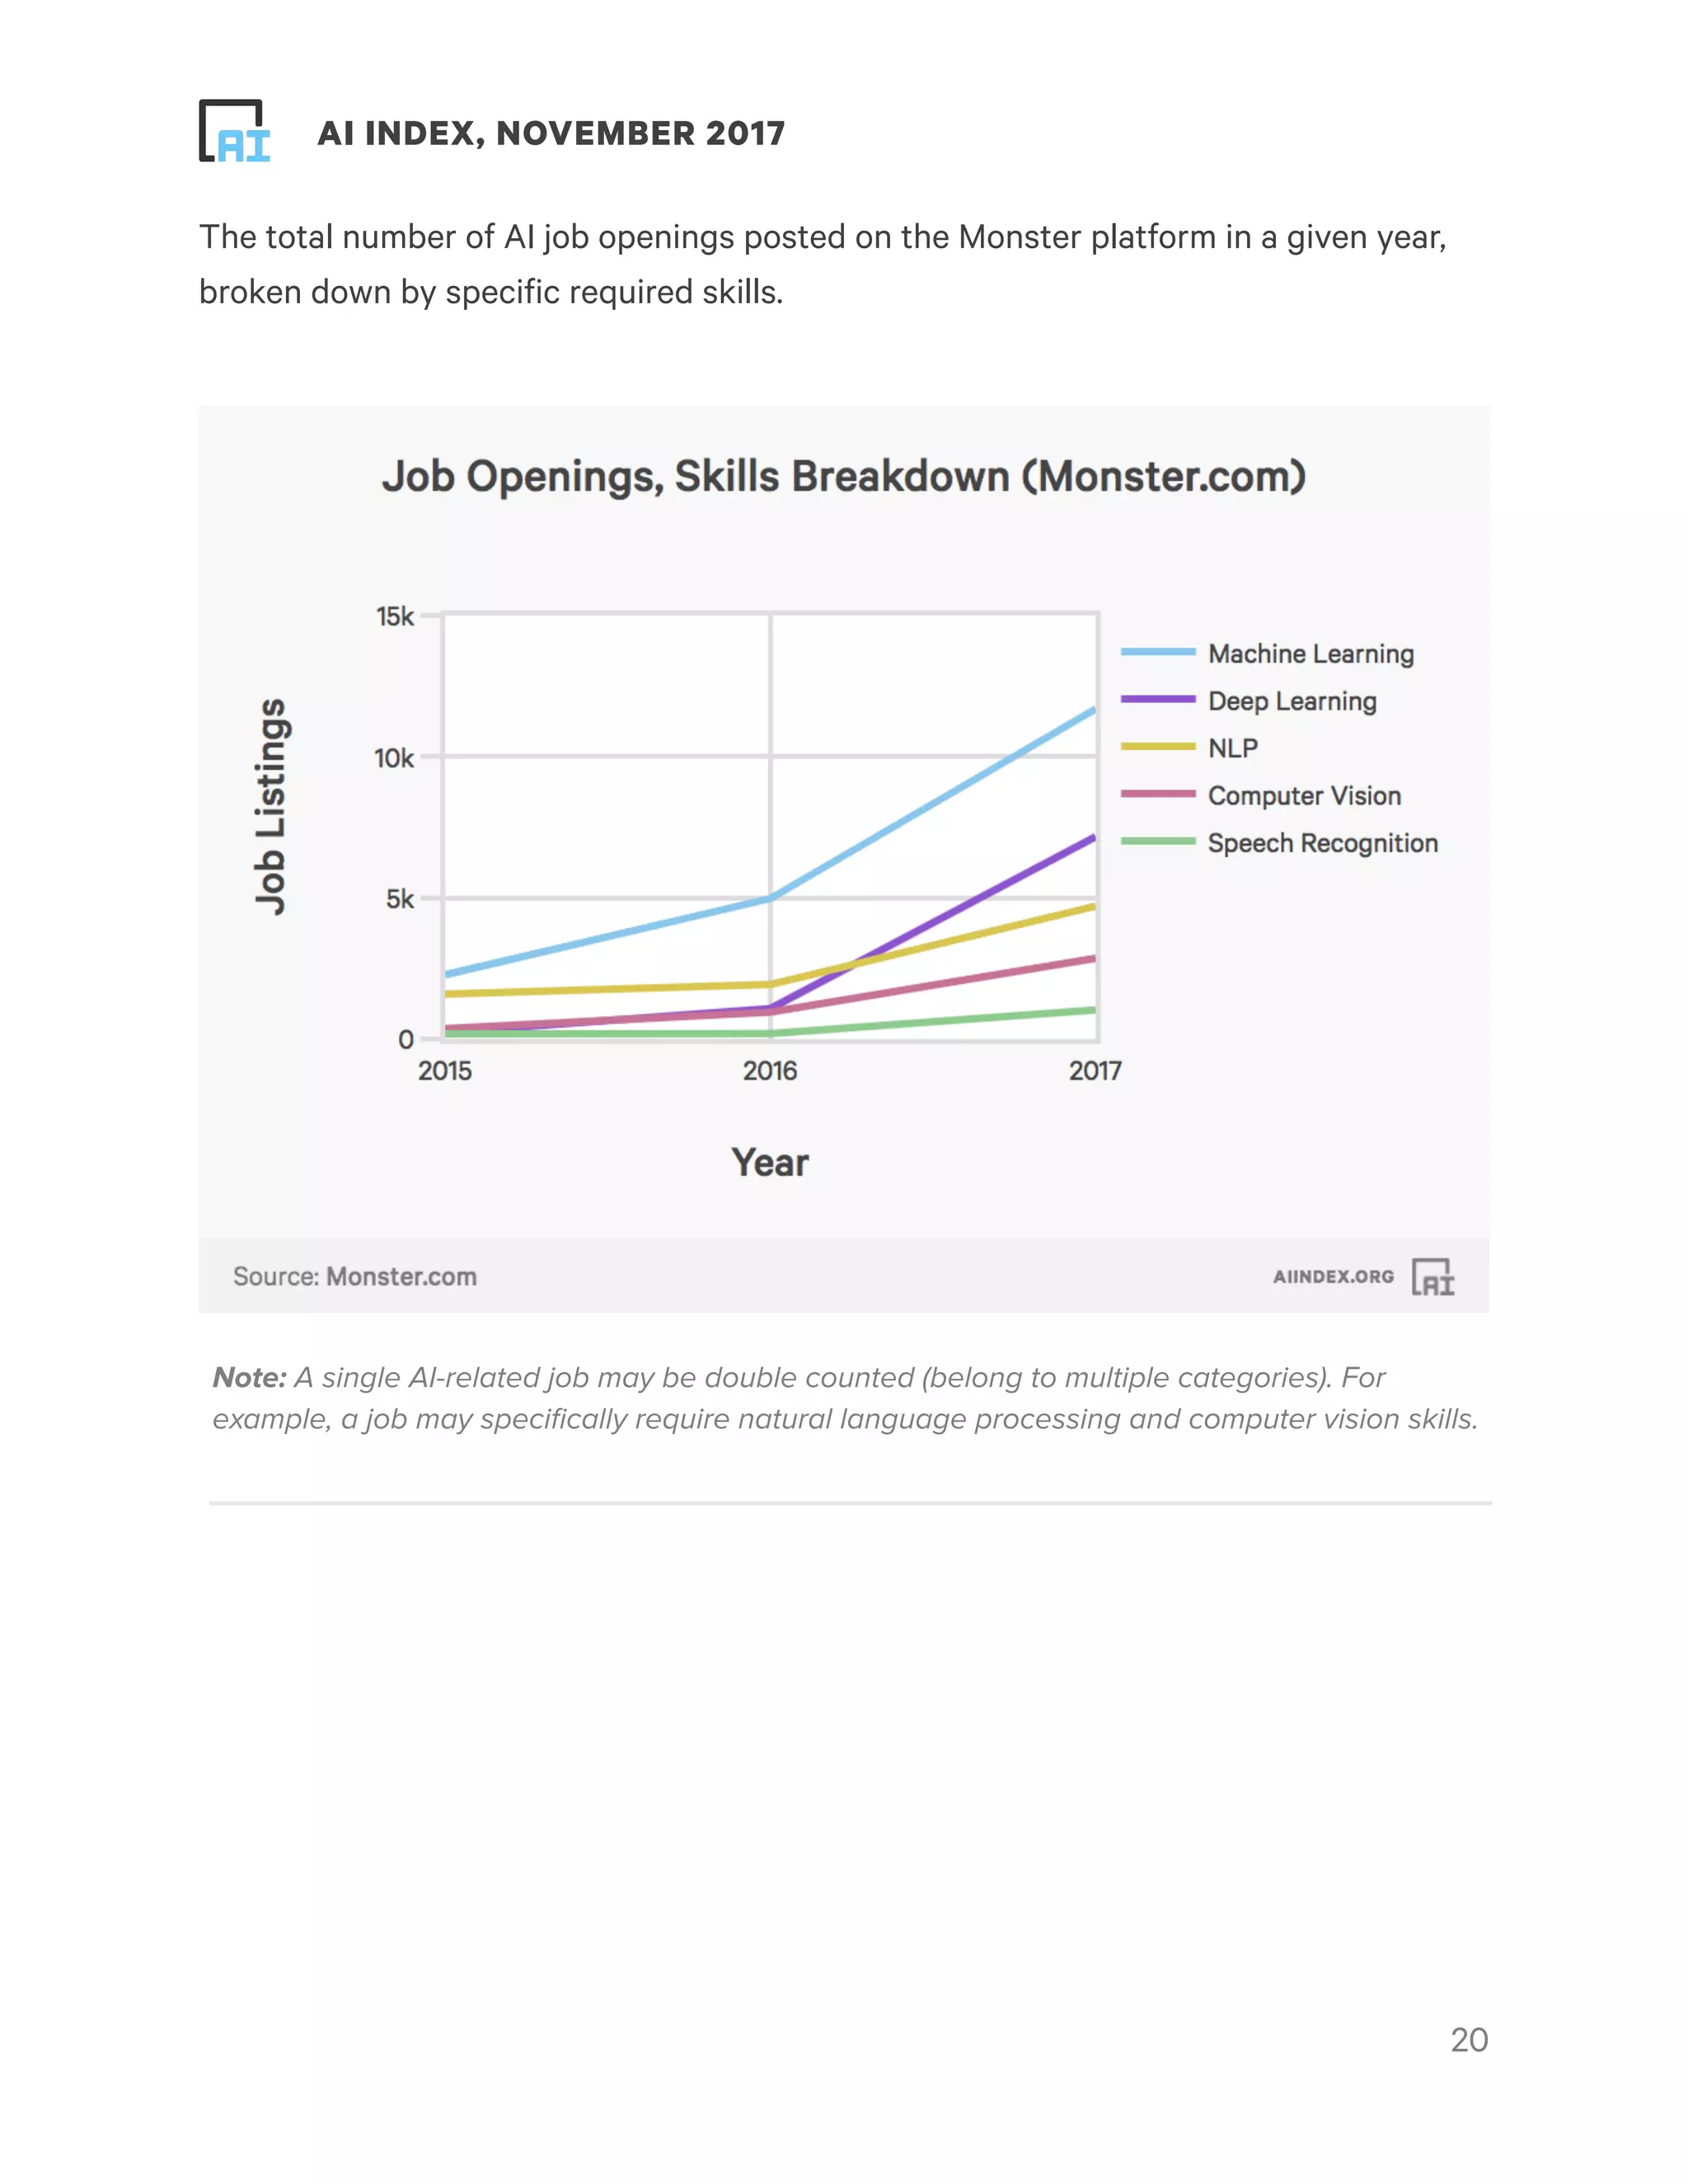
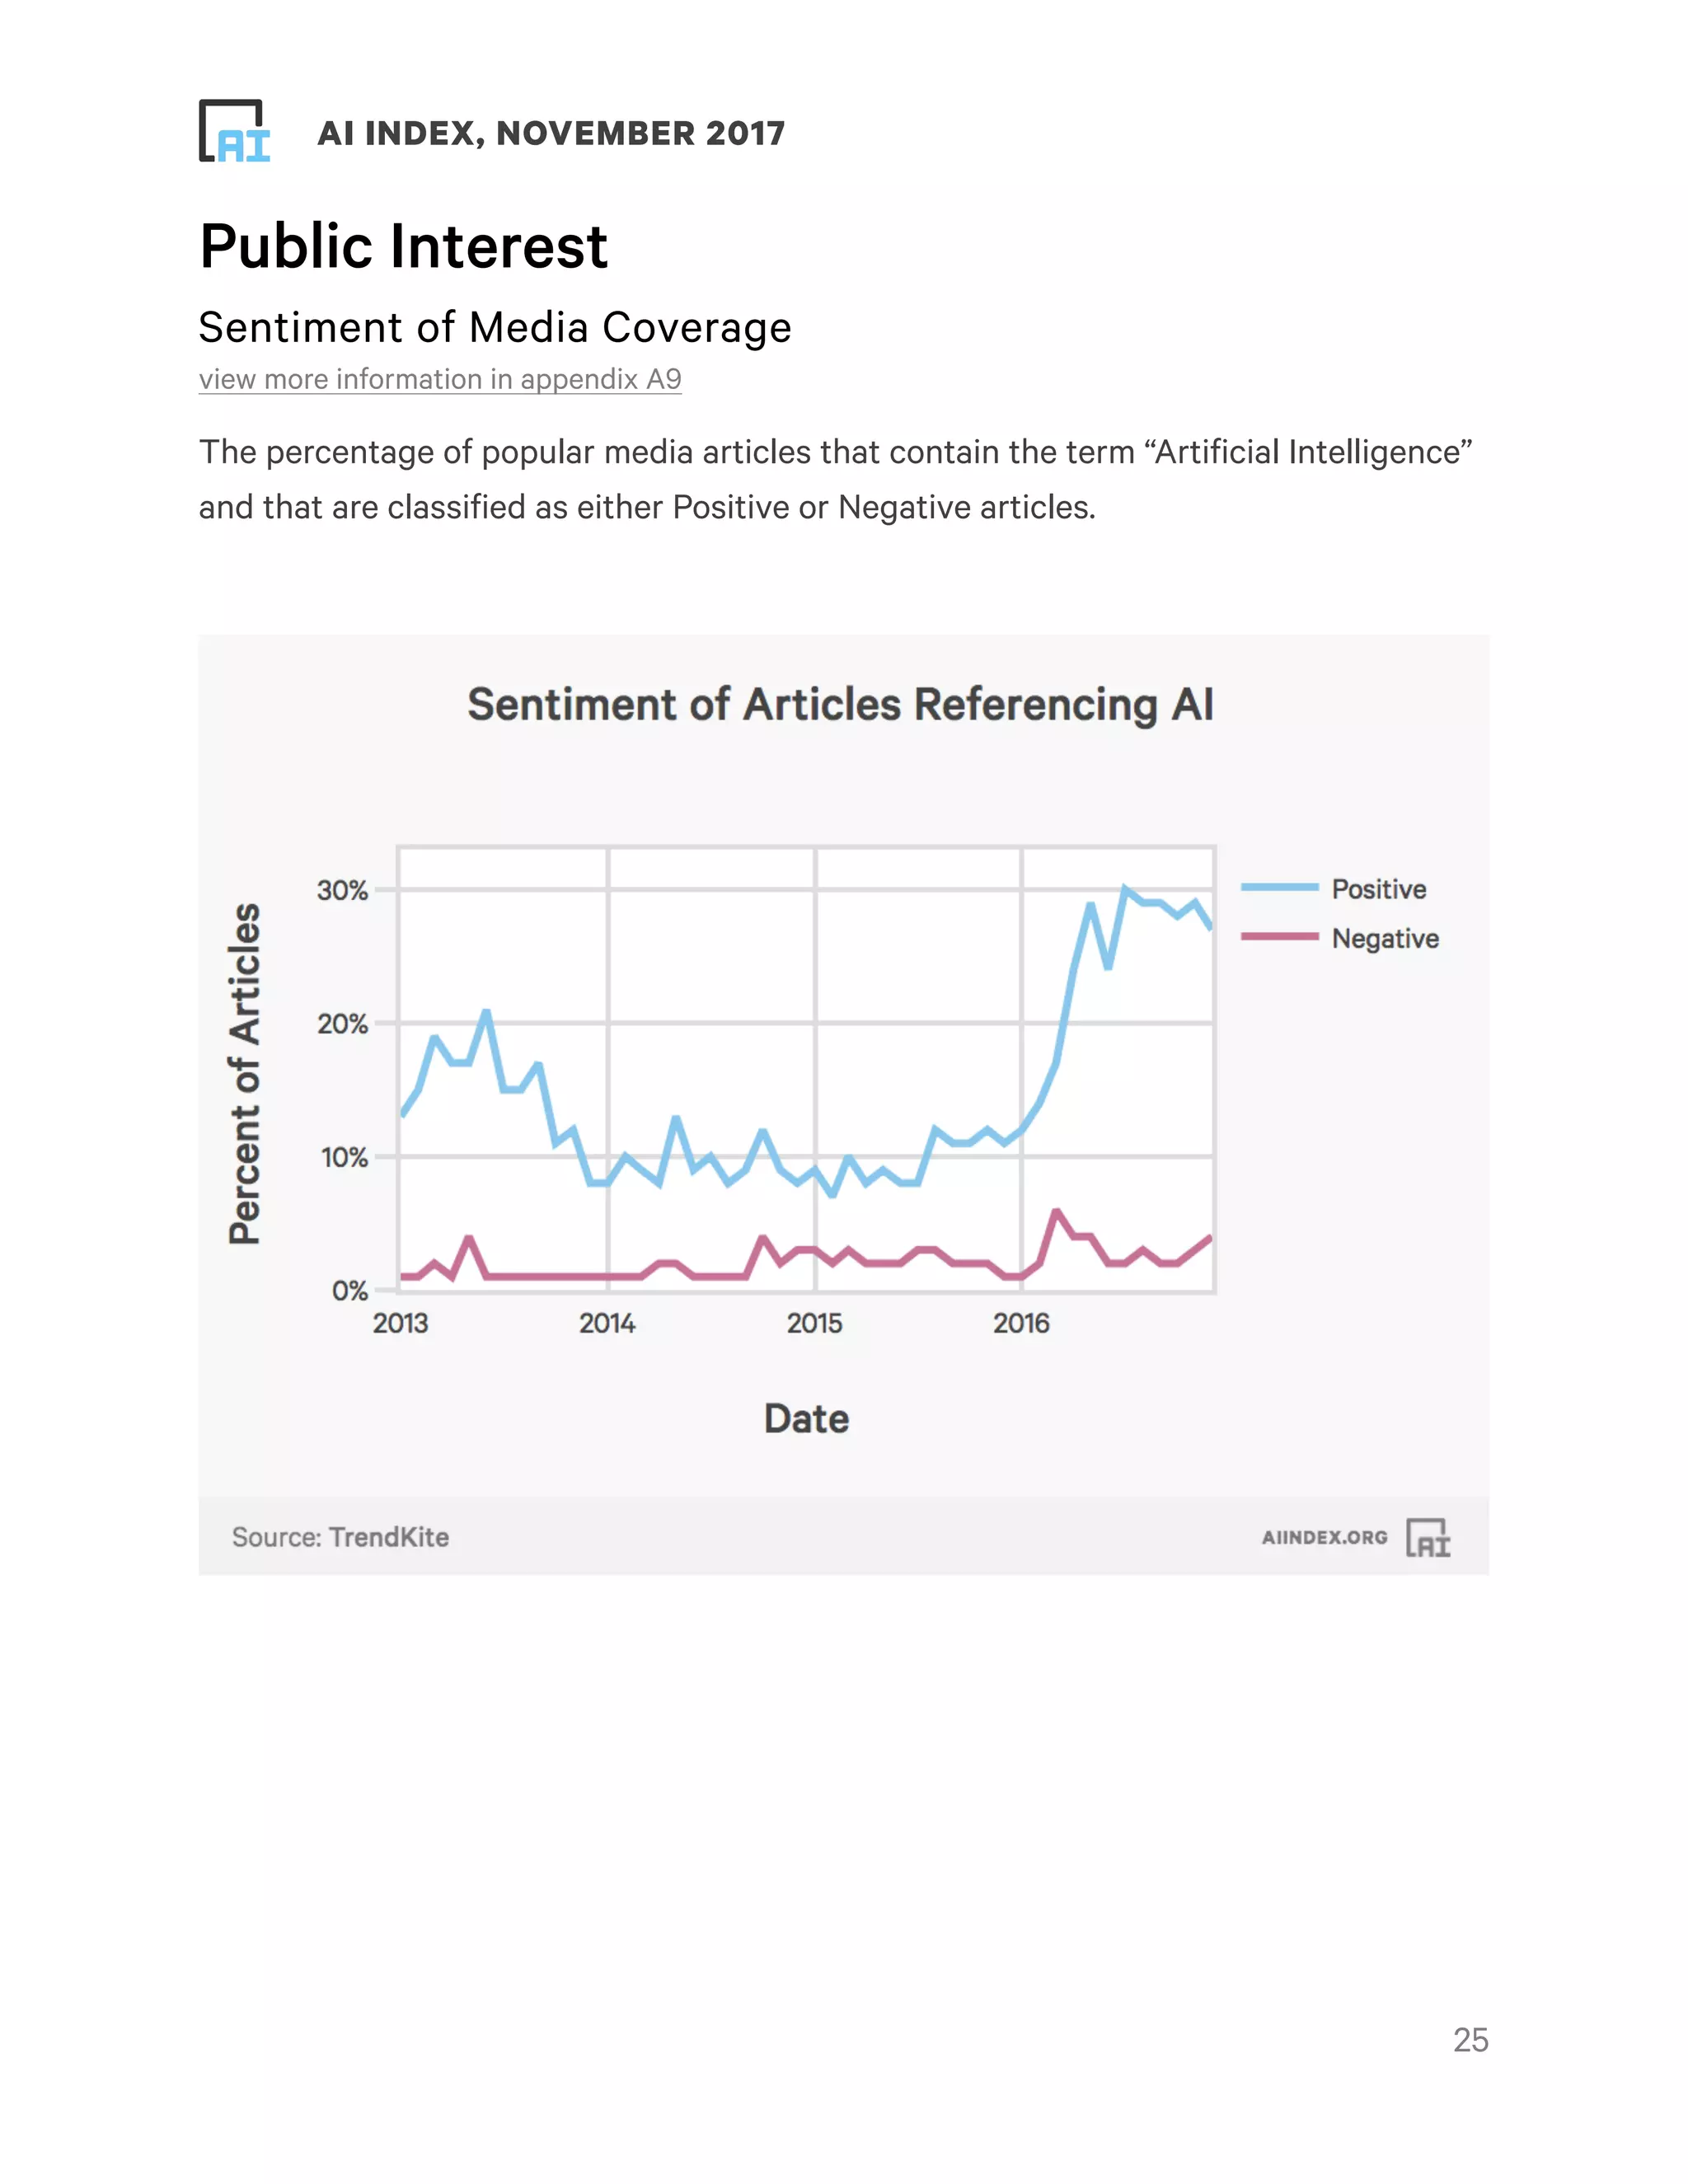
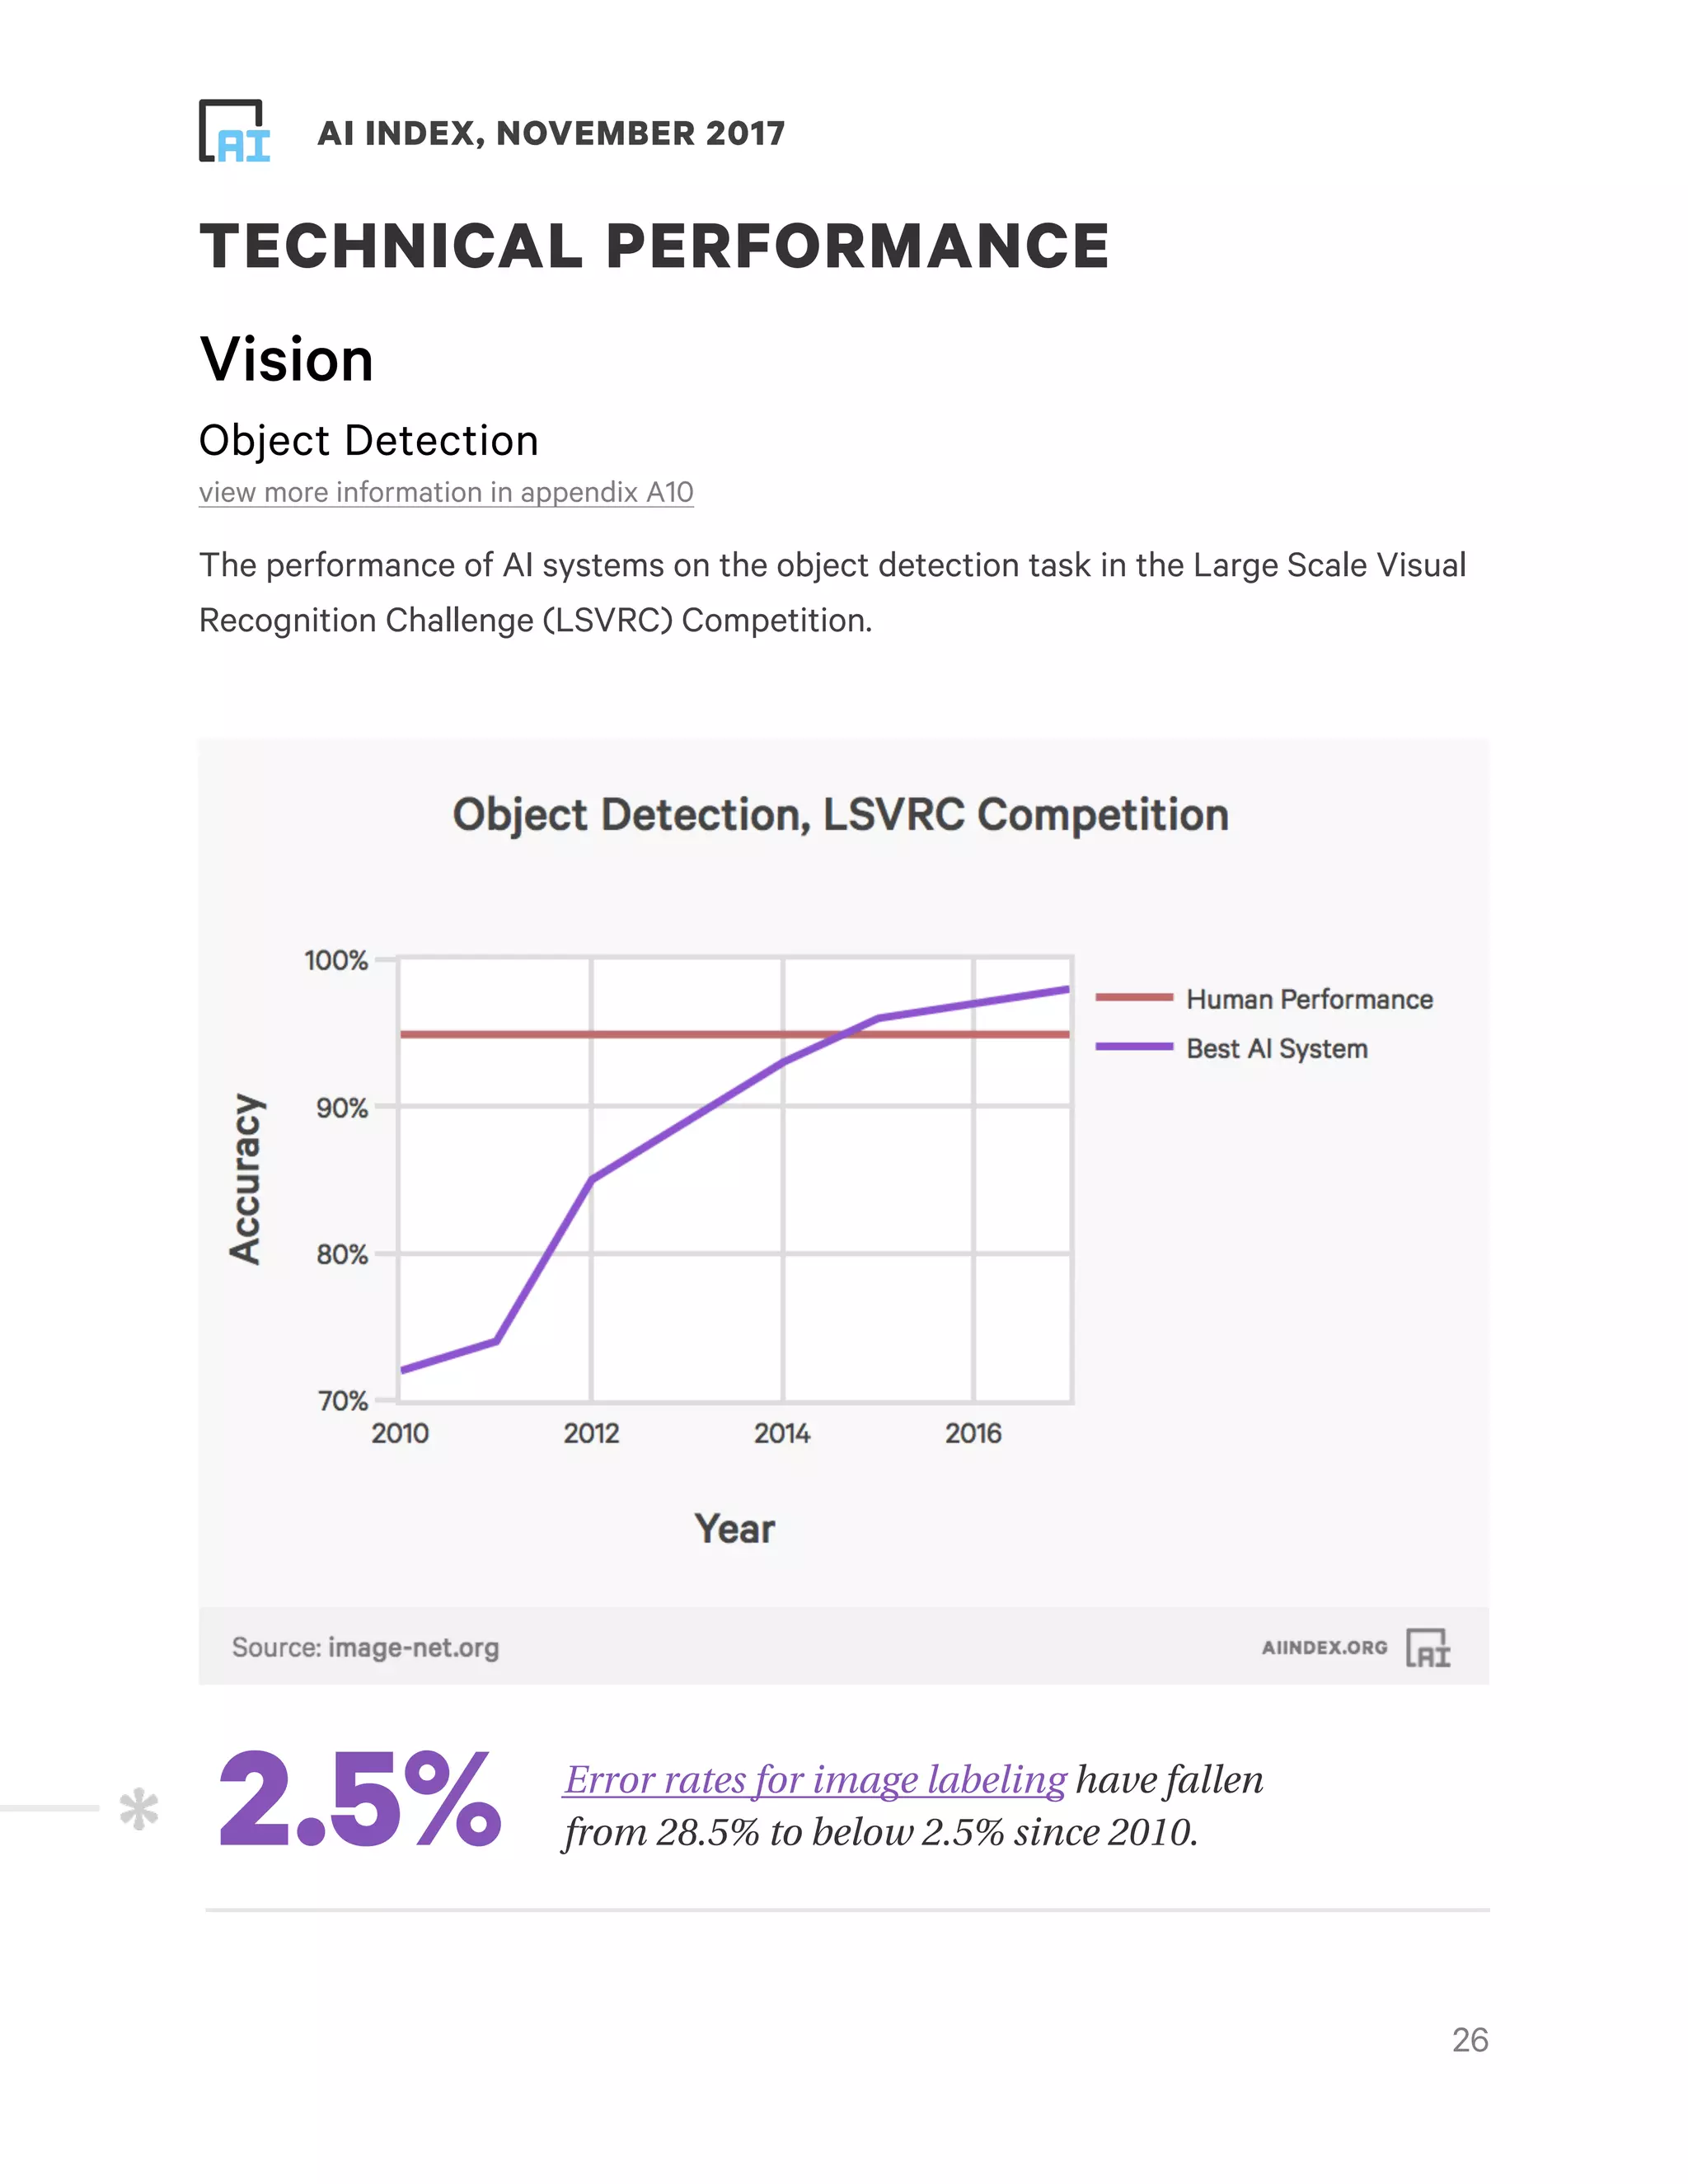
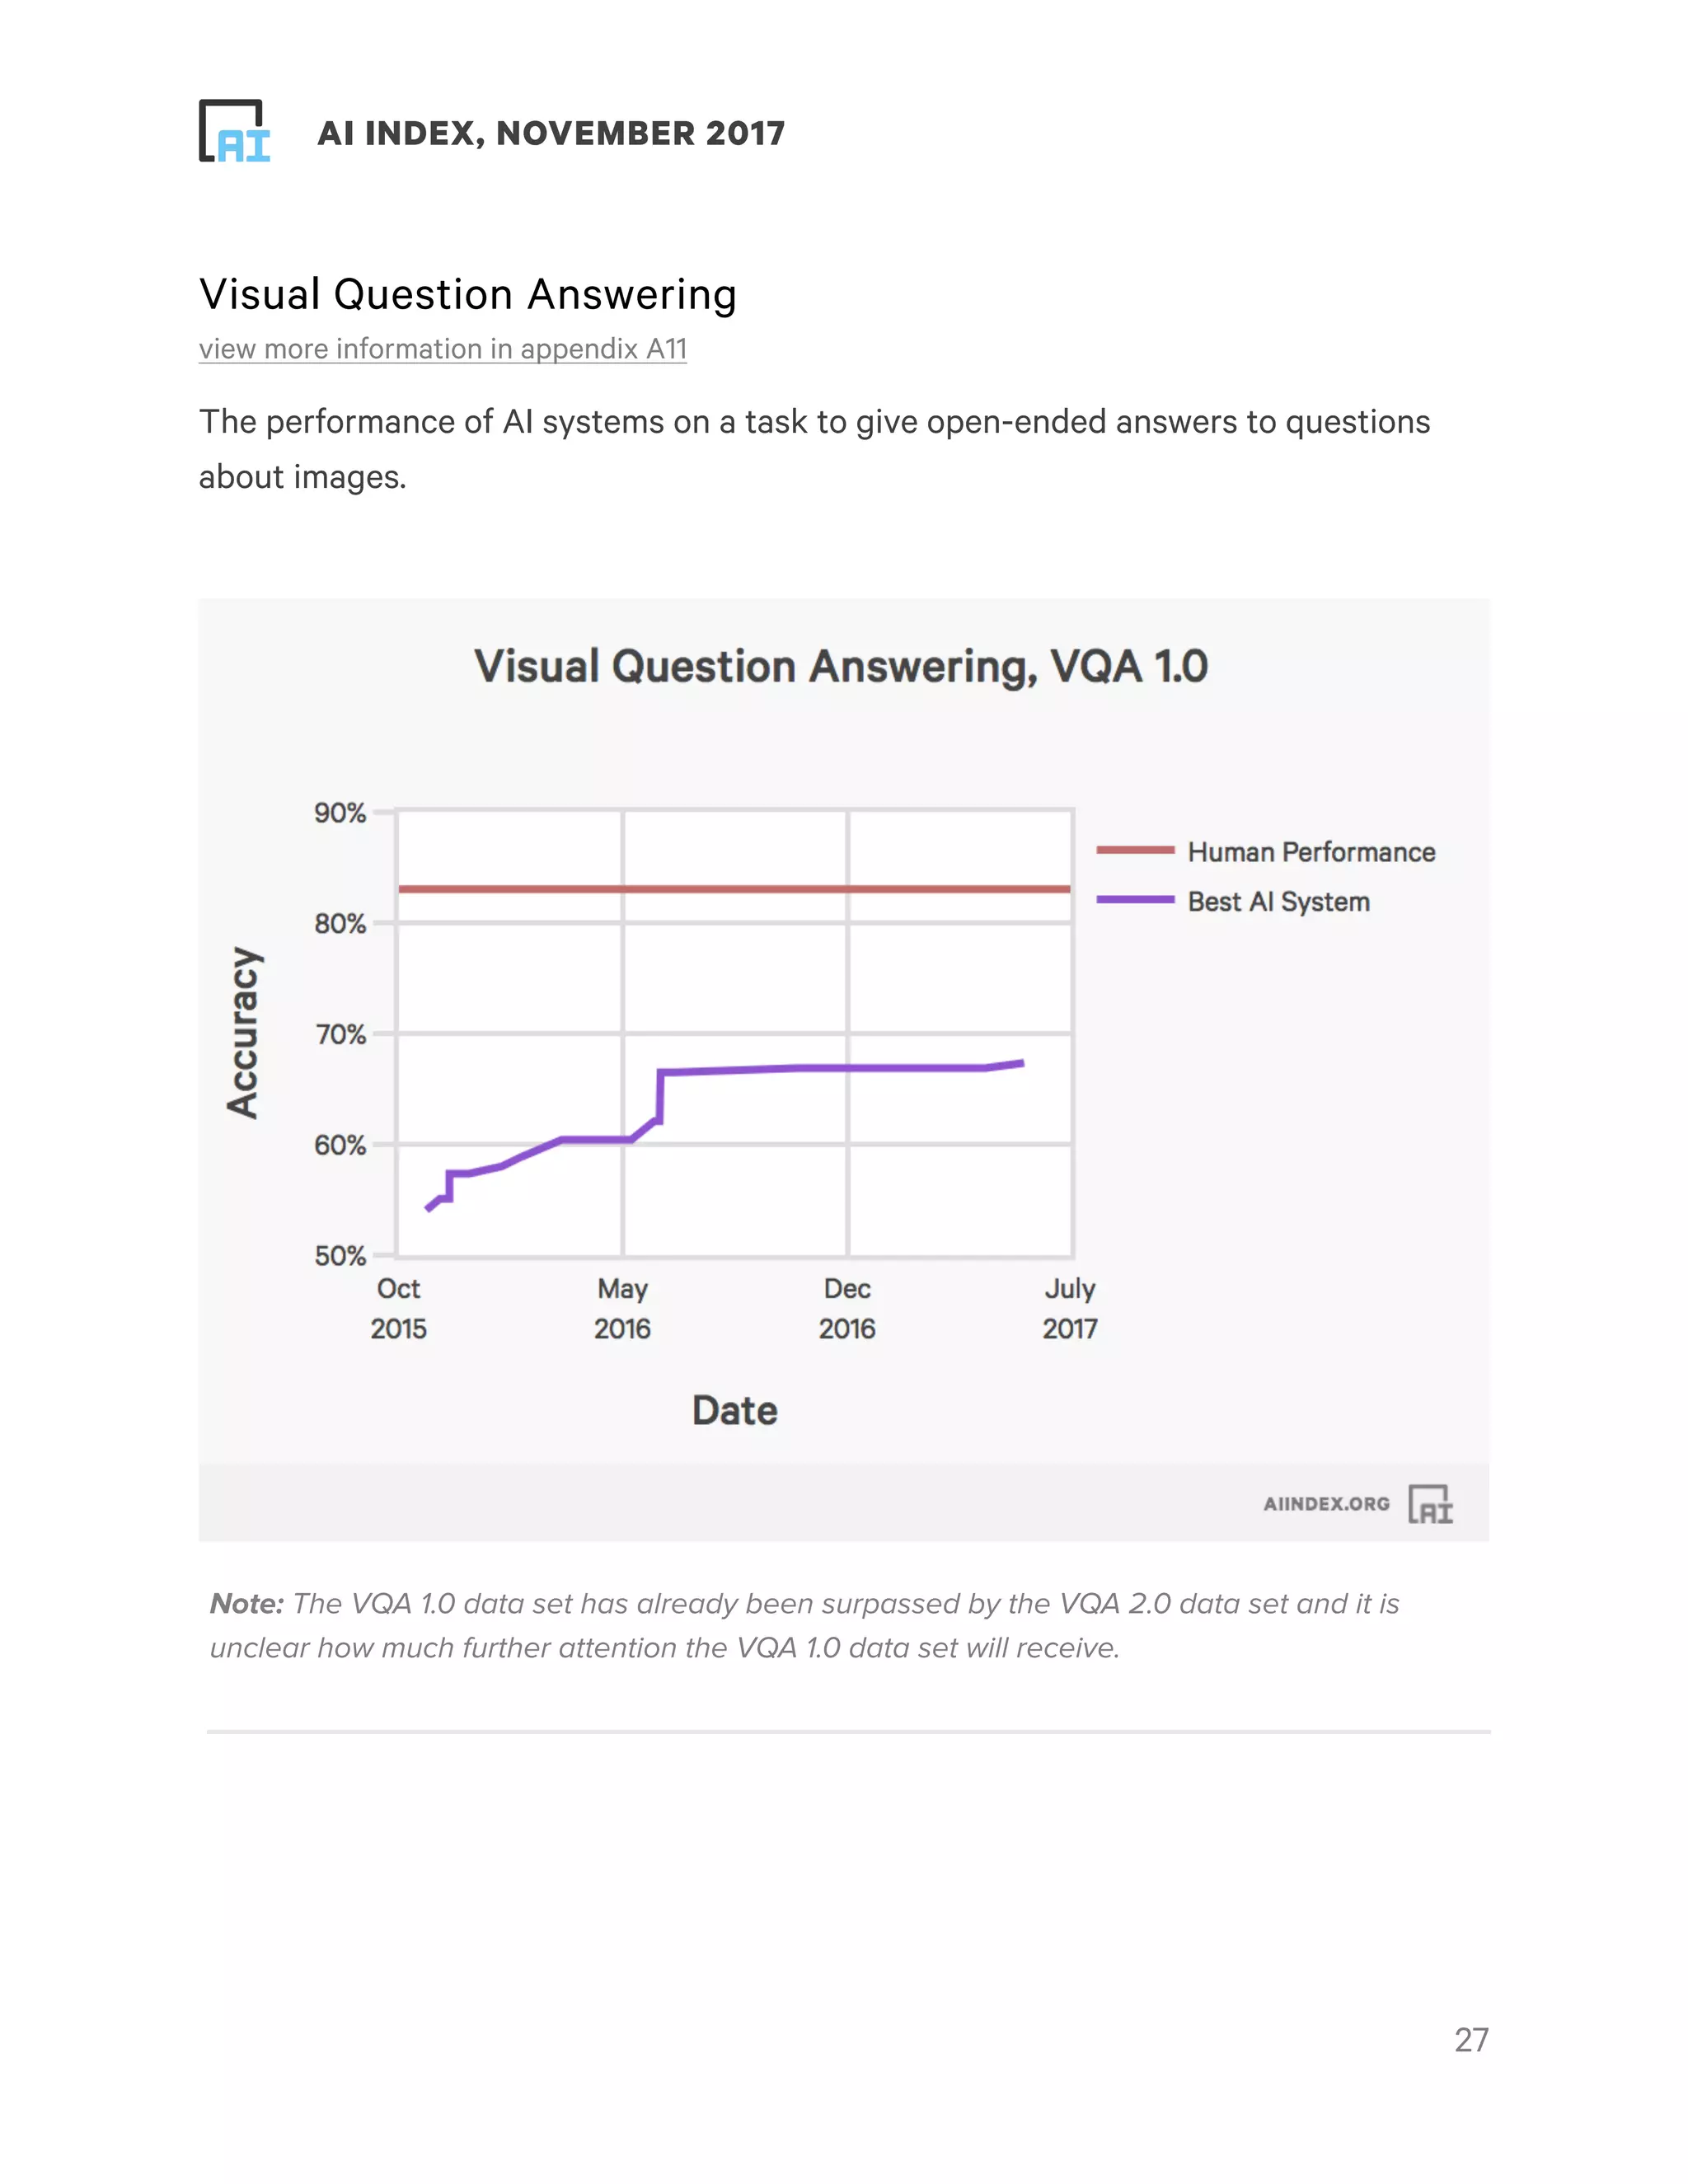
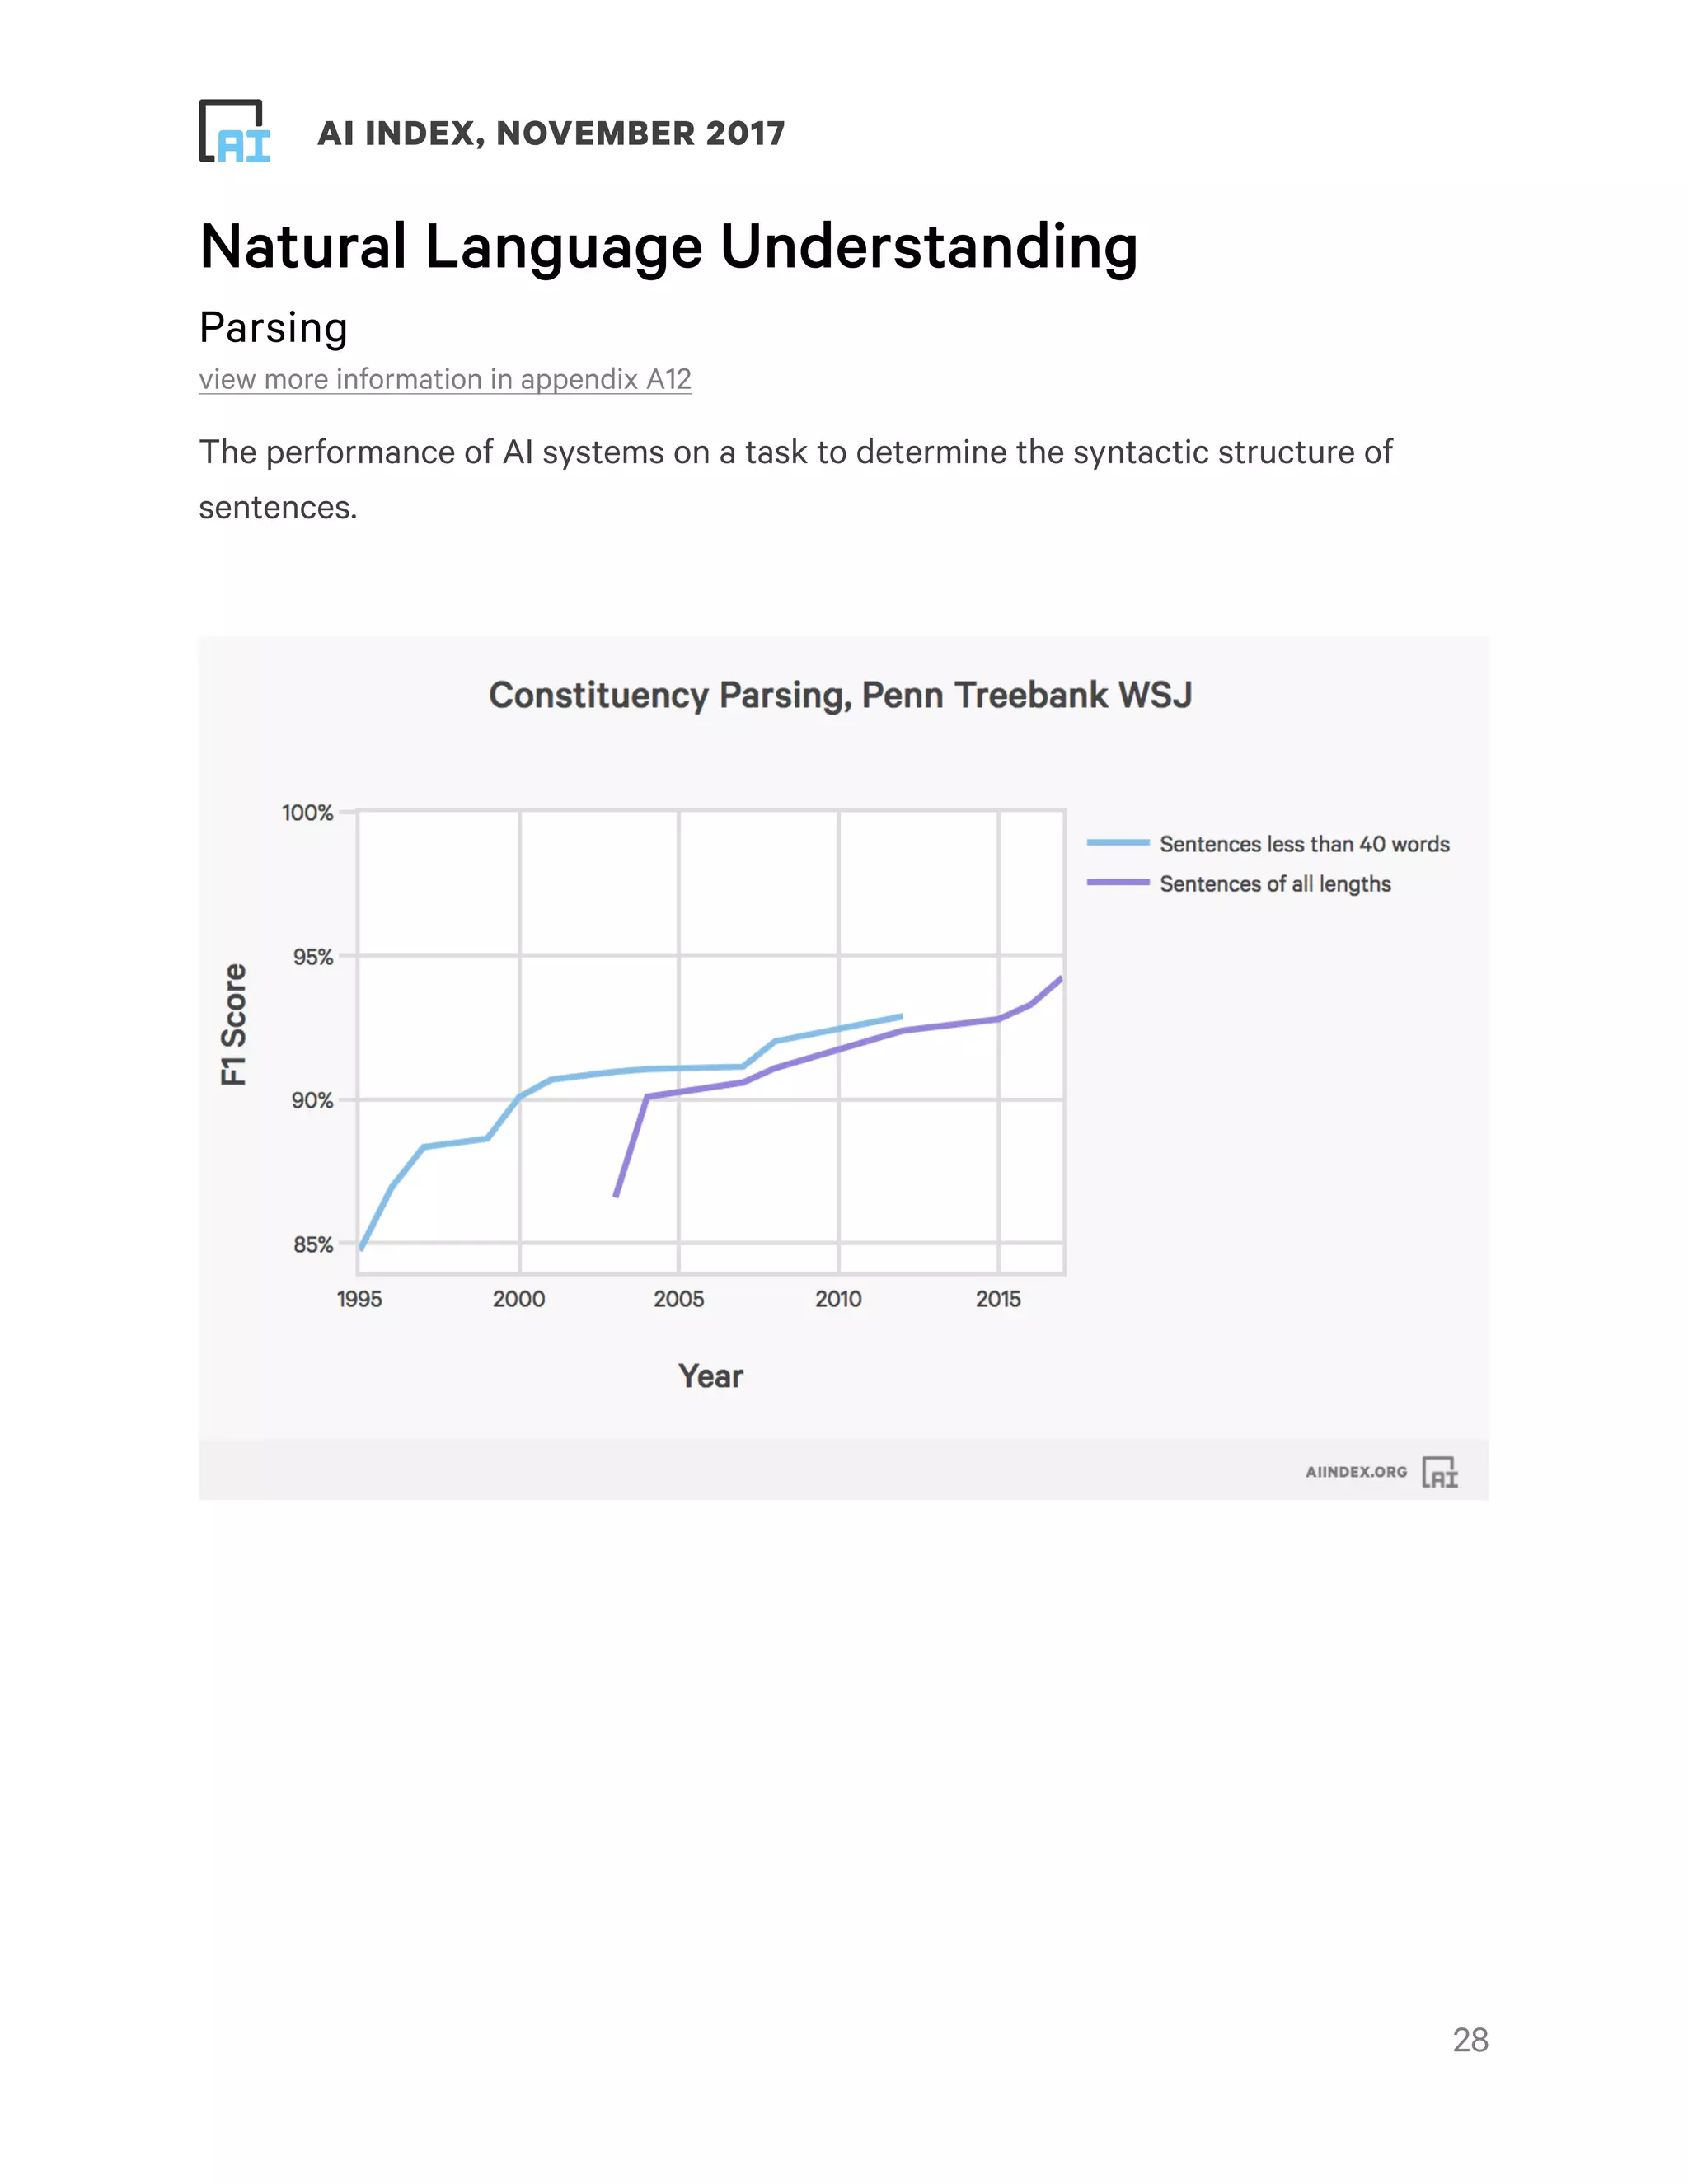
! ! AI INDEX, NOVEMBER 2017
!1
! ! AI INDEX, NOVEMBER 2017
STEERING COMMITTEE
Yoav Shoham (chair)
Stanford University
Raymond Perrault
SRI International
Erik Brynjolfsson
MIT
Jack Clark
OpenAI
PROJECT MANAGER
Calvin LeGassick
!2
! ! AI INDEX, NOVEMBER 2017
TABLE OF CONTENTS
Introduction to the AI Index 2017 Annual Report 5
Overview 7
Volume of Activity 9
Academia 9
Published Papers 9
Course Enrollment 11
Conference Attendance 14
Industry 16
AI-Related Startups 16
AI-Related Startup Funding 17
Job Openings 18
Robot Imports 21
Open Source Software 23
GitHub Project Statistics 23
Public Interest 25
Sentiment of Media Coverage 25
Technical Performance 26
Vision 26
Object Detection 26
Visual Question Answering 27
Natural Language Understanding 28
Parsing 28
Machine Translation 29
Question Answering 30
Speech Recognition 31
!3
! ! AI INDEX, NOVEMBER 2017
Theorem Proving 32
SAT Solving 33
Derivative Measures 34
Towards Human-Level Performance? 37
What’s Missing? 41
Expert Forum 44
Get Involved! 68
Acknowledgements 70
Appendix A: Data Description & Collection Methodology 72
!4
! ! AI INDEX, NOVEMBER 2017
INTRODUCTION TO THE AI INDEX 2017
ANNUAL REPORT
Artificial Intelligence has leapt to the forefront of global discourse, garnering increased
attention from practitioners, industry leaders, policymakers, and the general public.
The diversity of opinions and debates gathered from news articles this year illustrates
just how broadly AI is being investigated, studied, and applied.
However, the field of AI is still evolving rapidly and even experts have a hard time
understanding and tracking progress across the field.
!5
! ! AI INDEX, NOVEMBER 2017
Without the relevant data for reasoning about the state of AI technology, we are
essentially “flying blind” in our conversations and decision-making related to AI.
We are essentially “flying blind” in our conversations and
decision-making related to Artificial Intelligence.
Created and launched as a project of the One Hundred Year Study on AI at Stanford
University (AI100), the AI Index is an open, not-for-profit project to track activity and
progress in AI. It aims to facilitate an informed conversation about AI that is grounded
in data. This is the inaugural annual report of the AI Index, and in this report we look at
activity and progress in Artificial Intelligence through a range of perspectives. We
aggregate data that exists freely on the web, contribute original data, and extract new
metrics from combinations of data series.
All of the data used to generate this report will be openly available on the AI Index
website at aiindex.org. Providing data, however, is just the beginning. To become truly
useful, the AI Index needs support from a larger community. Ultimately, this report is a
call for participation. You have the ability to provide data, analyze collected data, and
make a wish list of what data you think needs to be tracked. Whether you have
answers or questions to provide, we hope this report inspires you to reach out to the
AI Index and become part of the effort to ground the conversation about AI.
!6
! ! AI INDEX, NOVEMBER 2017
OVERVIEW
The first half of the report showcases data aggregated by the AI Index team. This is
followed by a discussion of key areas the report does not address, expert commentary
on the trends displayed in the report, and a call to action to support our data collection
efforts and join the conversation about measuring and communicating progress in AI
technology.
Data Sections
The data in the report is broken into four primary parts:
‱ Volume of Activity
‱ Technical Performance
‱ Derivative Measures
‱ Towards Human-Level Performance?
The Volume of Activity metrics capture the “how much” aspects of the field, like
attendance at AI conferences and VC investments into startups developing AI
systems. The Technical Performance metrics capture the “how good” aspects; for
example, how well computers can understand images and prove mathematical
theorems. The methodology used to collect each data set is detailed in the appendix.
These first two sets of data confirm what is already well recognized: all graphs are “up
and to the right,” reflecting the increased activity in AI efforts as well as the progress
of the technology. In the Derivative Measures section we investigate the relationship
between trends. We also introduce an exploratory measure, the AI Vibrancy Index, that
combines trends across academia and industry to quantify the liveliness of AI as a
field.‹
When measuring the performance of AI systems, it is natural to look for comparisons
to human performance. In the Towards Human-Level Performance section we outline a
short list of notable areas where AI systems have made significant progress towards
!7
! ! AI INDEX, NOVEMBER 2017
matching or exceeding human performance. We also discuss the difficulties of such
comparisons and introduce the appropriate caveats.
Discussion Sections
Following the display of the collected data, we include some discussion of the trends
this report highlights and important areas this report entirely omits.
Part of this discussion centers on the limitations of the report. This report is biased
towards US-centric data sources and may overestimate progress in technical areas by
only tracking well-defined benchmarks. It also lacks demographic breakdowns of data
and contains no information about AI Research & Development investments by
governments and corporations. These areas are deeply important and we intend to
tackle them in future reports. We further discuss these limitations and others in the
What’s Missing section of the report.
As the report’s limitations illustrate, the AI Index will always paint a partial picture. For
this reason, we include subjective commentary from a cross-section of AI experts. This
Expert Forum helps animate the story behind the data in the report and adds
interpretation the report lacks.
Finally, where the experts’ dialogue ends, your opportunity to Get Involved begins. We
will need the feedback and participation of a larger community to address the issues
identified in this report, uncover issues we have omitted, and build a productive
process for tracking activity and progress in Artificial Intelligence.

!8
! ! AI INDEX, NOVEMBER 2017
VOLUME OF ACTIVITY
Academia
Published Papers
view more information in appendix A1
The number of Computer Science papers published and tagged with the keyword
“Artificial Intelligence” in the Scopus database of academic papers.
!9
9x The number of AI papers produced each year has
increased by more than 9x since 1996.
! ! AI INDEX, NOVEMBER 2017
A comparison of the annual publishing rates of different categories of academic
papers, relative to their publishing rates in 1996. The graph displays the growth of
papers across all fields, papers within the Computer Science field, and AI papers within
the Computer Science field.
The data illustrates that growth in AI publishing is driven by more than a growing
interest in the broader field of Computer Science. Concretely, while the number of
papers within the general field of Computer Science has grown by 6x since 1996 the
number of AI papers produced each year has increased by more than 9x in that same
period.

!10
! ! AI INDEX, NOVEMBER 2017
Course Enrollment
view more information in appendix A2
The number of students enrolled in introductory Artificial Intelligence & Machine
Learning courses at Stanford University.
ML is a subfield of AI. We highlight ML courses because of their rapid enrollment
growth and because ML techniques are critical to many recent AI achievements.
!11
Introductory AI class enrollment at Stanford has
increased 11x since 1996.
Note: The dip in Stanford ML enrollment for the 2016 academic year
reflects an administrative quirk that year, not student interest. Details in
appendix.
11x
! ! AI INDEX, NOVEMBER 2017
We highlight Stanford because our data on other universities is limited. However, we
can project that past enrollment trends at other universities are similar to Stanford’s.
!12
Note: Many universities have offered AI courses since before the 90’s. The graphs above represent the years
for which we found available data.
! ! AI INDEX, NOVEMBER 2017
It is worth noting that these graphs represent a specific sliver of the higher education
landscape, and the data is not necessarily representative of trends in the broader
landscape of academic institutions.
!13
Note: Many universities have offered ML courses since before the 90’s. The graphs above represent the
years for which we found available data.
! ! AI INDEX, NOVEMBER 2017
Conference Attendance
view more information in appendix A3
The number of attendees at a representative sample of AI conferences. The data is
split into large conferences (over 1000 attendees in 2016) and small conferences
(under 1000 attendees in 2016).
!14
These attendance numbers show that research
focus has shifted from symbolic reasoning
to machine learning and deep learning.
Shifting
Focus Note: Most of the conferences have existed since the 1980s. The data
above represents the years attendance data was recorded.
! ! AI INDEX, NOVEMBER 2017
!15
Despite shifting focus, there is still a
smaller research community making
steady progress on symbolic reasoning
methods in AI.
Steady
Progress
! ! AI INDEX, NOVEMBER 2017
Industry
AI-Related Startups
view more information in appendix A4
The number of active venture-backed US private companies developing AI systems.
!16
The number of active US startups developing AI
systems has increased 14x since 2000.14x
! ! AI INDEX, NOVEMBER 2017
AI-Related Startup Funding
view more information in appendix A5
The amount of annual funding by VC’s into US AI startups across all funding stages.


!17
Annual VC investment into US startups developing AI
systems has increased 6x since 2000.6x
! ! AI INDEX, NOVEMBER 2017
Job Openings
view more information in appendix A6
We obtained AI-related job growth data from two online job listing platforms, Indeed
and Monster. AI-related jobs were identified with titles and keywords in descriptions.
The growth of the share of US jobs requiring AI skills on the Indeed.com platform.
Growth is a multiple of the share of jobs on the Indeed platform that required AI skills
in the US in January 2013.


!18
The share of jobs requiring AI skills in the US has
grown 4.5x since 2013.4.5x
! ! AI INDEX, NOVEMBER 2017
The growth of the share of jobs requiring AI skills on the Indeed.com platform, by
country.
!19
Note: Despite the rapid growth of the Canada and UK AI job markets, Indeed.com reports they are
respectively still 5% and 27% of the absolute size of the US AI job market.
! ! AI INDEX, NOVEMBER 2017
The total number of AI job openings posted on the Monster platform in a given year,
broken down by specific required skills.
!20
Note: A single AI-related job may be double counted (belong to multiple categories). For
example, a job may speciïŹcally require natural language processing and computer vision skills.
! ! AI INDEX, NOVEMBER 2017
Robot Imports
view more information in appendix A7
The number of imports of industrial robot units into North America and globally.
!21
! ! AI INDEX, NOVEMBER 2017
The growth of imports of industrial robot units into North America and globally.
!22
! ! AI INDEX, NOVEMBER 2017
Open Source Software
GitHub Project Statistics
view more information in appendix A8
The number of times the TensorFlow and Scikit-Learn software packages have been
Starred on GitHub. TensorFlow and Scikit-Learn are popular software packages for
deep learning and machine learning.
Software developers “Star” software projects on GitHub to indicate projects they are
interested in, express appreciation for projects, and navigate to projects quickly. Stars
can provide a signal for developer interest in and usage of software.

!23
! ! AI INDEX, NOVEMBER 2017
The number of times various AI & ML software packages have been Starred on
GitHub.
!24
Note: Forks of GitHub repositories follow almost identical trends (though, the absolute number
of forks and stars for each repo diïŹ€er). See the appendix for info on gathering Forks data.
! ! AI INDEX, NOVEMBER 2017
Public Interest
Sentiment of Media Coverage
view more information in appendix A9
The percentage of popular media articles that contain the term “Artificial Intelligence”
and that are classified as either Positive or Negative articles.
!25
! ! AI INDEX, NOVEMBER 2017
TECHNICAL PERFORMANCE
Vision
Object Detection
view more information in appendix A10
The performance of AI systems on the object detection task in the Large Scale Visual
Recognition Challenge (LSVRC) Competition.
!26
Error rates for image labeling have fallen
from 28.5% to below 2.5% since 2010.2.5%
! ! AI INDEX, NOVEMBER 2017
Visual Question Answering
view more information in appendix A11
The performance of AI systems on a task to give open-ended answers to questions
about images.
!27
Note: The VQA 1.0 data set has already been surpassed by the VQA 2.0 data set and it is
unclear how much further attention the VQA 1.0 data set will receive.
! ! AI INDEX, NOVEMBER 2017
Natural Language Understanding
Parsing
view more information in appendix A12
The performance of AI systems on a task to determine the syntactic structure of
sentences.
!28
! ! AI INDEX, NOVEMBER 2017
Machine Translation
view more information in appendix A13
The performance of AI systems on a task to translate news between English and
German.
!29
! ! AI INDEX, NOVEMBER 2017
Question Answering
view more information in appendix A14
The performance of AI systems on a task to find the answer to a question within a
document.


!30
! ! AI INDEX, NOVEMBER 2017
Speech Recognition
view more information in appendix A15
The performance of AI systems on a task to recognize speech from phone call audio.


!31
! ! AI INDEX, NOVEMBER 2017
Theorem Proving
view more information in appendix A16
The average tractability of a large set of theorem proving problems for Automatic
Theorem Provers. “Tractability” measures the fraction of state-of-the-art Automatic
Theorem Provers that can solve a problem. See appendix for details about the
“tractability” metric.
!32
Note: Average tractability can go down if state-of-the-art solvers are introduced that perform
well on novel problems but poorly on problems other solvers are good at.
! ! AI INDEX, NOVEMBER 2017
SAT Solving
view more information in appendix A17
The percentage of problems solved by competitive SAT solvers on industry-applicable
problems.
!33
! ! AI INDEX, NOVEMBER 2017
DERIVATIVE MEASURES
We can glean additional insights from the measurements in the previous sections by
examining the relationships between trends. This section demonstrates how the data
gathered by the AI Index can be used for further analysis and to spur the development
of refined and wholly original metrics.
As a case-study for this demonstration, we look at trends across academia and
industry to explore their dynamics. Further, we aggregate these metrics into a
combined AI Vibrancy Index.
Academia-Industry Dynamics
To explore the relationship between AI-related activity in academia and industry, we
first select a few representative measurements from the previous sections. In
particular, we look at AI paper publishing, combined enrollment in introductory AI and
ML courses at Stanford, and VC investments into AI-related startups.
These metrics represent quantities that cannot be compared directly: papers
published, students enrolled, and amount invested. In order to analyze the relationship
between these trends, we first normalize each measurement starting at the year 2000.
This allows us to compare how the metrics have grown instead of the absolute values
of the metrics over time.
!34
! ! AI INDEX, NOVEMBER 2017
The data shows that, initially, academic activity (publishing and enrollment) drove
steady progress. Around 2010 investors started to take note and by 2013 became the
drivers of the steep increase in total activity. Since then, academia has caught up with
the exuberance of industry.
!35
Note: The dip in enrollment for the 2016 academic year reïŹ‚ects an administrative quirk that
year, not student interest. Details in appendix A2.
! ! AI INDEX, NOVEMBER 2017
The AI Vibrancy Index
The AI Vibrancy Index aggregates the measurements from academia and industry
(publishing, enrollment and VC investment) to quantify the liveliness of AI as a field.
To compute the AI Vibrancy Index, we average normalized publishing, enrollment and
investment metrics over time.
We hope this brief investigation sparks interest in how metrics from the AI Index can
be further analyzed and creates discussion about what derived measures may be
useful to track over time.
!36
! ! AI INDEX, NOVEMBER 2017
TOWARDS HUMAN-LEVEL
PERFORMANCE?
It is natural to look for comparisons between the performance of AI systems and
humans on the same task. Obviously, computers are vastly superior to humans in
certain tasks; 1970-era hand calculators can perform arithmetic better than humans.
However, the competence of AI systems becomes more difficult to assess when
dealing with more general tasks like answering questions, playing games, and making
medical diagnoses.
Tasks for AI systems are often framed in narrow contexts for the sake of making
progress on a specific problem or application. While machines may exhibit stellar
performance on a certain task, performance may degrade dramatically if the task is
modified even slightly. For example, a human who can read Chinese characters would
likely understand Chinese speech, know something about Chinese culture and even
make good recommendations at Chinese restaurants. In contrast, very different AI
systems would be needed for each of these tasks.
Machine performance may degrade dramatically if the
original task is modified even slightly.
Despite the difficulty of comparing human and AI systems, it is interesting to
catalogue credible claims that computers have reached or exceeded human-level
performance. Still, it is important to remember that these achievements say nothing
about the ability of these systems to generalize. We also note the list below contains
many game playing achievements. Games provide a relatively simple, controlled,
experimental environment and so are often used for AI research.

!37
! ! AI INDEX, NOVEMBER 2017
Milestones
Below is a brief description of the achievements and their circumstances. Some
milestones represent significant progress towards human performance and others
represent super-human performance achievements.
Othello
In the 1980s Kai-Fu Lee and Sanjoy Mahajan developed BILL, a Bayesian
learning-based system for playing the board game Othello. In 1989 the
program won the US national tournament of computer players, and beat
the highest ranked US player, Brian Rose, 56-8. In 1997 a program named
Logistello won every game in a six game match against the reigning
Othello world champion.
Checkers
In 1952, Arthur Samuels built a series of programs that played the game of
checkers and improved via self-play. However, it was not until 1995 that a
checkers-playing program, Chinook, beat the world champion.
Chess
Some computer scientists in the 1950s predicted that a computer would
defeat the human chess champion by 1967, but it was not until 1997 that
IBM’s DeepBlue system beat chess champion Gary Kasparov. Today, chess
programs running on smartphones can play at the grandmaster level.
!38
1980
1995
1997
! ! AI INDEX, NOVEMBER 2017
Jeopardy!
In 2011, the IBM Watson computer system competed on the popular quiz-
show Jeopardy! against former winners Brad Rutter and Ken Jennings.
Watson won the first place prize of $1 million.
Atari Games
In 2015, a team at Google DeepMind used a reinforcement learning system
to learn how to play 49 Atari games. The system was able to achieve
human-level performance in a majority of the games (e.g., Breakout),
though some are still significantly out of reach (e.g., Montezuma’s
Revenge).
Object Detection in ImageNet
In 2016, the error rate of automatic labeling of ImageNet declined from
28% in 2010 to less than 3%. Human performance is about 5%.
Go
In March of 2016, the AlphaGo system developed by the Google DeepMind
team beat Lee Sedol, one of the world’s greatest Go players, 4-1.
DeepMind then released Alpha Go Master, which defeated the top ranked
player, Ke Jie, in March of 2017. In October 2017 a Nature paper detailed
yet another new version, AlphaGo Zero, which beat the original AlphaGo
system 100-0.
!39
2016
2016
2015
2011
! ! AI INDEX, NOVEMBER 2017
Skin Cancer Classification
In a 2017 Nature article, Esteva et al. describe an AI system trained on a
data set of 129,450 clinical images of 2,032 different diseases and
compare its diagnostic performance against 21 board-certified
dermatologists. They find the AI system capable of classifying skin cancer
at a level of competence comparable to the dermatologists.
Speech Recognition on Switchboard
In 2017,  Microsoft and IBM both achieved performance within close range
of “human-parity” speech recognition in the limited Switchboard domain.
Poker
In January 2017, a program from CMU called Libratus defeated four top
human players in a tournament of 120,000 games of two-player, heads up,
no-limit Texas Hold’em. In February 2017, a program from the University of
Alberta called DeepStack played a group of 11 professional players more
than 3,000 games each. DeepStack won enough poker games to prove the
statistical significance of its skill over the professionals.
Ms. Pac-Man
Maluuba, a deep learning team acquired by Microsoft, created an AI
system that learned how to reach the game’s maximum point value of
999,900 on Atari 2600.
!40
2017
2017
2017
2017
! ! AI INDEX, NOVEMBER 2017
WHAT’S MISSING?
This inaugural annual report covers a lot of ground, but certainly not all of it. Many
important areas were omitted for lack of available data, time, or both. We hope to
address the limitations below in future editions of the report.
We also believe it will take the support of the broader community to effectively engage
in this broad range of challenges, and we invite you to reach out to the AI Index if you
have ideas or relevant data for tackling these challenges.
Technical Performance
We did not cover progress in many important technical areas. For some areas there are
not clear standardized benchmarks (e.g. dialogue systems, planning, continuous
control in robotics). In other areas it is hard to measure performance when there has
not been significant progress, like in commonsense reasoning. And still, other areas
are waiting to be tracked but we simply have not had the opportunity to collect the
data (e.g. recommender systems, standardized testing).
Tracking areas that have traditionally lacked concrete measurements may also
facilitate a more sober assessment of AI progress. Progress is typically tracked
consistently when good progress has been made. As a result, this report may present
an overly optimistic picture.
Indeed, chatbot dialog falls far short of human dialog and we lack widely accepted
benchmarks for progress in this area. Similarly, while today’s AI systems have far less
common sense reasoning than that of a five-year-old child, it is unclear how to
quantify this as a technical metric. Expanding the coverage of the report may help
correct for this optimistic bias. Additionally, any effort to develop effective reporting
metrics in one of these more difficult areas may be a contribution in itself that spurs
further progress in the area.
!41
! ! AI INDEX, NOVEMBER 2017
International Coverage
This report is very US-centric, despite the significant amount of AI activity and
progress across the world. As a single example, the level of investment and activity in
China today is astounding but outside the scope of this report. While we did not have
the time or ability to collect such data for the inaugural AI Index report, future editions
of the report will need better international coverage.
Diversity & Inclusion
Those researching and deploying AI systems will play a significant role in shaping the
impact of AI on society. If we intend to contribute relevant data to discussions about
the ultimate impact of Artificial Intelligence on society, then we must quantify who
gets to participate in conversations about AI as well as measure who holds the power
to influence future AI research and deployment.
This inaugural report contains no breakdown of data by sex, race, gender, ethnicity,
sexuality or other characteristics. How many women get the opportunity to contribute
to AI research in industry?  What percentage of AI startups in the US are founded by
black men? These questions are intimately related to the power dynamics at play
within the technology and venture capital industries as well as broader systemic forces
of discrimination. No one study can frame the conversations about these complex
dynamics, but we believe an effort like the AI Index must engage in these questions to
authentically analyze the full impact of AI on our society.
Government and Corporate Investment
The venture capital investment data showcased in this report focuses solely on the US
and represents a very small sliver of total investment in AI Research & Development
(R&D).
!42
! ! AI INDEX, NOVEMBER 2017
Governments and corporations have made substantial investments in AI R&D. While
this data may be more difficult to collect, we intend to pursue data that highlights
government and corporate investments in the US and internationally. We anticipate
that it will require a highly coordinated, collaborative effort to effectively make
progress in this area.
Impact in Specific Verticals
We aspire to provide relevant metrics for conversations about AI’s impact in
healthcare, automotive, finance, education, and beyond. These areas are perhaps the
most important and most difficult to get a handle on. Relevant metrics in these areas
are difficult to identify and aggregate because they call for additional understanding of
these disparate domains. We plan to branch into these areas in collaboration with
experts in these domains and others.
Mitigating Societal Risks
Issues associated with societal risks resulting from AI are left unaddressed in this
report. In the future, we hope to provide metrics that help ground discussions of AI
safety and predictability, fairness of AI algorithms, privacy in an era of AI, ethical
implications of increased automation, and other topics.
!43
! ! AI INDEX, NOVEMBER 2017
EXPERT FORUM
By definition, every data set or index loses information and introduces unintended
biases. Our index can only paint a partial picture of the past, present, and future of AI.
To broaden this picture, we have collected the perspectives of AI experts spanning
academia, industry, government and media.
Barbara Grosz
Harvard
Mind the Gap
The first report of the AI Index is laudable not only for its rooting of the state of AI in
data and the record time in which it was produced, but also for the authors'
mindfulness about gaps in coverage.  Several missing areas would require, in one way
or another, metrics that took account not only of the performance of AI methods in a
vacuum, but also of the quality of an AI technology's interactions with people or of the
ways in which AI enabled systems affect people, both as individuals and in societies.
This particular gap is especially noteworthy in light of the recent increased attention
being given to developing AI capabilities that complement or augment people's
abilities rather than aiming to replicate human intelligence. IJCAI-16 had "human aware
AI" as a special theme, AAAI-18 has "human-AI collaboration" as an emerging theme,
and the last few years have seen many workshops and symposia on human-in-the loop
AI and on AI and society.
This gap is reflected in the section on natural language processing, which reports on
parsing, machine translation and abilities to find answers to questions in a designated
document, but does not (as it acknowledges) report on dialogue systems or chatbots.
!44
! ! AI INDEX, NOVEMBER 2017
Parsing requires no consideration of the mental state of the producer of the utterance
being parsed, and for many situations in which machine translation and question
answering have been tested it is also possible to ignore mental state and in particular
the purposes crucial to an utterance's meaning. Not so with dialogue.
As this AI Index report notes, factors can only be included in an index if there are good
ways to measure them.  Metrics that take account of the human as well as the AI
technology pose a major challenge, as anyone who has done research requiring an IRB
can attest. It is important to take on the challenge of identifying success measures for
AI algorithms and systems not simply on the basis of their efficiency or completeness,
but taking into account their impact on the people whose lives they affect.  If this first
AI Index report spurs development of such metrics, it will have made a major
contribution to AI, to computer science and to society at large.
It is important to take on the challenge of identifying
success measures for AI systems by their impact on
people's lives.
I'd also like to see future AI Index reports investigate not only AI course enrollments,
but also the numbers of AI courses that devote attention to ethical concerns that AI
raises.  (Disclosure: For the last three years, I have taught a course on "Intelligent
Systems: Design and Ethical Challenges".) As AI-enabled systems increasingly pervade
daily life, AI courses need to convey to students the importance of considering ethics
from the start of their design. Another challenge for the AI Index then is to find ways
to track such factors as the number of companies producing AI systems that have
asked whether such a system should be built, and the numbers of AI systems
designers who have considered in their design the unintended consequences that
might ensue from a particular design and how best to ameliorate them.
!45
! ! AI INDEX, NOVEMBER 2017
Eric Horvitz
Microsoft
I’m excited about the publication of the inaugural annual report of the AI Index.  The
project was spawned by the One Hundred Year Study on Artificial Intelligence (AI100)
at Stanford University, and resonates deeply with the goals of AI100 to host periodic
studies to assess and address the influences of AI advances on people and society
over a century.  AI100 was designed to establish a long-lived “connected presence”
that extends human intellect and agency about AI and its influences into the future.
 The ambitious AI Index initiative arose in discussions of the AI100 Standing
Committee in 2015.
The AI Index defines and tracks sets of metrics about AI advances over time. The first
report provides data collected about recent trends for key measures of sets of AI
competencies, AI-related activities, and an exploratory “derivative” measure.  The
measures show recent upswings on multiple fronts, many based in advances in
machine learning, and particularly variants of convolutional neural networks, fueled by
algorithmic advances, as well as the availability of large-scale data resources and
increasingly powerful computation.
I find the derivative measures section to be creative and useful, even if they provide
only coarse signals—and signals that leave room for interpretation.  The AI Vibrancy
Index attempts to capture the overall “vibrancy” of AI over time, as reflected by a
combination of measures of AI efforts and ideas in academia and industry. Such
derivative measures might be validated or calibrated (or refined) in future work by
aligning them with measures of phenomena that are closer to ground truth of goals,
such as the statistics collected on the hiring, composition, and compensation of AI
talent at corporations.
!46
! ! AI INDEX, NOVEMBER 2017
The report devotes a special section to a discussion of “human-level” performance,
and calls out several celebrated results that are relatively easy to define and track.
These include competencies with performing human-level medical diagnoses (e.g.,
diagnosing pathology from the visual analyses of tissue sections) and winning games
(e.g., Othello, checkers, chess, go, and poker).  The report also considers human-level
competencies that are more challenging to define, such as metrics for understanding
and tracking advances with commonsense reasoning—including the commonsense
understanding that is displayed by a toddler (out of reach by today’s AI technologies).
I found the report to be refreshing in its reporting on “what’s missing.”  Beyond the
expressed gaps, I expect that many people will find additional gaps, blind spots, and
deficiencies in the definitions and design choices in this first round of the AI Index.
 However, it is no small feat to move from the initial discussions about an AI index to
the concrete publication of the current indices. Beyond providing a set of interesting
findings, putting a reasonable stake in the ground with the publication of these indices
is a critical step in engaging a wider community in a dialog, aimed at refining and
extending these metrics.
Putting a reasonable stake in the ground with the
publication of these indices is a critical step in
engaging a wider community in a dialog.
Over time, we can expect to see numerous studies offering metrics on AI advances.
These include distinct deep dives (e.g., AAAI 2017) into one or more aspects of the
status and trends around AI competencies, activities, and influences. I believe that we
should celebrate multiple analyses and indices about AI; research and studies on AI
and its influences have been growing within multiple communities and we can expect
the blossoming of multiple perspectives.  Nonetheless, I see value in working to pull
!47
! ! AI INDEX, NOVEMBER 2017
together an increasingly comprehensive index that can serve as a focal point for
contributions and a “shared lens” for tracking and understanding advances in AI.
The publication of the first instance of the AI Index provides a set of interesting
insights about recent trends with AI advances. The commitment to continuing the
analyses going forward is exciting—and stimulates the imagination about points and
trend lines that will appear on charts as time extends into the future.
!48
! ! AI INDEX, NOVEMBER 2017
Kai-Fu Lee
Sinovation Ventures
State of AI in China
The AI Index is an important effort to ground the discussion of AI. There are many
important statistics in the inaugural report to understand current development of AI,
primarily for the US market. For now, let me fill the gap by adding this commentary
about the state of AI in China.
"There's no data like more data."  More data makes AI smarter. So, how much data is
China generating?
China has the most mobile phones and Internet users in the world, which is about
three times more than that in the US or India. Many think that the gap between the US
and China is just a factor of three. It is dramatically larger than that. In China, people
use their mobile phones to pay for goods, 50 times more often than Americans. Food
delivery volume in China is 10 times more than that of the US. It took bike-sharing
company Mobike 10 months to go from nothing to 20 million orders (or rides) per day.
There are over 20 million bicycle rides transmitting their GPS and other sensor
information up to the server, creating 20 terabytes of data everyday. Similarly, China’s
ride-hailing operator Didi is reported to connect its data with traffic control in some
pilot cities. All of these Internet connected things will yield data that helps make
existing products and applications more efficient, and enable new applications we
never thought of.
What about the quality of China's AI products? Many probably still remember the days
when China was nothing but copycats around 15 years ago. Smart and eager Chinese
tech giants and entrepreneurs have morphed by western innovations to exceed their
overseas counterparts. An example in AI, Chinese face recognition startup Face++
!49
! ! AI INDEX, NOVEMBER 2017
recently won first place in 3 computer vision challenges, ahead of teams from Google,
Microsoft, Facebook, and CMU.
China's State Council announced a straightforward
plan to become the AI innovation hub by 2030.
Chinese government is open-minded with technology development. The environment
in China is more conducive for fast launch and iteration. In July 2017, China’s State
Council announced “Next Generation Artificial Intelligence Development Plan” with
straightforward goal to become a global AI innovation hub by 2030. The plan is
expected to promote AI as a high priority among major industries and provincial
governments. If you think this is all talk, China's policies are actually very well
executed as demonstrated with past plans such as high-speed rail, and the mass
entrepreneurship and innovation movement. We can expect similar trajectory for its AI
policies.
The pro-tech, pro experimentation, and pro speed attributes put China in a position to
become a very strong AI power. In this age of AI, I predict that the United States-China
duopoly is not only inevitable. It has already arrived.
!50
! ! AI INDEX, NOVEMBER 2017
Alan Mackworth
University of British Columbia
The AI Index, in its Alpha version, is a great start, and already a useful tool for
measuring AI progress. Most of my comments come in the form of a wish list for
expanding and restructuring the coverage. Many of the sources for the data I would
like to see added are hard to come by. But it is important not to fall for the streetlight
fallacy: looking for the keys under the light rather than where they are likely to be. The
data that are easy to get may not be the most informative.
The data that are easy to get may not be the most
informative.
The most obvious weakness is how US-centric most of the data is. But the US data is
the low hanging fruit. Hopefully the international AI community will help by
crowdsourcing to fill in holes. EU and Canadian statistics may be the next easiest to
get: for example, enrollment numbers for AI/ML introductory courses. EU funding for
AI research and startups should be trackable. The data for Asia, China in particular,
would be very significant; some of it is available.
Noticing the lack of data source diversity brings to mind the lack of measures of
geographical and gender diversity of AI researchers and practitioners.
Under the Volume of Activity heading, along with Academia and Industry, Government
should be added as a major subheading, with, for example, data on grant funding for AI
research. Is there a way to measure regulatory activity and governance studies? Those
activities are certainly ramping up but are they measurable in a meaningful way?
!51
! ! AI INDEX, NOVEMBER 2017
Consider also adding an NGO category for the burgeoning number of organizations
like AI2, OpenAI, WEF, and the Turing Institute.
On the Academia front, it should be possible to get data on a) Talent supply from
academia e.g. the number of M.Sc./Ph.D. AI/ML theses produced each year. Along with
the ratio of #AI/#CS theses and b) Talent demand by academia e.g. the number of
academic positions available that specify AI/ML (perhaps CRA job ads for postdocs
and faculty). And the ratio of #AI/#CS positions.
Two very popular indices would be AI salary measures in industry and academia.
Headhunters, consultants and the CRA could help. Tricky to get reliable data but, at
the moment, we really only have gossip and anecdotes in NYT stories.
Putting Published Papers and Conference Attendance under Academia is a
misclassification since Industry research is strong. Much of the Volume of Activity is
independent of the Academia/Industry/Government/NGO split and should be lifted
out. Additional useful measures would include conference paper submissions and AI
books published/year, e.g. Amazon category.
In terms of Technical Performance measures, progress on AI solving of Captchas could
be a good metric. In the list of areas missing for Technological Advances, one
important missing area not listed is Multi-Agent Systems (MAS). Two MAS activities
that could be good candidates for metrics are RoboCup, with its 2050 target, and the
Trading Agent Competitions (TACs). Some would argue that the Turing Test, with the
Loebner Prize, would be a source of a good metric. It would be worth a brief discussion
of why that is a good/bad idea. Indeed, some more meta-comments about the criteria
for including indices would be useful. For those important activities that are (so far)
hard to quantify, is it worth mentioning them just so that they are not overlooked?
Finally, how about measures of meta-AI activity? It’s not clear how to quantify it but
there is clearly an exponential growth of meta-AI institutes, organizations,
partnerships, think tanks, and indices (like this one) concerned with studying AI itself,
!52
! ! AI INDEX, NOVEMBER 2017
measuring AI, forecasting the impact of AI on society, employment, the economy, the
law, government and the city. Can we quantify and forecast the growth and outcomes
of meta-AI? Maybe there’s a joke in there somewhere about the meta-AI Singularity?
!53
! ! AI INDEX, NOVEMBER 2017
Andrew Ng
Coursera, Stanford
AI is the new electricity
AI is the new electricity, and is transforming multiple industries. The AI Index will help
current generations track and navigate this societal transformation. It will also help
future generations look back and understand the AI's rise.
AI is a global phenomenon
Further, AI is now a global phenomenon, and the AI Index reminds each of us we have
to look beyond our own borders to understand global progress. The US and China are
enjoying the greatest investments as well as the most rapid adoption, and Canada and
UK also making groundbreaking research contributions. Since AI changes the
foundation of many technology systems – everything ranging from web search, to
autonomous driving, to customer service chatbots – it also gives many countries an
opportunity to 'leapfrog" the incumbents in some application areas. Countries with
more sensible AI policies will advance more rapidly, and those with poorly thought out
policies will risk being left behind.
Countries with more sensible AI policies will
advance more rapidly, and those with poorly
thought out policies will risk being left behind.
!54
! ! AI INDEX, NOVEMBER 2017
Deep Learning transformation of AI sub-fields
Deep Learning first transformed speech recognition, then computer vision. Today, NLP
and Robotics are also undergoing similar revolutions. The recent improvements in
speech and vision accuracy have led to a flourishing of applications using speech
(such as voice controlled speakers) or computer vision (such as autonomous cars).
Today, NLP's deep learning transformation is well underway; this will lead to a
flourishing of new applications (such as chatbots). Deep Learning in robotics is also
gaining significant momentum, and this too will lead to many new applications (such
as new manufacturing capabilities).
!55
! ! AI INDEX, NOVEMBER 2017
Daniela Rus
Massachusetts Institute of Technology
AI, a Vector for Positive Change
Our world has been changing rapidly. Today, telepresence enables students to meet
with tutors, and doctors to treat patients thousands of miles away. Robots help with
packing on factory floors. Networked sensors enable monitoring of facilities, and 3D
printing creates customized goods. We are surrounded by a world of possibilities.
These possibilities will only get larger as we start to imagine what we can do with
advances in artificial intelligence and robotics.
On a global scale, AI will help us generate better insights into addressing some of our
biggest challenges: understanding climate change by collecting and analyzing data
from vast wireless sensor networks that monitor the oceans, the greenhouse climate,
and the plant condition; improving governance by data-driven decision making;
eliminating hunger by monitoring, matching and re-routing supply and demand, and
predicting and responding to natural disasters using cyber-physical sensors.  It will
help us democratize education through MOOC offerings that are adaptive to student
progress, and ensure that every child gets access to the skills needed to get a good
job and build a great life. It may even help those kids turn their childhood dreams into
reality, as Iron Man stops being a comic book character and becomes a technological
possibility.
AI will help us generate better insights into
addressing some of our biggest challenges.
!56
! ! AI INDEX, NOVEMBER 2017
On a local scale, AI will offer opportunities to make our lives safer, more convenient,
and more satisfying. That means automated cars that can drive us to and from work,
or prevent life-threatening accidents when our teenagers are at the wheel. It means
customized healthcare, built using knowledge gleaned from enormous amounts of
data. And counter to common knowledge, it means more satisfying jobs, not less, as
the productivity gains from AI and robotics free us up from monotonous tasks and let
us focus on the creative, social, and high-end tasks that computers are incapable of.
All these things –– and so much more! –– become possible when we direct the power
of computing to problems that humans are not able to solve without support from
machines. Advances are happening in three different and overlapping fields: robotics,
machine learning, and artificial intelligence. Robotics puts computing into motion and
gives machines autonomy. AI adds intelligence, giving machines the ability to reason.
Machine learning cuts across both robotics and AI, and enables machines to learn,
improve, and make predictions.  Progress is being made quickly in each of these fields.
The AI index introduces several metrics to keep track of this progress. The metrics
provide an important quantitative view on the state of education, research, and
innovation in the field and provide insight into general trends.
While AI has the potential to be a vector for incredible positive change, it is important
to understand what today’s state of the art is: what today’s methods can and cannot
do. The AI index is defining intelligence tasks and measuring the performance of the
most advanced AI systems for those tasks. It also provides a framework for education
in AI and for grand challenges in AI.
AI can be a vector for incredible positive change; it is
important to understand what today’s methods can
and cannot do.
!57
! ! AI INDEX, NOVEMBER 2017
The intelligence problem, how the brain produces intelligent behavior and how
machines can replicate it, remains a profound challenge in science and engineering,
that requires well trained researchers and sustained long-term research and
innovation to solve. The AI index is tracking this progress.
!58
! ! AI INDEX, NOVEMBER 2017
Megan Smith Susan Alzner
3rd CTO of the USA, shift7 UN Non-Governmental Liaison Service
AI Index - Accelerate Our Progress on What’s Missing
The goals outlined for this new annual report are important. Specifically the AI Index
“...aims to facilitate an informed conversation about AI that is grounded in data” –– to
share and support emerging context for the urgent multi-party conversation we need
to be having within and across almost all communities globally.  This team is valiantly
taking on responsibility to help support collaborative work on filling in voids in context
and shared visibility that most people globally are experiencing. It notes “...without the
relevant data for reasoning about the state of AI technology, we are essentially “flying
blind” in our conversations and decision-making related to AI.” This ‘flying blind’ is
especially true for people who are not working directly in this field today, particularly
those who do not have a computer science or other related technical background –
the vast majority of humanity.
Diversity and Inclusion are paramount. We are
missing the humanity due to bias, discriminatory
cultural patterns, and learned behavior of systemic
exclusion.
The report includes a critical open section called “What’s Missing,” acknowledging
there are many issues still to address (or even begin to consider or prioritize). Among
these, diversity and inclusion are paramount. We are missing the majority of humanity
from both the conversation and design teams due to massive conscious and
!59
! ! AI INDEX, NOVEMBER 2017
unconscious bias, significant discriminatory cultural patterns, and learned behavior of
systemic exclusion in almost all communities and in all forms of our media.  The impact
of these emerging data-enabled AI/ML technologies on all people, and all life globally,
is already significant, and we will see massive transformation across decades – with
profound shifts even in the next few years. It is urgent that we rapidly and radically
improve diversity and inclusion in all dimensions and at all levels in the technology
sector, in dialogues and amongst decisions makers about technologies, and in
applications of technology to all sectors.
The report shares that “the field of AI is still evolving rapidly and even experts have a
hard time understanding and tracking progress across the field.” We thank the teams
and individuals across the world who are stepping up to build useful open forums and
tools like this nascent index to welcome and engage far more people into a productive
conversation.  
Here are a few initial selected inputs for consideration:
Future of AI 2016 - White House OSTP
As part of beginning broad engagement on the topic of AI/ML, President Obama
requested the Office of Science and Technology Policy (OSTP)  based U.S. CTO team
to collaboratively champion a series of town hall conversations with other leaders
including within government including the NSTC; these took place during the summer
of 2016.  Information about those co-hosted open gatherings and subsequent report
launched during the White House Frontiers Conference in October 2016, which
included an AI national track.
‱ Preparing for the Future of Artificial Intelligence - workshops and interagency
working group to learn more about benefits and risks of artificial intelligence.
May 3 2016 BY ED FELTEN
‱ The Administration’s Report on the Future of Artificial Intelligence  - focuses on
the opportunities, considerations, and challenges of Artificial Intelligence (AI).
October 12, 2016 BY ED FELTEN AND TERAH LYONS
!60
! ! AI INDEX, NOVEMBER 2017
Imperative: Broadening Participation and Applications, Training
Integration of Ethics and Values
We are in a deeply transformative time – where the Internet is just us, connected – and
data is being  integrated now more than ever. Change is accelerating with AI/machine
learning playing a larger role – data science, big data, AI/ML and emergent intelligence
of communities connected are so significant. How do we avoid bad outcomes, whether
‘the robot apocalypse’ or massive destructive situations that Stephen Hawking, Elon
Musk and others are urgently talking about, or just the squandering of the tremendous
opportunities that AI/ML provides for improving human life (e.g. poverty, equality,
hunger, justice, counteract bias, etc); we could help solve these challenges if we more
rapidly broadened the scope of focus topics for AI application and added participation
from so many more people in these sectors. Either way, we need to integrate our
shared values into these systems and expand the surface area of creativity engaged as
soon as possible. Consider this: do we really want to train all of this technology using
just the data sets that share what we do? We do good things but humanity does some
pretty bad things too.  This technology gets weaponized just as it gets used for good.
Today, technology is neither good nor bad, it’s just what gets designed in and what we
do with it, including unintended applications, bias, and malicious iterations.
So many more of us have to become much more “woke” about the fact that this shift is
happening rapidly, scrub ourselves in, have the hard conversations about ethics, and
move to take action. We need to have discussions about weaponized AI and explore
controls and other options we can put into place. Let’s try for what we wish could be
true, let's engage. And even then, Diane Von Furstenberg and Elon talk about us being
the ‘pets’ for the future AI.
There are some important documents on these topics - especially United Nations and
other texts which share globally agreed values, including:
‱ 2030 Agenda for Sustainable Development & SDGs
!61
! ! AI INDEX, NOVEMBER 2017
‱ Universal Declaration of Human Rights
‱ Declaration on Rights of Indigenous Peoples
‱ Beijing Declaration and Platform for Action on women’s human rights
‱ Convention on the Rights of Persons with Disabilities
‱ International Covenant on Economic, Social and Cultural Rights
‱ IEEE Ethically Aligned Design General Principles - esp Principle 1 on Human
Benefit lists (p16)
At MIT’s Commencement June 2017 Tim Cook, CEO of Apple Computer, said:
“I’m not worried about artificial intelligence giving computers the ability to think like
humans. I’m more concerned about people thinking like computers without values or
compassion, without concern for consequences. That is what we need you to help us
guard against. Because if science is a search in the darkness, then the humanities are
a candle that shows us where we’ve been and the danger that lies ahead. As Steve
[Jobs] once said, technology alone is not enough. It is technology married with the
liberal arts married with the humanities that make our hearts sing. When you keep
people at the center of what you do, it can have an enormous impact.”
We need to be broadly aware of leadership work by organizations, associations and
individuals collaborating to take action - for example:
‱ The Algorithmic Justice League (www.ajlunited.org/), which highlights
algorithmic bias, provides space for people to voice concerns and experiences
with coded bias, and develops practices for accountability.
‱ The petition to the UN urging rapid action on weaponized AI to compel us to
globally engage asap on this topic.
‱ The Computer Science for All Movement (CSforAll - csforallconsortium.org/) for
tech inclusion in the U.S. and in other countries.
‱ The AI4All initiative (ai-4-all.org/), to train a new and more diverse generation of
future AI technologists, thinkers, and leaders.
!62
! ! AI INDEX, NOVEMBER 2017
‱ Work to capacity-build sectors that are not yet using much AI/ML to advance
solutions - so that any topic of need might leverage this technology for positive
impact.
‱ Work to add technical people with expertise on these topics into organizations
that have not traditionally included people with such capability (Including “TQ”
– tech quotient in the every room – e.g. for governments “TQ in Public Policy”
The first version of this AI Index launching today is nascent, incomplete, most likely
naive in ways we don’t even understand yet, and what’s great is it’s a start – using an
open collaborative approach – on a long journey ahead where we can not see our
varied future destinations. Recently Cathy O’Neil, author of the book “Weapons of
Math Destruction,” wrote an op-ed “The Ivory Tower Can’t Keep Ignoring Tech” (New
York Times Nov 14, 2017) urging academics from all sectors to engage. We agree, and
also invite and hope everyone, especially youth, will opt-into this conversation ––
because most importantly, the AI Index includes an invitation to us all.
The first version of this AI Index is nascent,
incomplete, most likely naive in ways we don’t even
understand yet, and what’s great is it’s a start.
!63
! ! AI INDEX, NOVEMBER 2017
Sebastian Thrun
Stanford, Udacity
The importance of recent progress in Artificial Intelligence cannot be overstated. The
field of AI has been around for more than 60 years, and it has had significant impact.
AI is at the core of Google's search algorithms, Amazon's site design and Netflix's
movie recommendations. But the advent of powerful computers paired with data set of
unprecedented scale will be a game changer for society.
In just the past few years, systems have been developed that rival or even outperform
highly skilled people. Deep Mind's AlphaGo beats the world's best go players. In our
own lab, we found that AI systems can diagnose skin cancer in images more accurately
than some of the best board-certified dermatologists. I have long maintained that the
Google self-driving car drives better than average drivers like myself. And the team is
now operating these cars on public roads without the need of a safety driver. And
Cresta, a start-up company, has shown that AI systems teamed with human specialists
can double the efficacy of online sales teams.
I believe that in the not-so-distant future, AI will be able to free us from repetitive
work. AI systems will be able to watch human experts at work, and gradually acquire
the skills we bring to bear in our daily work. As this happens, more and more repetitive
work will be done by the machines, freeing us up to pursue more creative work.
This revolution has a parallel in history. Prior to the invention of the steam engine,
most of us were farmers. Most people were defined through their physical strength
and agility (and not the brilliance of their minds), performing highly repetitive work in
the fields. But machines have turned farmers into super-humans. According to
FarmersFeedUS.org, one American farmer feeds 155 people. As a result, less than 2% of
the US population works in agriculture. This has freed up 98% of us to find different
jobs. About 75% of the US labor force works in offices. We have become lawyers,
!64
! ! AI INDEX, NOVEMBER 2017
accountants, doctors, software engineers. Most of our work is highly repetitive. It is
conceivable that today's AI technology can learn the patterns in our repetitive work,
and help us do this work faster. Eventually we will all become super-human, aided by
AI to organize our lives and our understanding of the world.
Is this good or is this bad? I predict history will look back as a massive advancement of
humanity. As many of us stopped engaging in repetitive physical labor, we became
more educated, we became more inventive. With this new revolution, I predict we will
enter an era of unprecedented human creativity.
With this new revolution, I predict we will enter an
era of unprecedented human creativity.
But it also pushes burdens on people. It has been estimated that one ninth of jobs are
in jeopardy if self-driving taxis become the dominant method of daily transportation.
To stay ahead of those changes, we have to become lifelong learners. We have to
acquire new skill sets and learn to master new technologies. As a society, we need to
find new ways to help all of us adapt to those changes.
This report is important. It diligently investigates the recent advances in AI, and
documents its effect on society. I applaud the authors for putting together such a
carefully researched report. I hope this report will constructively contribute to the
much needed public discussion on AI. If we master this challenge, if we are prepared,
and if we lead, the future will be amazing. For all of us.
!65
! ! AI INDEX, NOVEMBER 2017
Michael Wooldridge
Oxford
The AI Index report makes for fascinating reading, from my perspective as an AI
researcher, as Head of Department of Computer Science at the University of Oxford,
and also as someone has served as president of the International Joint Conference on
AI (http://www.ijcai.org/), and as president of the European Association for AI (http://
www.eurai.org/). The report presents compelling and comprehensive evidence that on
a range of fronts, AI techniques are making steady progress on core problems that
have been associated with AI since its earliest days (game playing, machine
translation, theorem proving, question answering, and so on); in many of these, AI is
already at or above the accepted level of human expertise. The report also provides
pretty clear evidence – as if evidence were really needed – that AI is attracting the
attention of students and industry, with admissions exploding on AI courses, and a
huge growth in AI startup companies.
There is, clearly, an AI bubble at present; the question that this report raises for me is
whether this bubble will burst (cf. the dot com boom of 1996-2001), or gently deflate;
and when this happens, what will be left behind? My great fear is that we will see
another AI winter, prompted by disillusion following the massive speculative
investment that we are witnessing right now. There are plenty of charlatans and snake
oil salesmen out there, who are quite happy to sell whatever they happen to be doing
as AI, and it is a source of great personal frustration that the press are happy to give
airtime to views on AI that I consider to be ill-informed at best, lunatic fringe at worst
(for a good recent example, see: http://tinyurl.com/y9g74kkr).
However, while I think some deflation of the current bubble is inevitable within the
next few years, I think there is cause for hope that it will be a dignified and gentle
deflation, rather than a spectacular bust. The main reason for this is that, as the AI
Index clearly demonstrates, AI is delivering on competence. Across a wide spectrum of
!66
! ! AI INDEX, NOVEMBER 2017
tasks, AI systems are showing steadily (sometimes rapidly) increasing performance,
and these capabilities are being deployed with great success in many different
application areas. To put it another way, I think there is substance underneath the
current AI bubble, and major companies now understand how to use AI techniques
productively. Because there is demonstrable substance, and demonstrable (in the
scientific sense) progress, I don’t believe we will see the backlash associated with the
AI winter and the end of the expert systems boom. (I look forward to reading the AI
Index report for 2027, to see how this prediction pans out).
I think there is substance underneath the current AI
bubble.
There is one aspect of AI which is not reflected in the “technical performance” section
of the AI Index report, and for entirely understandable reasons. That is progress
towards general AI. The main reason general AI is not captured in the report is that
neither I nor anyone else would know how to measure progress. The closest in the
report currently is question answering, which could be understood as demonstrating
comprehension of a kind, but that is not quite general AI. I don’t think the Turing test is
an appropriate measure of general AI, however influential and ingenious it is, for
reasons that will be well-known to an AI audience. So how might we test progress
towards general AI? This seems particularly important if only to address or dispel fears
about a sudden possible rise in general AI competence – fears which still seem to
preoccupy much of the press and presumably many of the lay public.
!67
! ! AI INDEX, NOVEMBER 2017
GET INVOLVED!
We believe initiatives to understand the progress or impact of AI technologies cannot
succeed without engaging a diverse community.
No initiative to understand the impact of AI technologies
can succeed without engaging a diverse community.
There are many ways, large and small, that you can support the AI Index and we would
love to get you involved.
Share Feedback on the AI Index 2017 Report
We want to hear your perspective on the data in this report, what you feel we are
missing, and what opportunities you think we should take advantage of when
collecting about communicating about data related to AI. Feel free to write us a
thorough review over email or your quick take on Twitter at @indexingai.
Open Up Your Data
Reach out to us if you or your organization have the ability to share relevant data. We
partnered with a large set of organizations to generate this report and strong
partnerships will continue to be a cornerstone of the AI Index’s operating model going
forward.
Provide Domain Knowledge
Future iterations of the AI Index report will quantify how AI impacts specific verticals,
such as healthcare, transportation, agriculture etc. We must work with professionals
across industries to accomplish this. If you or an organization you know of might be a
resource in tracking the impact of AI in specific areas, please get in touch with us.
!68
! ! AI INDEX, NOVEMBER 2017
Correct Us
We want to keep the information we provide as accurate as possible. Still, we collected
data from a wide variety of sources and may have made mistakes in our aggregation
process. Let us know if you see any errors and we will update the version of this PDF
and any information on our website.
Support Data Collection for the AI Index
There will always be more data about AI than we can collect and organize. We would
love to work with you to collect the information that is most important.
If you know of a useful data source we have missed or a metric we should be tracking,
send us a quick message to put us on the right track.
Help Us Go International
We have already begun working with international partners to collect data that goes
beyond the United States. If you have relevant international data we would love to hear
from you.
Get in Touch!
Did any of the findings in this report surprise you? Is there something you can’t believe
we left out? Reach out to us on Twitter @indexingai or contact us at
feedback@aiindex.org.
Lastly, to get periodic updates about the AI Index and about the current state of AI,
please subscribe for email updates at aiindex.org.
!69
! ! AI INDEX, NOVEMBER 2017
ACKNOWLEDGEMENTS
The AI Index is indebted to the One Hundred Year Study on AI at Stanford University
(AI100), which incubated and provided seed funding for launching the Index. We were
also graciously supported in various ways by the following individuals at Stanford:
Tom Abate, Amy Adams, Russ Altman, Tiffany Murray, Andrew Myers.
We also gratefully acknowledge the additional startup funds provided by Google,
Microsoft and Bytedance (Toutiao). However, the AI Index is an independent effort and
does not necessarily reflect the views of these organizations.
In this startup phase the AI Index has benefitted from the wisdom and advice of its
advisory committee, whose members include:
Michael Bowling, Ernie Davis, Julia Hirschberg, Eric Horvitz, Karen Levy, Alan
Mackworth, Tom Mitchell, Sandy Pentland, Chris RĂ©, Daniela Rus, Sebastian Thrun, Hal
Varian, and Toby Walsh.
We are also indebted to the Expert Forum contributors, some of whom are on our
advisory committee listed above, whose contributions to this report and to the
ongoing discussions of the place of AI in society are invaluable:
Susan Alzner, Barbara Grosz, Eric Horvitz, Kai-Fu Lee, Alan Mackworth, Andrew Ng,
Daniela Rus, Megan Smith, Sebastian Thrun, Michael Wooldridge.
We also appreciate the advice and support we received from the following individuals:
Toby Boyd, Kevin Leyton-Brown, Miles Brundage, AJ Bruno, Jeff Dean, Catherine Dong,
Peter Eckersley, Stefano Ermon, Oren Etzioni, Carl Germann, Marie Hagman, Laura
Hegarty, Holger Hoose, Anita Huang, Dan Jurafsky, Kevin Knight, Jure Leskovec, Tim
Li, Terah Lyons, Mariano Mamertino, Christopher Manning, Gary Marcus, Dewey
!70
! ! AI INDEX, NOVEMBER 2017
Murdick, Lynne Parker, Daniel Rock, Amy Sandjideh, Skyler Schain, Geoff Sutcliffe,
Fabian Westerheide, Susan Woodward.
And the various organizations these individuals represented that provided data for the
inaugural report:
Allen Institute for Artificial Intelligence, Crunchbase, Electronic Frontier Foundation,
Elsevier, EuroMatrix, Google Brain, Indeed.com, Monster.com, Sand Hill Econometrics,
Sinovation Ventures, TrendKite, VentureSource.
We thank the following individuals for their help in acquiring conference attendance
data:
Chitta Baral, Maria Gini, Carol Hamilton, Kathryn B. Laskey, George Lee, Andrew
McCallum, Laurent Michel, Mary Ellen Perry, Claude-Guy Quimper, Priscilla Rasmussen,
Vesna Sabljakovic-Fritz, Terry Sejnowski, Brian Williams, Ramin Zabih.
And we thank the following individuals for their help in acquiring course enrollment
data:
Lance Fortnow, Charles Isbell, Leslie Kaelbling, Steven Lavalle, Dan Klein, Lenny Pitt,
Mehran Saham, Tuomas Sandholm, Michael-David Sasson, Manuela Veloso, Dan Weld.
We could not have created this report without the contributions, large and small, of all
the individuals on this list. We thank them and hope to continue engaging a large
community as we work to ground conversations about Artificial Intelligence.
!71
! ! AI INDEX, NOVEMBER 2017
APPENDIX A: DATA DESCRIPTION &
COLLECTION METHODOLOGY
A1. Published Papers
return to published papers section
Primary Sources & Data Sets
Elsevier’s Scopus database of academic publications, which has indexed almost 70
million documents (69,794,685).
See more information about Scopus.
Definition of Collected Data
The number of academic papers published each year that have been indexed by the
Scopus catalog in the subject area “Computer Science” and have been indexed with
the key term “Artificial Intelligence”. For reference:
‱ The entire Scopus database contains over 200,000 (200,237) papers in the field
of Computer Science that have been indexed with the key term “Artificial
Intelligence”.
‱ The Scopus database contains almost 5 million (4,868,421) papers in the subject
area “Computer Science”.‹
Both numbers cited above, as well as the number of total publications in the Scopus
database, were recorded November 2017.
Data Collection Process
We made queries to the Scopus database of published academic papers to count the
number of AI-related papers, the number of papers in the Computer Science subject
!72
! ! AI INDEX, NOVEMBER 2017
area, and the number of papers in the total database. For example, the queries used to
obtain the count of the relevant papers for the year 2000 are:
AI query
title-abs-key(artificial intelligence)
AND SUBJAREA(COMP)
AND PUBYEAR AFT 1999
AND PUBYEAR BEF 2001
CS query
SUBJAREA(COMP)
AND PUBYEAR AFT 1999
AND PUBYEAR BEF 2001
All Scopus query
PUBYEAR AFT 1999 AND PUBYEAR BEF 2001
Queries were made for each year from 1996 to 2016.
Elsevier also provided access to the Scopus API to automate the process of extracting
data from Scopus.
For more information about fields in Scopus’ query language, see Scopus Field
Specification.
For more information about Elsevier’s APIs, see the Elsevier API documentation.
For more information about the Scopus search API, see the search API documentation.
Nuances
The Scopus system is retroactively updated. As a result, the number of papers the
Scopus system returns for a given query may increase over time. For example, the
query “SUBJAREA (COMP) AND PUBYEAR BEF 2000” may return a larger and
larger number of papers over time as Scopus’ coverage grows more comprehensive.
!73
! ! AI INDEX, NOVEMBER 2017
Members of the Elsevier team commented that data about papers published after 1995
would be the most reliable and that their system’s data processing was more
standardized after this date. For this reason, we only collect data on papers published
in 1996 or later from the Scopus source.
Scopus captures a wide range of sources. Their indexing technique and query
language also makes it easy to identify papers related to a particular topic. Other
viable sources of data about published papers include Web of Knowledge, Microsoft
Academic, DBLP, CiteSeerX and Google Scholar. While the total number of papers and
the specific sources captured differs for each system, we expect that the trend in
paper publishing growth should remain mostly constant across databases.
!74
! ! AI INDEX, NOVEMBER 2017
A2. Course Enrollment
return to course enrollment section
Primary Sources & Data Sets
University enrollment records. Enrollment data was collected from the following
universities:
University of California Berkeley, Carnegie Mellon University, Georgia Institute of
Technology, University of Illinois Urbana Champaign, Massachusetts Institute of
Technology, Stanford, and University of Washington.
Definition of Collected Data
The number of students enrolled in representative undergraduate AI and ML courses
at a selection of universities for each academic year. The “academic year” begins with
Fall of that year.
Collection Process
We reached out to representatives at each university who facilitated the identification
of AI & ML courses and the collection of enrollment data from school records.
Nuances
Intro AI & ML courses were selected, despite many universities’ additional course
offerings beyond introductory classes. These courses are more consistent across
universities and easy to distinguish.
Many universities had more demand from students to take the introductory AI & ML
courses than they could support. Our data only represents what universities were able
to provide.
!75
! ! AI INDEX, NOVEMBER 2017
Some of the particularly strong upticks and downticks between given years are a
result of administrative quirks, not student interest. For example, our contact at
Stanford explained the downtick in ML course enrollment between 2015 and 2016 as
follows:
“The ML class is usually only taught once per year.  But in 2015-16 it was taught twice
(once in Fall and once in Spring).  The Spring quarter offering wasn’t listed until after
Fall quarter enrollment had already occurred.  So, I’d imagine (based on intuition, not
hard data) that the Spring offering in 2015-16 siphoned some of the students who
would have otherwise taken it in Fall 2016-17, leading to a lower enrollment in Fall
2016-17.  So, really there should be some smoothing going on in the enrollments
between 2015-16 and 2016-17.  I don’t believe there was actually a real decline in
interest in the ML course.”
!76
! ! AI INDEX, NOVEMBER 2017
A3. Conference Attendance
return to conference attendance section
Primary Sources & Data Sets
The records of organizations that host AI-related conferences. Data was collected for
the following conferences:
AAAI, AAMAS, ACL, CP, CVPR, ECAI, ICAPS, ICRA, ICLR, ICML, IJCAI, IROS, KR, NIPS,
UAI.
Definition of Collected Data
The number of attendees present at a selection of academic conferences related to
artificial intelligence and its subfields. We defined “large conferences” to be those with
more than 1000 attendees in 2016. “Small conferences” are defined as those with less
than 1000 attendees in 2016.
Data Collection Process
The AI Index team worked with conference organizers and the leaders of sponsoring
organizations to collect attendance data for each conference.
Nuances of Data
Not all conference organizing teams had all attendance data accessible. Many of the
leadership teams noted that attendance data was missing for some years and some
could only report approximations. From our review, it seems appropriate to accept the
estimates provided by the various leadership teams as accurate.
Not all conferences are run annually, and some conferences have skipped years.

!77
! ! AI INDEX, NOVEMBER 2017
A4. AI-Related Startups
return to AI-related startups section
Primary Sources & Data Sets
Crunchbase
VentureSource, the comprehensive database of venture backed companies
Sand Hill Econometrics, a provider of indices for venture backed private companies
Definition of Collected Data
The number of active startups each year identified as developing or deploying AI
systems.
Data Collection Process
We first collected a list of all organizations with an AI-related category label in
Crunchbase. To obtain the set of category labels we reviewed the set of all categories
in Crunchbase and chose a set we felt captured areas of AI technology, listed below.
We obtained the category labels and the list of organizations through the Crunchbase
API, provided to us by Crunchbase.
This list of organizations from Crunchbase was then cross-referenced with the list of
all venture-backed companies in the VentureSource database. Any venture backed
companies from the Crunchbase list that were identified in the VentureSource
database were included. VentureSource also associates keywords with each company.
Any company with “AI” or “Machine Learning” in the VentureSource keywords was also
included in the set of relevant startups.
See more about the Crunchbase API here.
See a list of Crunchbase Categories here.
!78
! ! AI INDEX, NOVEMBER 2017
All interaction with the VentureSource product was conducted by Sand Hill
Econometrics.
Nuance
List of Crunchbase “category” labels used to identify AI companies:
Artificial Intelligence, Machine Learning, Natural Language Processing, Computer
Vision, Facial Recognition, Image Recognition, Speech Recognition, Semantic Search,
Semantic Web, Text Analytics, Virtual Assistant, Visual Search, Predictive Analytics,
Intelligent System.
Determining which companies are “AI related” has no simple answer. Our heuristics
currently favor machine learning technologies.
!79
! ! AI INDEX, NOVEMBER 2017
A5. AI-Related Startup Funding
return to AI-related startup funding section
Primary Sources & Data Sets
Crunchbase
VentureSource, the comprehensive database of venture backed companies
Sand Hill Econometrics, the premier provider of indices for venture backed private
companies
Definition of Collected Data
The data displayed is the amount of funding invested each year by venture capitalists
into startups where AI plays an important role in some key function of the business.
Data Collection Process
The set of companies for the AI-Related Startups section was used (see description).
The investment data about this set of companies was then retrieved from
VentureSource and aggregated to provide yearly funding data.
All interaction with the VentureSource product was conducted by Sand Hill
Econometrics.
!80
! ! AI INDEX, NOVEMBER 2017
A6. Job Openings
return to job openings section
Primary Sources & Data Sets
Indeed.com
Monster.com
Definition of Collected Data
The Indeed.com data represents the share of jobs in each country that require AI skill,
normalized to the share percentage in January 2013.
The Monster.com data represents the absolute number of AI related job openings over
time, broken down by jobs that require specific skills in AI subfields. Note that the jobs
in the breakdown may overlap. For example, a job requiring Machine Learning skills
could also require Natural Language Processing skills. This job would be double
counted in the breakdown graph.
Data Collection Process
We worked with the Indeed and Monster teams directly to obtain this data. Indeed.com
and Monster used different processes for identifying AI jobs and provided different
kinds of data about AI job growth data.
Indeed.com first identified a range of job titles that had AI-related keywords in the
associated job listing more than 50% of the time. The keywords used:
Artificial Intelligence, Machine Learning, Natural Language Processing.
Natural Language Processing was found to be associated with over 90% of job titles
that had the other AI keywords in the description. Once these job titles were obtained,
Indeed looked at, for each country, what percentage of total jobs were AI-related in
!81
! ! AI INDEX, NOVEMBER 2017
that country. They tracked this percentage over time and returned the data to us,
normalized starting at the  value in 2013.
Using data provided by CEB's TalentNeuron tool, Monster identified the number of job
postings in the U.S. that included "artificial intelligence" as a required skill for 2015,
2016, and YTD 2017 (through Nov 10). To create the breakdown, the same tool was
used for skills requiring “artificial intelligence” in addition to another skill keyword like
“computer vision”.
!82
! ! AI INDEX, NOVEMBER 2017
A7. Robot Imports
return to robot imports section
Primary Sources & Data Sets
World Robotics Report, produced annually by the International Federation of Robotics.
Definition of Collected Data
The data displayed is the number of industrial robots imported each year into North
America and Internationally. Industrial robots are defined by the ISO 8373:2012
standard.
Data Collection Process
The International Federation of Robotics’ annual World Robotics Report contains data
about the volume of robot imports into North America and Internationally. We
extracted shipment data since the year 2000 from these reports.
Nuances
It is unclear how to identify what percentage of robot units run software that would be
classified as “AI” and it is unclear to what extent AI development contributes to
industrial robot usage.

!83
! ! AI INDEX, NOVEMBER 2017
A8. GitHub Project Statistics
return to GitHub project statistics section
Primary Sources & Data Sets
GitHub Archive
GitHub Archive on BigQuery
Definition of Collected Data
The number of Stars for various GitHub repositories overtime. The repositories
included:
apache/incubator-mxnet, BVLC/caffe, caffe2/caffe2, dmlc/mxnet, fchollet/keras,
Microsoft/CNTK, pytorch/pytorch, scikit-learn/scikit-learn, tensorflow/tensorflow,
Theano/Theano.
Collection Process
GitHub archive data is stored on Google BigQuery. We interfaced with Google
BigQuery to count the number of “WatchEvents” for each repository of interest. A
sample of code for collecting the data over the course of 2016 is displayed on the next
page:
!84
! ! AI INDEX, NOVEMBER 2017
SELECT
project,
YEAR(star_date) as yearly,
MONTH(star_date) as monthly,
SUM(daily_stars) as monthly_stars‹
‹
FROM (‹
SELECT
repo.name as project,
DATE(created_at) as star_date,
COUNT(*) as daily_stars‹
FROM
TABLE_DATE_RANGE(
[githubarchive:day.],
TIMESTAMP(“20160101"),
TIMESTAMP(“20161231"))‹
WHERE
repo.name IN (
“tensorflow/tensorflow",
“fchollet/keras",
“apache/incubator-mxnet",
“scikit-learn/scikit-learn",
"caffe2/caffe2", "pytorch/pytorch",
"Microsoft/CNTK", “Theano/Theano",
"dmlc/mxnet", "BVLC/caffe")‹
AND type = ‘WatchEvent’
GROUP BY project, star_date‹
)‹
GROUP BY project, yearly, monthly‹
ORDER BY project, yearly, monthly
!85
! ! AI INDEX, NOVEMBER 2017
Nuances
The GitHub Archive currently does not provide a way to count when users remove a
Star from a repository. Therefore, the data reported slightly over estimates the count
of Stars. Comparison with the actual number of Stars for the repositories on GitHub
shows that the numbers are fairly close and the trends remain unchanged.
There are other ways to retrieve GitHub star data. The star-history tool was used to
spot-check our results.
Forks of GitHub project are also interesting to investigate. We found that the trends of
repository Stars and Forks were almost identical. However, if you are interested in
looking at the absolute Fork data, you can find the data on our website at aiindex.org,
or use the BigQuery code above with type=‘ForkEvent’ instead of type=‘WatchEvent’).
!86
! ! AI INDEX, NOVEMBER 2017
A9. Sentiment of Media Coverage
return to sentiment of media coverage section
Primary Sources & Data Sets
TrendKite
Definition of Collected Data
The TrendKite service indexes general media articles and they employ a sentiment
analysis classifier that categorizes articles as “positive”, “negative”, or “neutral”. We
display the percentage of articles categorized as positive and negative (the remaining
articles are neutral).
Collection Process
We used the below query to identify AI articles. We adjusted it to remove a source that
introduced a disproportionate amount of irrelevant articles with negative sentiment.
Query
”Artificial Intelligence”
AND NOT “MarketIntelligenceCenter.com’s"
NOT site_urls_ll:(
“individual.com"
OR "MarketIntelligenceCenter.com")
TrendKite picks up articles from many sources, but provides filters to make searches
more relevant. We employed filters that:
‱ Only included English-language articles
‱ Removed press releases
‱ Removed financial news
‱ Removed obituaries
!87
! ! AI INDEX, NOVEMBER 2017
With this data we intend to share the general public interest in AI and coverage of AI
for the general public. This filters helped us simplify the space that our signal is drawn
from.
!88
! ! AI INDEX, NOVEMBER 2017
A10. Object Detection
return to object detection section
Primary Sources & Data Sets
LSVRC ImageNet Competition 2010 - 2017
ImageNet Data Set
Definition of Collected Data
The accuracy of the winning teams in the object detection challenges for the LSVRC
ImageNet competition since 2010. See definition of metrics on the LSVRC website.
Data Collection Process
We collected the competition data from the leaderboards for each LSVRC competition
hosted on the ImageNet website.
Nuances
The ImageNet competition is finished as of 2017. It may be possible to continue
surveying the literature for new state of the art results on ILSVRC test sets, but it is
likely that new benchmarks may need to be identified and tracked.
The estimate of human-level performance is from Russakovsky et al, 2015.
!89
! ! AI INDEX, NOVEMBER 2017
A11. Vision Question Answering
return to visual question answering section
Primary Sources & Data Sets
Arxiv (For literature review)
VQA Data Set
The VQA data set consists of images, questions about the content of those images,
and 10 human-generated answers to those questions.
Definition of Collected Data
The data collected represents the accuracy of each AI system to produce open-ended
answers to questions about images (in contrast to producing answers to multiple
choice questions about images).
Accuracy is defined as in the original VQA paper. We collect the accuracies reported in
academic papers when state-of-the-art results were achieved.
Data Collection Process
We performed a literature review to identify when papers achieved new state-of-the-
art results on the VQA 1.0 data set between 2016 and 2017.
Nuances of Data
In conducting our literature review it is quite possible that we missed results which
would slightly alter the timeline of new state-of-the-art achievements. Ensembles were
considered, not just single models.
With ImageNet closing as a competition driving progress in vision tasks, we decided to
survey the landscape of progress in the Visual Question Answering domain. It seems
!90
! ! AI INDEX, NOVEMBER 2017
there may not be an “ImageNet” replacement in the near future however, and we may
need to continue measuring punctuated progress, as we have done with VQA, until a
more dominant benchmark arises.
VQA 1.0 was retired shortly after it’s release in favor of VQA 2.0 which, among other
things, adds more data in an attempt to debias aspects of the data set.
!91
! ! AI INDEX, NOVEMBER 2017
A12. Parsing
return to parsing section
Primary Sources & Data Sets
Penn Treebank
The Wall Street Journal portion of the Penn Treebank is a data set of sentences
annotated with a constituency-based parse tree for each sentence. Section 23 of this
data set has become the primary test set for research into automatic parsers.
Definition of Collected Data
Automatic parsers are evaluated by comparing the constituents of automatically
generated parses to the constituents in gold parses from a test set. The precision and
recall of the generated constituents are combined and reported as the F1 score. We
report is the F1 score of parsers on sentences in section 23 of the WSJ portion of the
Penn Treebank. We report these scores for sentences of length <40 words and on the
entire set of sentences where each are available. Learn more about Constituency-
based parse trees on the wikipedia page for parse trees.
Data Collection Process
We conducted a literature review to identify when new parsers increased the state of
the art in automatic parsing. We collected the F1 scores of parsers we identified going
back to 1995. Ensembles were included, not just single models.
Nuances of Data
In the early days of automatic parsing research, parsers were typically evaluated only
on sentences of length <40 words and length <100 words for computational and
methodological reason. We have recorded the F1 scores of systems on sentences of
length <40 words and on all sentences in the corpus when available.

!92
! ! AI INDEX, NOVEMBER 2017
A13. Machine Translation
return to machine translation section
Primary Sources & Data Sets
Conference / Workshop on Machine Translation (WMT) news translation task
EuroMatrix
There is an annual Conference on Machine Translation, which spun out of an annual
Workshop on Machine Translation. Each year WMT hosts a news translation task and
provides new training and test data sets. Teams of attendees submit the translation
systems they have built to participate in the translation task.
Definition of Collected Data
The main metric used by WMT aims at ranking the competing entries and does not
allow year-over-year comparisons.  It is also very labor intensive.  We have fallen back
on BLEU, an automatic method that does a rough comparison of the system
translation to a number of human-generated translations.  It is a modified version of
precision, between 0 and 1, where higher is better. One can also calculate the average
BLEU score of a machine translation system on a corpus of translation pairs. For each
year, we have recorded the highest average BLEU score achieved by a system
submitted to that year’s news translation task for English to German and German to
English. See below for the nuances of the WMT translation task and the BLEU metric.
Data Collection Process
EuroMatrix has recorded the BLEU scores of submissions to the news translation task
since 2006 on the English to German and German to English language pairs. We
selected the BLEU score of a top performing system each year, specifically using BLEU
(11b), which defines a protocol for tokenizing sentences. When possible, we selected
!93
! ! AI INDEX, NOVEMBER 2017
the score of a system that had a high-ranking BLEU score in both pairs as the
representative for that year.
See the implementation of 11b tokenization in the linked file.
Nuances of the Data
BLEU can be computed automatically and it has been shown to correlate with human
judgement of translation quality. However, the metric cannot be used across corpuses
and it can misleading to compare BLEU scores between systems. While the graphs
trends upward generally, we can see one way this metric is flawed in 2017, when the
BLEU scores fell significantly compared to the 2016 scores (though, the 2017 scores
are still higher than the 2015 scores). It is unlikely that the performance of MT systems
declined compared to 2016, but the evaluation scheme presented here is not perfect.
However, looking at trends over larger time periods, the BLEU score can give an
indication of progress in the area of machine translation.
!94
! ! AI INDEX, NOVEMBER 2017
A14. Question Answering
return to question answering section
Primary Sources & Data Sets
Stanford Question Answering Dataset
The Stanford Question Answering Dataset (SQuAD) is a data set of over 500 articles
and 100,000 question-answer pairs associated with the articles. Given a question
about the content of an article, the task is to identify the answer within the article.
Definition of Collected Data
The chosen evaluation metric on this data set is “Exact Match” (EM), the percentage
of answers generated by a system that exactly match the answer in the test set. The
data displayed is the state-of-the-art EM score of question-answering systems on the
SQuAD data set over time.
Data Collection Process
We collected the results from the leaderboard hosted at the SQuAD website.
Nuances of Data
All answers in the SQuAD data set are direct quotes from the associated article.
Therefore, the job of the system is really to identify what subsection of the given
article contains the answer to the posed question.
While easy to track, it is not clear how long the SQuAD data set will be of interest.
Scores for the task have risen rapidly since SQuAD’s introduction in June 2016.
The Exact Match score of humans on this data set is reported to be 82.304.

!95
! ! AI INDEX, NOVEMBER 2017
A15. Speech Recognition
return to speech recognition section
Primary Sources & Data Sets
Switchboard Hub5’00 data set (Speech and Transcripts).
EFF AI Progress Metrics
Definition of Collected Data
The state-of-the-art Word Error Rate (WER) of trained speech recognition systems on
the standard Switchboard Hub5’00 data set over time. WER is the number of errors --
word substitutions, deletions and insertions-- needed to map the transcription to the
gold standard, normalized by the length of the sentence.  We plot Word Accuracy, or 1 -
WER to keep the direction of progress consistent across graphs.
Data Collection Process
The Electronic Frontier Foundation previously performed a literature review to extract
performance of speech recognition systems on the HUB5’00 data set. We simply
display these results in our report.
Nuances of Data
The Switchboard data set has been in use for a long time. There is concern that our AI
systems may be significantly overfit to this specific data and that further progress on
this data set may be less indicative of overall progress in the field going forward.
There has recently been some disagreement about what the human performance for
WER on the Switchboard HUB5’00 data set actually is. There have been reports of 5.1%
and 5.9%, and even reports of below 5%. In this report we choose to use the 5.1%
measure as the bar for human performance.
!96
! ! AI INDEX, NOVEMBER 2017
A16. Theorem Proving
return to theorem proving section
Primary Sources & Data Sets
Thousands of Problems for Theorem Provers (TPTP)
TPTP is a large set of Theorem Proving problem instances.
Definition of Collected Data
The Automatic Theorem Proving (ATP) community has developed a method for
determining how “difficult” a given problem instance is to solve with current ATP
technology. We record the average difficulty of a subset of TPTP problems over time.
The chosen TPTP problems are those which have not been updated since TPTP v5.0.0
(year 2010). We graph 1 - Difficulty and title this “Tractability” to maintain a consistent
direction of progress across graphs.
See the definition of TPTP problem difficulty in a paper by the TPTP maintainer.
See a visual example of how the difficulty of a given TPTP problem instance is
calculated.
Data Collection Process
The TPTP data set includes the difficulty of each problem at each version. We wrote
scripts to extract these difficulties from the desired subset of TPTP problem instances
and to compute the average difficulties the relevant problems problems over time. The
scripts will be made available on the AI Index website at aiindex.org.
Nuances of Data
The definition of TPTP problem difficulty used by the community has some quirks. It is
dependent on the set of available ATP systems. It is possible for a problem to become
!97
! ! AI INDEX, NOVEMBER 2017
more difficult over time if many useful ATP systems are created that cannot solve the
problem.
See a review of the TPTP v6.4.0 data set by its maintainer.
!98
! ! AI INDEX, NOVEMBER 2017
A17. SAT Solving
return to SAT Solving section
Primary Sources & Data Sets
SAT Competition
SAT Solver Performance Data
The SAT competition has an “industrial” track for problem instances that take the form
of practical problems. Holger Hoos and Kevin Leyton-Brown took 69 solvers and 1076
problem instances that have been a part of the competition since 2007 and ran each
solver on each problem on the same hardware.
Definition of Collected Data
For each year, we take the average of the percentage of problems (all problems in the
competition since 2007) completed by solvers submitted that year as well as the
percentage of problems solved by the best solver.
Collection Process
Hoos & Leyton-Brown collected the performance of each solver on each problem. We
simply aggregated the data to produce the score described above.
Nuances
This metric will improve simply with processor speed, although Hoos and Leyton-
Brown have corrected for this by running everything on the same hardware.
While this metric essentially tracks how efficient SAT solvers are becoming over time,
this metric does not quantify the novelty of contributions of new SAT solvers over
time. In other words, it may be possible for this metric to mostly represent engineering
feats (which are still important) as opposed to algorithmic breakthrough. We are
!99
! ! AI INDEX, NOVEMBER 2017
reviewing methodologies that may better quantify the fundamental contribution of
newly created SAT solvers.
!100
! ! AI INDEX, NOVEMBER 2017
!101

2017 AI Index report

  • 1.
    ! ! AIINDEX, NOVEMBER 2017 !1
  • 2.
    ! ! AIINDEX, NOVEMBER 2017 STEERING COMMITTEE Yoav Shoham (chair) Stanford University Raymond Perrault SRI International Erik Brynjolfsson MIT Jack Clark OpenAI PROJECT MANAGER Calvin LeGassick !2
  • 3.
    ! ! AIINDEX, NOVEMBER 2017 TABLE OF CONTENTS Introduction to the AI Index 2017 Annual Report 5 Overview 7 Volume of Activity 9 Academia 9 Published Papers 9 Course Enrollment 11 Conference Attendance 14 Industry 16 AI-Related Startups 16 AI-Related Startup Funding 17 Job Openings 18 Robot Imports 21 Open Source Software 23 GitHub Project Statistics 23 Public Interest 25 Sentiment of Media Coverage 25 Technical Performance 26 Vision 26 Object Detection 26 Visual Question Answering 27 Natural Language Understanding 28 Parsing 28 Machine Translation 29 Question Answering 30 Speech Recognition 31 !3
  • 4.
    ! ! AIINDEX, NOVEMBER 2017 Theorem Proving 32 SAT Solving 33 Derivative Measures 34 Towards Human-Level Performance? 37 What’s Missing? 41 Expert Forum 44 Get Involved! 68 Acknowledgements 70 Appendix A: Data Description & Collection Methodology 72 !4
  • 5.
    ! ! AIINDEX, NOVEMBER 2017 INTRODUCTION TO THE AI INDEX 2017 ANNUAL REPORT Artificial Intelligence has leapt to the forefront of global discourse, garnering increased attention from practitioners, industry leaders, policymakers, and the general public. The diversity of opinions and debates gathered from news articles this year illustrates just how broadly AI is being investigated, studied, and applied. However, the field of AI is still evolving rapidly and even experts have a hard time understanding and tracking progress across the field. !5
  • 6.
    ! ! AIINDEX, NOVEMBER 2017 Without the relevant data for reasoning about the state of AI technology, we are essentially “flying blind” in our conversations and decision-making related to AI. We are essentially “flying blind” in our conversations and decision-making related to Artificial Intelligence. Created and launched as a project of the One Hundred Year Study on AI at Stanford University (AI100), the AI Index is an open, not-for-profit project to track activity and progress in AI. It aims to facilitate an informed conversation about AI that is grounded in data. This is the inaugural annual report of the AI Index, and in this report we look at activity and progress in Artificial Intelligence through a range of perspectives. We aggregate data that exists freely on the web, contribute original data, and extract new metrics from combinations of data series. All of the data used to generate this report will be openly available on the AI Index website at aiindex.org. Providing data, however, is just the beginning. To become truly useful, the AI Index needs support from a larger community. Ultimately, this report is a call for participation. You have the ability to provide data, analyze collected data, and make a wish list of what data you think needs to be tracked. Whether you have answers or questions to provide, we hope this report inspires you to reach out to the AI Index and become part of the effort to ground the conversation about AI. !6
  • 7.
    ! ! AIINDEX, NOVEMBER 2017 OVERVIEW The first half of the report showcases data aggregated by the AI Index team. This is followed by a discussion of key areas the report does not address, expert commentary on the trends displayed in the report, and a call to action to support our data collection efforts and join the conversation about measuring and communicating progress in AI technology. Data Sections The data in the report is broken into four primary parts: ‱ Volume of Activity ‱ Technical Performance ‱ Derivative Measures ‱ Towards Human-Level Performance? The Volume of Activity metrics capture the “how much” aspects of the field, like attendance at AI conferences and VC investments into startups developing AI systems. The Technical Performance metrics capture the “how good” aspects; for example, how well computers can understand images and prove mathematical theorems. The methodology used to collect each data set is detailed in the appendix. These first two sets of data confirm what is already well recognized: all graphs are “up and to the right,” reflecting the increased activity in AI efforts as well as the progress of the technology. In the Derivative Measures section we investigate the relationship between trends. We also introduce an exploratory measure, the AI Vibrancy Index, that combines trends across academia and industry to quantify the liveliness of AI as a field.‹ When measuring the performance of AI systems, it is natural to look for comparisons to human performance. In the Towards Human-Level Performance section we outline a short list of notable areas where AI systems have made significant progress towards !7
  • 8.
    ! ! AIINDEX, NOVEMBER 2017 matching or exceeding human performance. We also discuss the difficulties of such comparisons and introduce the appropriate caveats. Discussion Sections Following the display of the collected data, we include some discussion of the trends this report highlights and important areas this report entirely omits. Part of this discussion centers on the limitations of the report. This report is biased towards US-centric data sources and may overestimate progress in technical areas by only tracking well-defined benchmarks. It also lacks demographic breakdowns of data and contains no information about AI Research & Development investments by governments and corporations. These areas are deeply important and we intend to tackle them in future reports. We further discuss these limitations and others in the What’s Missing section of the report. As the report’s limitations illustrate, the AI Index will always paint a partial picture. For this reason, we include subjective commentary from a cross-section of AI experts. This Expert Forum helps animate the story behind the data in the report and adds interpretation the report lacks. Finally, where the experts’ dialogue ends, your opportunity to Get Involved begins. We will need the feedback and participation of a larger community to address the issues identified in this report, uncover issues we have omitted, and build a productive process for tracking activity and progress in Artificial Intelligence.
 !8
  • 9.
    ! ! AIINDEX, NOVEMBER 2017 VOLUME OF ACTIVITY Academia Published Papers view more information in appendix A1 The number of Computer Science papers published and tagged with the keyword “Artificial Intelligence” in the Scopus database of academic papers. !9 9x The number of AI papers produced each year has increased by more than 9x since 1996.
  • 10.
    ! ! AIINDEX, NOVEMBER 2017 A comparison of the annual publishing rates of different categories of academic papers, relative to their publishing rates in 1996. The graph displays the growth of papers across all fields, papers within the Computer Science field, and AI papers within the Computer Science field. The data illustrates that growth in AI publishing is driven by more than a growing interest in the broader field of Computer Science. Concretely, while the number of papers within the general field of Computer Science has grown by 6x since 1996 the number of AI papers produced each year has increased by more than 9x in that same period.
 !10
  • 11.
    ! ! AIINDEX, NOVEMBER 2017 Course Enrollment view more information in appendix A2 The number of students enrolled in introductory Artificial Intelligence & Machine Learning courses at Stanford University. ML is a subfield of AI. We highlight ML courses because of their rapid enrollment growth and because ML techniques are critical to many recent AI achievements. !11 Introductory AI class enrollment at Stanford has increased 11x since 1996. Note: The dip in Stanford ML enrollment for the 2016 academic year reflects an administrative quirk that year, not student interest. Details in appendix. 11x
  • 12.
    ! ! AIINDEX, NOVEMBER 2017 We highlight Stanford because our data on other universities is limited. However, we can project that past enrollment trends at other universities are similar to Stanford’s. !12 Note: Many universities have offered AI courses since before the 90’s. The graphs above represent the years for which we found available data.
  • 13.
    ! ! AIINDEX, NOVEMBER 2017 It is worth noting that these graphs represent a specific sliver of the higher education landscape, and the data is not necessarily representative of trends in the broader landscape of academic institutions. !13 Note: Many universities have offered ML courses since before the 90’s. The graphs above represent the years for which we found available data.
  • 14.
    ! ! AIINDEX, NOVEMBER 2017 Conference Attendance view more information in appendix A3 The number of attendees at a representative sample of AI conferences. The data is split into large conferences (over 1000 attendees in 2016) and small conferences (under 1000 attendees in 2016). !14 These attendance numbers show that research focus has shifted from symbolic reasoning to machine learning and deep learning. Shifting Focus Note: Most of the conferences have existed since the 1980s. The data above represents the years attendance data was recorded.
  • 15.
    ! ! AIINDEX, NOVEMBER 2017 !15 Despite shifting focus, there is still a smaller research community making steady progress on symbolic reasoning methods in AI. Steady Progress
  • 16.
    ! ! AIINDEX, NOVEMBER 2017 Industry AI-Related Startups view more information in appendix A4 The number of active venture-backed US private companies developing AI systems. !16 The number of active US startups developing AI systems has increased 14x since 2000.14x
  • 17.
    ! ! AIINDEX, NOVEMBER 2017 AI-Related Startup Funding view more information in appendix A5 The amount of annual funding by VC’s into US AI startups across all funding stages. 
 !17 Annual VC investment into US startups developing AI systems has increased 6x since 2000.6x
  • 18.
    ! ! AIINDEX, NOVEMBER 2017 Job Openings view more information in appendix A6 We obtained AI-related job growth data from two online job listing platforms, Indeed and Monster. AI-related jobs were identified with titles and keywords in descriptions. The growth of the share of US jobs requiring AI skills on the Indeed.com platform. Growth is a multiple of the share of jobs on the Indeed platform that required AI skills in the US in January 2013. 
 !18 The share of jobs requiring AI skills in the US has grown 4.5x since 2013.4.5x
  • 19.
    ! ! AIINDEX, NOVEMBER 2017 The growth of the share of jobs requiring AI skills on the Indeed.com platform, by country. !19 Note: Despite the rapid growth of the Canada and UK AI job markets, Indeed.com reports they are respectively still 5% and 27% of the absolute size of the US AI job market.
  • 20.
    ! ! AIINDEX, NOVEMBER 2017 The total number of AI job openings posted on the Monster platform in a given year, broken down by specific required skills. !20 Note: A single AI-related job may be double counted (belong to multiple categories). For example, a job may speciïŹcally require natural language processing and computer vision skills.
  • 21.
    ! ! AIINDEX, NOVEMBER 2017 Robot Imports view more information in appendix A7 The number of imports of industrial robot units into North America and globally. !21
  • 22.
    ! ! AIINDEX, NOVEMBER 2017 The growth of imports of industrial robot units into North America and globally. !22
  • 23.
    ! ! AIINDEX, NOVEMBER 2017 Open Source Software GitHub Project Statistics view more information in appendix A8 The number of times the TensorFlow and Scikit-Learn software packages have been Starred on GitHub. TensorFlow and Scikit-Learn are popular software packages for deep learning and machine learning. Software developers “Star” software projects on GitHub to indicate projects they are interested in, express appreciation for projects, and navigate to projects quickly. Stars can provide a signal for developer interest in and usage of software.
 !23
  • 24.
    ! ! AIINDEX, NOVEMBER 2017 The number of times various AI & ML software packages have been Starred on GitHub. !24 Note: Forks of GitHub repositories follow almost identical trends (though, the absolute number of forks and stars for each repo diïŹ€er). See the appendix for info on gathering Forks data.
  • 25.
    ! ! AIINDEX, NOVEMBER 2017 Public Interest Sentiment of Media Coverage view more information in appendix A9 The percentage of popular media articles that contain the term “Artificial Intelligence” and that are classified as either Positive or Negative articles. !25
  • 26.
    ! ! AIINDEX, NOVEMBER 2017 TECHNICAL PERFORMANCE Vision Object Detection view more information in appendix A10 The performance of AI systems on the object detection task in the Large Scale Visual Recognition Challenge (LSVRC) Competition. !26 Error rates for image labeling have fallen from 28.5% to below 2.5% since 2010.2.5%
  • 27.
    ! ! AIINDEX, NOVEMBER 2017 Visual Question Answering view more information in appendix A11 The performance of AI systems on a task to give open-ended answers to questions about images. !27 Note: The VQA 1.0 data set has already been surpassed by the VQA 2.0 data set and it is unclear how much further attention the VQA 1.0 data set will receive.
  • 28.
    ! ! AIINDEX, NOVEMBER 2017 Natural Language Understanding Parsing view more information in appendix A12 The performance of AI systems on a task to determine the syntactic structure of sentences. !28
  • 29.
    ! ! AIINDEX, NOVEMBER 2017 Machine Translation view more information in appendix A13 The performance of AI systems on a task to translate news between English and German. !29
  • 30.
    ! ! AIINDEX, NOVEMBER 2017 Question Answering view more information in appendix A14 The performance of AI systems on a task to find the answer to a question within a document. 
 !30
  • 31.
    ! ! AIINDEX, NOVEMBER 2017 Speech Recognition view more information in appendix A15 The performance of AI systems on a task to recognize speech from phone call audio. 
 !31
  • 32.
    ! ! AIINDEX, NOVEMBER 2017 Theorem Proving view more information in appendix A16 The average tractability of a large set of theorem proving problems for Automatic Theorem Provers. “Tractability” measures the fraction of state-of-the-art Automatic Theorem Provers that can solve a problem. See appendix for details about the “tractability” metric. !32 Note: Average tractability can go down if state-of-the-art solvers are introduced that perform well on novel problems but poorly on problems other solvers are good at.
  • 33.
    ! ! AIINDEX, NOVEMBER 2017 SAT Solving view more information in appendix A17 The percentage of problems solved by competitive SAT solvers on industry-applicable problems. !33
  • 34.
    ! ! AIINDEX, NOVEMBER 2017 DERIVATIVE MEASURES We can glean additional insights from the measurements in the previous sections by examining the relationships between trends. This section demonstrates how the data gathered by the AI Index can be used for further analysis and to spur the development of refined and wholly original metrics. As a case-study for this demonstration, we look at trends across academia and industry to explore their dynamics. Further, we aggregate these metrics into a combined AI Vibrancy Index. Academia-Industry Dynamics To explore the relationship between AI-related activity in academia and industry, we first select a few representative measurements from the previous sections. In particular, we look at AI paper publishing, combined enrollment in introductory AI and ML courses at Stanford, and VC investments into AI-related startups. These metrics represent quantities that cannot be compared directly: papers published, students enrolled, and amount invested. In order to analyze the relationship between these trends, we first normalize each measurement starting at the year 2000. This allows us to compare how the metrics have grown instead of the absolute values of the metrics over time. !34
  • 35.
    ! ! AIINDEX, NOVEMBER 2017 The data shows that, initially, academic activity (publishing and enrollment) drove steady progress. Around 2010 investors started to take note and by 2013 became the drivers of the steep increase in total activity. Since then, academia has caught up with the exuberance of industry. !35 Note: The dip in enrollment for the 2016 academic year reïŹ‚ects an administrative quirk that year, not student interest. Details in appendix A2.
  • 36.
    ! ! AIINDEX, NOVEMBER 2017 The AI Vibrancy Index The AI Vibrancy Index aggregates the measurements from academia and industry (publishing, enrollment and VC investment) to quantify the liveliness of AI as a field. To compute the AI Vibrancy Index, we average normalized publishing, enrollment and investment metrics over time. We hope this brief investigation sparks interest in how metrics from the AI Index can be further analyzed and creates discussion about what derived measures may be useful to track over time. !36
  • 37.
    ! ! AIINDEX, NOVEMBER 2017 TOWARDS HUMAN-LEVEL PERFORMANCE? It is natural to look for comparisons between the performance of AI systems and humans on the same task. Obviously, computers are vastly superior to humans in certain tasks; 1970-era hand calculators can perform arithmetic better than humans. However, the competence of AI systems becomes more difficult to assess when dealing with more general tasks like answering questions, playing games, and making medical diagnoses. Tasks for AI systems are often framed in narrow contexts for the sake of making progress on a specific problem or application. While machines may exhibit stellar performance on a certain task, performance may degrade dramatically if the task is modified even slightly. For example, a human who can read Chinese characters would likely understand Chinese speech, know something about Chinese culture and even make good recommendations at Chinese restaurants. In contrast, very different AI systems would be needed for each of these tasks. Machine performance may degrade dramatically if the original task is modified even slightly. Despite the difficulty of comparing human and AI systems, it is interesting to catalogue credible claims that computers have reached or exceeded human-level performance. Still, it is important to remember that these achievements say nothing about the ability of these systems to generalize. We also note the list below contains many game playing achievements. Games provide a relatively simple, controlled, experimental environment and so are often used for AI research.
 !37
  • 38.
    ! ! AIINDEX, NOVEMBER 2017 Milestones Below is a brief description of the achievements and their circumstances. Some milestones represent significant progress towards human performance and others represent super-human performance achievements. Othello In the 1980s Kai-Fu Lee and Sanjoy Mahajan developed BILL, a Bayesian learning-based system for playing the board game Othello. In 1989 the program won the US national tournament of computer players, and beat the highest ranked US player, Brian Rose, 56-8. In 1997 a program named Logistello won every game in a six game match against the reigning Othello world champion. Checkers In 1952, Arthur Samuels built a series of programs that played the game of checkers and improved via self-play. However, it was not until 1995 that a checkers-playing program, Chinook, beat the world champion. Chess Some computer scientists in the 1950s predicted that a computer would defeat the human chess champion by 1967, but it was not until 1997 that IBM’s DeepBlue system beat chess champion Gary Kasparov. Today, chess programs running on smartphones can play at the grandmaster level. !38 1980 1995 1997
  • 39.
    ! ! AIINDEX, NOVEMBER 2017 Jeopardy! In 2011, the IBM Watson computer system competed on the popular quiz- show Jeopardy! against former winners Brad Rutter and Ken Jennings. Watson won the first place prize of $1 million. Atari Games In 2015, a team at Google DeepMind used a reinforcement learning system to learn how to play 49 Atari games. The system was able to achieve human-level performance in a majority of the games (e.g., Breakout), though some are still significantly out of reach (e.g., Montezuma’s Revenge). Object Detection in ImageNet In 2016, the error rate of automatic labeling of ImageNet declined from 28% in 2010 to less than 3%. Human performance is about 5%. Go In March of 2016, the AlphaGo system developed by the Google DeepMind team beat Lee Sedol, one of the world’s greatest Go players, 4-1. DeepMind then released Alpha Go Master, which defeated the top ranked player, Ke Jie, in March of 2017. In October 2017 a Nature paper detailed yet another new version, AlphaGo Zero, which beat the original AlphaGo system 100-0. !39 2016 2016 2015 2011
  • 40.
    ! ! AIINDEX, NOVEMBER 2017 Skin Cancer Classification In a 2017 Nature article, Esteva et al. describe an AI system trained on a data set of 129,450 clinical images of 2,032 different diseases and compare its diagnostic performance against 21 board-certified dermatologists. They find the AI system capable of classifying skin cancer at a level of competence comparable to the dermatologists. Speech Recognition on Switchboard In 2017,  Microsoft and IBM both achieved performance within close range of “human-parity” speech recognition in the limited Switchboard domain. Poker In January 2017, a program from CMU called Libratus defeated four top human players in a tournament of 120,000 games of two-player, heads up, no-limit Texas Hold’em. In February 2017, a program from the University of Alberta called DeepStack played a group of 11 professional players more than 3,000 games each. DeepStack won enough poker games to prove the statistical significance of its skill over the professionals. Ms. Pac-Man Maluuba, a deep learning team acquired by Microsoft, created an AI system that learned how to reach the game’s maximum point value of 999,900 on Atari 2600. !40 2017 2017 2017 2017
  • 41.
    ! ! AIINDEX, NOVEMBER 2017 WHAT’S MISSING? This inaugural annual report covers a lot of ground, but certainly not all of it. Many important areas were omitted for lack of available data, time, or both. We hope to address the limitations below in future editions of the report. We also believe it will take the support of the broader community to effectively engage in this broad range of challenges, and we invite you to reach out to the AI Index if you have ideas or relevant data for tackling these challenges. Technical Performance We did not cover progress in many important technical areas. For some areas there are not clear standardized benchmarks (e.g. dialogue systems, planning, continuous control in robotics). In other areas it is hard to measure performance when there has not been significant progress, like in commonsense reasoning. And still, other areas are waiting to be tracked but we simply have not had the opportunity to collect the data (e.g. recommender systems, standardized testing). Tracking areas that have traditionally lacked concrete measurements may also facilitate a more sober assessment of AI progress. Progress is typically tracked consistently when good progress has been made. As a result, this report may present an overly optimistic picture. Indeed, chatbot dialog falls far short of human dialog and we lack widely accepted benchmarks for progress in this area. Similarly, while today’s AI systems have far less common sense reasoning than that of a five-year-old child, it is unclear how to quantify this as a technical metric. Expanding the coverage of the report may help correct for this optimistic bias. Additionally, any effort to develop effective reporting metrics in one of these more difficult areas may be a contribution in itself that spurs further progress in the area. !41
  • 42.
    ! ! AIINDEX, NOVEMBER 2017 International Coverage This report is very US-centric, despite the significant amount of AI activity and progress across the world. As a single example, the level of investment and activity in China today is astounding but outside the scope of this report. While we did not have the time or ability to collect such data for the inaugural AI Index report, future editions of the report will need better international coverage. Diversity & Inclusion Those researching and deploying AI systems will play a significant role in shaping the impact of AI on society. If we intend to contribute relevant data to discussions about the ultimate impact of Artificial Intelligence on society, then we must quantify who gets to participate in conversations about AI as well as measure who holds the power to influence future AI research and deployment. This inaugural report contains no breakdown of data by sex, race, gender, ethnicity, sexuality or other characteristics. How many women get the opportunity to contribute to AI research in industry?  What percentage of AI startups in the US are founded by black men? These questions are intimately related to the power dynamics at play within the technology and venture capital industries as well as broader systemic forces of discrimination. No one study can frame the conversations about these complex dynamics, but we believe an effort like the AI Index must engage in these questions to authentically analyze the full impact of AI on our society. Government and Corporate Investment The venture capital investment data showcased in this report focuses solely on the US and represents a very small sliver of total investment in AI Research & Development (R&D). !42
  • 43.
    ! ! AIINDEX, NOVEMBER 2017 Governments and corporations have made substantial investments in AI R&D. While this data may be more difficult to collect, we intend to pursue data that highlights government and corporate investments in the US and internationally. We anticipate that it will require a highly coordinated, collaborative effort to effectively make progress in this area. Impact in Specific Verticals We aspire to provide relevant metrics for conversations about AI’s impact in healthcare, automotive, finance, education, and beyond. These areas are perhaps the most important and most difficult to get a handle on. Relevant metrics in these areas are difficult to identify and aggregate because they call for additional understanding of these disparate domains. We plan to branch into these areas in collaboration with experts in these domains and others. Mitigating Societal Risks Issues associated with societal risks resulting from AI are left unaddressed in this report. In the future, we hope to provide metrics that help ground discussions of AI safety and predictability, fairness of AI algorithms, privacy in an era of AI, ethical implications of increased automation, and other topics. !43
  • 44.
    ! ! AIINDEX, NOVEMBER 2017 EXPERT FORUM By definition, every data set or index loses information and introduces unintended biases. Our index can only paint a partial picture of the past, present, and future of AI. To broaden this picture, we have collected the perspectives of AI experts spanning academia, industry, government and media. Barbara Grosz Harvard Mind the Gap The first report of the AI Index is laudable not only for its rooting of the state of AI in data and the record time in which it was produced, but also for the authors' mindfulness about gaps in coverage.  Several missing areas would require, in one way or another, metrics that took account not only of the performance of AI methods in a vacuum, but also of the quality of an AI technology's interactions with people or of the ways in which AI enabled systems affect people, both as individuals and in societies. This particular gap is especially noteworthy in light of the recent increased attention being given to developing AI capabilities that complement or augment people's abilities rather than aiming to replicate human intelligence. IJCAI-16 had "human aware AI" as a special theme, AAAI-18 has "human-AI collaboration" as an emerging theme, and the last few years have seen many workshops and symposia on human-in-the loop AI and on AI and society. This gap is reflected in the section on natural language processing, which reports on parsing, machine translation and abilities to find answers to questions in a designated document, but does not (as it acknowledges) report on dialogue systems or chatbots. !44
  • 45.
    ! ! AIINDEX, NOVEMBER 2017 Parsing requires no consideration of the mental state of the producer of the utterance being parsed, and for many situations in which machine translation and question answering have been tested it is also possible to ignore mental state and in particular the purposes crucial to an utterance's meaning. Not so with dialogue. As this AI Index report notes, factors can only be included in an index if there are good ways to measure them.  Metrics that take account of the human as well as the AI technology pose a major challenge, as anyone who has done research requiring an IRB can attest. It is important to take on the challenge of identifying success measures for AI algorithms and systems not simply on the basis of their efficiency or completeness, but taking into account their impact on the people whose lives they affect.  If this first AI Index report spurs development of such metrics, it will have made a major contribution to AI, to computer science and to society at large. It is important to take on the challenge of identifying success measures for AI systems by their impact on people's lives. I'd also like to see future AI Index reports investigate not only AI course enrollments, but also the numbers of AI courses that devote attention to ethical concerns that AI raises.  (Disclosure: For the last three years, I have taught a course on "Intelligent Systems: Design and Ethical Challenges".) As AI-enabled systems increasingly pervade daily life, AI courses need to convey to students the importance of considering ethics from the start of their design. Another challenge for the AI Index then is to find ways to track such factors as the number of companies producing AI systems that have asked whether such a system should be built, and the numbers of AI systems designers who have considered in their design the unintended consequences that might ensue from a particular design and how best to ameliorate them. !45
  • 46.
    ! ! AIINDEX, NOVEMBER 2017 Eric Horvitz Microsoft I’m excited about the publication of the inaugural annual report of the AI Index.  The project was spawned by the One Hundred Year Study on Artificial Intelligence (AI100) at Stanford University, and resonates deeply with the goals of AI100 to host periodic studies to assess and address the influences of AI advances on people and society over a century.  AI100 was designed to establish a long-lived “connected presence” that extends human intellect and agency about AI and its influences into the future.  The ambitious AI Index initiative arose in discussions of the AI100 Standing Committee in 2015. The AI Index defines and tracks sets of metrics about AI advances over time. The first report provides data collected about recent trends for key measures of sets of AI competencies, AI-related activities, and an exploratory “derivative” measure.  The measures show recent upswings on multiple fronts, many based in advances in machine learning, and particularly variants of convolutional neural networks, fueled by algorithmic advances, as well as the availability of large-scale data resources and increasingly powerful computation. I find the derivative measures section to be creative and useful, even if they provide only coarse signals—and signals that leave room for interpretation.  The AI Vibrancy Index attempts to capture the overall “vibrancy” of AI over time, as reflected by a combination of measures of AI efforts and ideas in academia and industry. Such derivative measures might be validated or calibrated (or refined) in future work by aligning them with measures of phenomena that are closer to ground truth of goals, such as the statistics collected on the hiring, composition, and compensation of AI talent at corporations. !46
  • 47.
    ! ! AIINDEX, NOVEMBER 2017 The report devotes a special section to a discussion of “human-level” performance, and calls out several celebrated results that are relatively easy to define and track. These include competencies with performing human-level medical diagnoses (e.g., diagnosing pathology from the visual analyses of tissue sections) and winning games (e.g., Othello, checkers, chess, go, and poker).  The report also considers human-level competencies that are more challenging to define, such as metrics for understanding and tracking advances with commonsense reasoning—including the commonsense understanding that is displayed by a toddler (out of reach by today’s AI technologies). I found the report to be refreshing in its reporting on “what’s missing.”  Beyond the expressed gaps, I expect that many people will find additional gaps, blind spots, and deficiencies in the definitions and design choices in this first round of the AI Index.  However, it is no small feat to move from the initial discussions about an AI index to the concrete publication of the current indices. Beyond providing a set of interesting findings, putting a reasonable stake in the ground with the publication of these indices is a critical step in engaging a wider community in a dialog, aimed at refining and extending these metrics. Putting a reasonable stake in the ground with the publication of these indices is a critical step in engaging a wider community in a dialog. Over time, we can expect to see numerous studies offering metrics on AI advances. These include distinct deep dives (e.g., AAAI 2017) into one or more aspects of the status and trends around AI competencies, activities, and influences. I believe that we should celebrate multiple analyses and indices about AI; research and studies on AI and its influences have been growing within multiple communities and we can expect the blossoming of multiple perspectives.  Nonetheless, I see value in working to pull !47
  • 48.
    ! ! AIINDEX, NOVEMBER 2017 together an increasingly comprehensive index that can serve as a focal point for contributions and a “shared lens” for tracking and understanding advances in AI. The publication of the first instance of the AI Index provides a set of interesting insights about recent trends with AI advances. The commitment to continuing the analyses going forward is exciting—and stimulates the imagination about points and trend lines that will appear on charts as time extends into the future. !48
  • 49.
    ! ! AIINDEX, NOVEMBER 2017 Kai-Fu Lee Sinovation Ventures State of AI in China The AI Index is an important effort to ground the discussion of AI. There are many important statistics in the inaugural report to understand current development of AI, primarily for the US market. For now, let me fill the gap by adding this commentary about the state of AI in China. "There's no data like more data."  More data makes AI smarter. So, how much data is China generating? China has the most mobile phones and Internet users in the world, which is about three times more than that in the US or India. Many think that the gap between the US and China is just a factor of three. It is dramatically larger than that. In China, people use their mobile phones to pay for goods, 50 times more often than Americans. Food delivery volume in China is 10 times more than that of the US. It took bike-sharing company Mobike 10 months to go from nothing to 20 million orders (or rides) per day. There are over 20 million bicycle rides transmitting their GPS and other sensor information up to the server, creating 20 terabytes of data everyday. Similarly, China’s ride-hailing operator Didi is reported to connect its data with traffic control in some pilot cities. All of these Internet connected things will yield data that helps make existing products and applications more efficient, and enable new applications we never thought of. What about the quality of China's AI products? Many probably still remember the days when China was nothing but copycats around 15 years ago. Smart and eager Chinese tech giants and entrepreneurs have morphed by western innovations to exceed their overseas counterparts. An example in AI, Chinese face recognition startup Face++ !49
  • 50.
    ! ! AIINDEX, NOVEMBER 2017 recently won first place in 3 computer vision challenges, ahead of teams from Google, Microsoft, Facebook, and CMU. China's State Council announced a straightforward plan to become the AI innovation hub by 2030. Chinese government is open-minded with technology development. The environment in China is more conducive for fast launch and iteration. In July 2017, China’s State Council announced “Next Generation Artificial Intelligence Development Plan” with straightforward goal to become a global AI innovation hub by 2030. The plan is expected to promote AI as a high priority among major industries and provincial governments. If you think this is all talk, China's policies are actually very well executed as demonstrated with past plans such as high-speed rail, and the mass entrepreneurship and innovation movement. We can expect similar trajectory for its AI policies. The pro-tech, pro experimentation, and pro speed attributes put China in a position to become a very strong AI power. In this age of AI, I predict that the United States-China duopoly is not only inevitable. It has already arrived. !50
  • 51.
    ! ! AIINDEX, NOVEMBER 2017 Alan Mackworth University of British Columbia The AI Index, in its Alpha version, is a great start, and already a useful tool for measuring AI progress. Most of my comments come in the form of a wish list for expanding and restructuring the coverage. Many of the sources for the data I would like to see added are hard to come by. But it is important not to fall for the streetlight fallacy: looking for the keys under the light rather than where they are likely to be. The data that are easy to get may not be the most informative. The data that are easy to get may not be the most informative. The most obvious weakness is how US-centric most of the data is. But the US data is the low hanging fruit. Hopefully the international AI community will help by crowdsourcing to fill in holes. EU and Canadian statistics may be the next easiest to get: for example, enrollment numbers for AI/ML introductory courses. EU funding for AI research and startups should be trackable. The data for Asia, China in particular, would be very significant; some of it is available. Noticing the lack of data source diversity brings to mind the lack of measures of geographical and gender diversity of AI researchers and practitioners. Under the Volume of Activity heading, along with Academia and Industry, Government should be added as a major subheading, with, for example, data on grant funding for AI research. Is there a way to measure regulatory activity and governance studies? Those activities are certainly ramping up but are they measurable in a meaningful way? !51
  • 52.
    ! ! AIINDEX, NOVEMBER 2017 Consider also adding an NGO category for the burgeoning number of organizations like AI2, OpenAI, WEF, and the Turing Institute. On the Academia front, it should be possible to get data on a) Talent supply from academia e.g. the number of M.Sc./Ph.D. AI/ML theses produced each year. Along with the ratio of #AI/#CS theses and b) Talent demand by academia e.g. the number of academic positions available that specify AI/ML (perhaps CRA job ads for postdocs and faculty). And the ratio of #AI/#CS positions. Two very popular indices would be AI salary measures in industry and academia. Headhunters, consultants and the CRA could help. Tricky to get reliable data but, at the moment, we really only have gossip and anecdotes in NYT stories. Putting Published Papers and Conference Attendance under Academia is a misclassification since Industry research is strong. Much of the Volume of Activity is independent of the Academia/Industry/Government/NGO split and should be lifted out. Additional useful measures would include conference paper submissions and AI books published/year, e.g. Amazon category. In terms of Technical Performance measures, progress on AI solving of Captchas could be a good metric. In the list of areas missing for Technological Advances, one important missing area not listed is Multi-Agent Systems (MAS). Two MAS activities that could be good candidates for metrics are RoboCup, with its 2050 target, and the Trading Agent Competitions (TACs). Some would argue that the Turing Test, with the Loebner Prize, would be a source of a good metric. It would be worth a brief discussion of why that is a good/bad idea. Indeed, some more meta-comments about the criteria for including indices would be useful. For those important activities that are (so far) hard to quantify, is it worth mentioning them just so that they are not overlooked? Finally, how about measures of meta-AI activity? It’s not clear how to quantify it but there is clearly an exponential growth of meta-AI institutes, organizations, partnerships, think tanks, and indices (like this one) concerned with studying AI itself, !52
  • 53.
    ! ! AIINDEX, NOVEMBER 2017 measuring AI, forecasting the impact of AI on society, employment, the economy, the law, government and the city. Can we quantify and forecast the growth and outcomes of meta-AI? Maybe there’s a joke in there somewhere about the meta-AI Singularity? !53
  • 54.
    ! ! AIINDEX, NOVEMBER 2017 Andrew Ng Coursera, Stanford AI is the new electricity AI is the new electricity, and is transforming multiple industries. The AI Index will help current generations track and navigate this societal transformation. It will also help future generations look back and understand the AI's rise. AI is a global phenomenon Further, AI is now a global phenomenon, and the AI Index reminds each of us we have to look beyond our own borders to understand global progress. The US and China are enjoying the greatest investments as well as the most rapid adoption, and Canada and UK also making groundbreaking research contributions. Since AI changes the foundation of many technology systems – everything ranging from web search, to autonomous driving, to customer service chatbots – it also gives many countries an opportunity to 'leapfrog" the incumbents in some application areas. Countries with more sensible AI policies will advance more rapidly, and those with poorly thought out policies will risk being left behind. Countries with more sensible AI policies will advance more rapidly, and those with poorly thought out policies will risk being left behind. !54
  • 55.
    ! ! AIINDEX, NOVEMBER 2017 Deep Learning transformation of AI sub-fields Deep Learning first transformed speech recognition, then computer vision. Today, NLP and Robotics are also undergoing similar revolutions. The recent improvements in speech and vision accuracy have led to a flourishing of applications using speech (such as voice controlled speakers) or computer vision (such as autonomous cars). Today, NLP's deep learning transformation is well underway; this will lead to a flourishing of new applications (such as chatbots). Deep Learning in robotics is also gaining significant momentum, and this too will lead to many new applications (such as new manufacturing capabilities). !55
  • 56.
    ! ! AIINDEX, NOVEMBER 2017 Daniela Rus Massachusetts Institute of Technology AI, a Vector for Positive Change Our world has been changing rapidly. Today, telepresence enables students to meet with tutors, and doctors to treat patients thousands of miles away. Robots help with packing on factory floors. Networked sensors enable monitoring of facilities, and 3D printing creates customized goods. We are surrounded by a world of possibilities. These possibilities will only get larger as we start to imagine what we can do with advances in artificial intelligence and robotics. On a global scale, AI will help us generate better insights into addressing some of our biggest challenges: understanding climate change by collecting and analyzing data from vast wireless sensor networks that monitor the oceans, the greenhouse climate, and the plant condition; improving governance by data-driven decision making; eliminating hunger by monitoring, matching and re-routing supply and demand, and predicting and responding to natural disasters using cyber-physical sensors.  It will help us democratize education through MOOC offerings that are adaptive to student progress, and ensure that every child gets access to the skills needed to get a good job and build a great life. It may even help those kids turn their childhood dreams into reality, as Iron Man stops being a comic book character and becomes a technological possibility. AI will help us generate better insights into addressing some of our biggest challenges. !56
  • 57.
    ! ! AIINDEX, NOVEMBER 2017 On a local scale, AI will offer opportunities to make our lives safer, more convenient, and more satisfying. That means automated cars that can drive us to and from work, or prevent life-threatening accidents when our teenagers are at the wheel. It means customized healthcare, built using knowledge gleaned from enormous amounts of data. And counter to common knowledge, it means more satisfying jobs, not less, as the productivity gains from AI and robotics free us up from monotonous tasks and let us focus on the creative, social, and high-end tasks that computers are incapable of. All these things –– and so much more! –– become possible when we direct the power of computing to problems that humans are not able to solve without support from machines. Advances are happening in three different and overlapping fields: robotics, machine learning, and artificial intelligence. Robotics puts computing into motion and gives machines autonomy. AI adds intelligence, giving machines the ability to reason. Machine learning cuts across both robotics and AI, and enables machines to learn, improve, and make predictions.  Progress is being made quickly in each of these fields. The AI index introduces several metrics to keep track of this progress. The metrics provide an important quantitative view on the state of education, research, and innovation in the field and provide insight into general trends. While AI has the potential to be a vector for incredible positive change, it is important to understand what today’s state of the art is: what today’s methods can and cannot do. The AI index is defining intelligence tasks and measuring the performance of the most advanced AI systems for those tasks. It also provides a framework for education in AI and for grand challenges in AI. AI can be a vector for incredible positive change; it is important to understand what today’s methods can and cannot do. !57
  • 58.
    ! ! AIINDEX, NOVEMBER 2017 The intelligence problem, how the brain produces intelligent behavior and how machines can replicate it, remains a profound challenge in science and engineering, that requires well trained researchers and sustained long-term research and innovation to solve. The AI index is tracking this progress. !58
  • 59.
    ! ! AIINDEX, NOVEMBER 2017 Megan Smith Susan Alzner 3rd CTO of the USA, shift7 UN Non-Governmental Liaison Service AI Index - Accelerate Our Progress on What’s Missing The goals outlined for this new annual report are important. Specifically the AI Index “...aims to facilitate an informed conversation about AI that is grounded in data” –– to share and support emerging context for the urgent multi-party conversation we need to be having within and across almost all communities globally.  This team is valiantly taking on responsibility to help support collaborative work on filling in voids in context and shared visibility that most people globally are experiencing. It notes “...without the relevant data for reasoning about the state of AI technology, we are essentially “flying blind” in our conversations and decision-making related to AI.” This ‘flying blind’ is especially true for people who are not working directly in this field today, particularly those who do not have a computer science or other related technical background – the vast majority of humanity. Diversity and Inclusion are paramount. We are missing the humanity due to bias, discriminatory cultural patterns, and learned behavior of systemic exclusion. The report includes a critical open section called “What’s Missing,” acknowledging there are many issues still to address (or even begin to consider or prioritize). Among these, diversity and inclusion are paramount. We are missing the majority of humanity from both the conversation and design teams due to massive conscious and !59
  • 60.
    ! ! AIINDEX, NOVEMBER 2017 unconscious bias, significant discriminatory cultural patterns, and learned behavior of systemic exclusion in almost all communities and in all forms of our media.  The impact of these emerging data-enabled AI/ML technologies on all people, and all life globally, is already significant, and we will see massive transformation across decades – with profound shifts even in the next few years. It is urgent that we rapidly and radically improve diversity and inclusion in all dimensions and at all levels in the technology sector, in dialogues and amongst decisions makers about technologies, and in applications of technology to all sectors. The report shares that “the field of AI is still evolving rapidly and even experts have a hard time understanding and tracking progress across the field.” We thank the teams and individuals across the world who are stepping up to build useful open forums and tools like this nascent index to welcome and engage far more people into a productive conversation.   Here are a few initial selected inputs for consideration: Future of AI 2016 - White House OSTP As part of beginning broad engagement on the topic of AI/ML, President Obama requested the Office of Science and Technology Policy (OSTP)  based U.S. CTO team to collaboratively champion a series of town hall conversations with other leaders including within government including the NSTC; these took place during the summer of 2016.  Information about those co-hosted open gatherings and subsequent report launched during the White House Frontiers Conference in October 2016, which included an AI national track. ‱ Preparing for the Future of Artificial Intelligence - workshops and interagency working group to learn more about benefits and risks of artificial intelligence. May 3 2016 BY ED FELTEN ‱ The Administration’s Report on the Future of Artificial Intelligence  - focuses on the opportunities, considerations, and challenges of Artificial Intelligence (AI). October 12, 2016 BY ED FELTEN AND TERAH LYONS !60
  • 61.
    ! ! AIINDEX, NOVEMBER 2017 Imperative: Broadening Participation and Applications, Training Integration of Ethics and Values We are in a deeply transformative time – where the Internet is just us, connected – and data is being  integrated now more than ever. Change is accelerating with AI/machine learning playing a larger role – data science, big data, AI/ML and emergent intelligence of communities connected are so significant. How do we avoid bad outcomes, whether ‘the robot apocalypse’ or massive destructive situations that Stephen Hawking, Elon Musk and others are urgently talking about, or just the squandering of the tremendous opportunities that AI/ML provides for improving human life (e.g. poverty, equality, hunger, justice, counteract bias, etc); we could help solve these challenges if we more rapidly broadened the scope of focus topics for AI application and added participation from so many more people in these sectors. Either way, we need to integrate our shared values into these systems and expand the surface area of creativity engaged as soon as possible. Consider this: do we really want to train all of this technology using just the data sets that share what we do? We do good things but humanity does some pretty bad things too.  This technology gets weaponized just as it gets used for good. Today, technology is neither good nor bad, it’s just what gets designed in and what we do with it, including unintended applications, bias, and malicious iterations. So many more of us have to become much more “woke” about the fact that this shift is happening rapidly, scrub ourselves in, have the hard conversations about ethics, and move to take action. We need to have discussions about weaponized AI and explore controls and other options we can put into place. Let’s try for what we wish could be true, let's engage. And even then, Diane Von Furstenberg and Elon talk about us being the ‘pets’ for the future AI. There are some important documents on these topics - especially United Nations and other texts which share globally agreed values, including: ‱ 2030 Agenda for Sustainable Development & SDGs !61
  • 62.
    ! ! AIINDEX, NOVEMBER 2017 ‱ Universal Declaration of Human Rights ‱ Declaration on Rights of Indigenous Peoples ‱ Beijing Declaration and Platform for Action on women’s human rights ‱ Convention on the Rights of Persons with Disabilities ‱ International Covenant on Economic, Social and Cultural Rights ‱ IEEE Ethically Aligned Design General Principles - esp Principle 1 on Human Benefit lists (p16) At MIT’s Commencement June 2017 Tim Cook, CEO of Apple Computer, said: “I’m not worried about artificial intelligence giving computers the ability to think like humans. I’m more concerned about people thinking like computers without values or compassion, without concern for consequences. That is what we need you to help us guard against. Because if science is a search in the darkness, then the humanities are a candle that shows us where we’ve been and the danger that lies ahead. As Steve [Jobs] once said, technology alone is not enough. It is technology married with the liberal arts married with the humanities that make our hearts sing. When you keep people at the center of what you do, it can have an enormous impact.” We need to be broadly aware of leadership work by organizations, associations and individuals collaborating to take action - for example: ‱ The Algorithmic Justice League (www.ajlunited.org/), which highlights algorithmic bias, provides space for people to voice concerns and experiences with coded bias, and develops practices for accountability. ‱ The petition to the UN urging rapid action on weaponized AI to compel us to globally engage asap on this topic. ‱ The Computer Science for All Movement (CSforAll - csforallconsortium.org/) for tech inclusion in the U.S. and in other countries. ‱ The AI4All initiative (ai-4-all.org/), to train a new and more diverse generation of future AI technologists, thinkers, and leaders. !62
  • 63.
    ! ! AIINDEX, NOVEMBER 2017 ‱ Work to capacity-build sectors that are not yet using much AI/ML to advance solutions - so that any topic of need might leverage this technology for positive impact. ‱ Work to add technical people with expertise on these topics into organizations that have not traditionally included people with such capability (Including “TQ” – tech quotient in the every room – e.g. for governments “TQ in Public Policy” The first version of this AI Index launching today is nascent, incomplete, most likely naive in ways we don’t even understand yet, and what’s great is it’s a start – using an open collaborative approach – on a long journey ahead where we can not see our varied future destinations. Recently Cathy O’Neil, author of the book “Weapons of Math Destruction,” wrote an op-ed “The Ivory Tower Can’t Keep Ignoring Tech” (New York Times Nov 14, 2017) urging academics from all sectors to engage. We agree, and also invite and hope everyone, especially youth, will opt-into this conversation –– because most importantly, the AI Index includes an invitation to us all. The first version of this AI Index is nascent, incomplete, most likely naive in ways we don’t even understand yet, and what’s great is it’s a start. !63
  • 64.
    ! ! AIINDEX, NOVEMBER 2017 Sebastian Thrun Stanford, Udacity The importance of recent progress in Artificial Intelligence cannot be overstated. The field of AI has been around for more than 60 years, and it has had significant impact. AI is at the core of Google's search algorithms, Amazon's site design and Netflix's movie recommendations. But the advent of powerful computers paired with data set of unprecedented scale will be a game changer for society. In just the past few years, systems have been developed that rival or even outperform highly skilled people. Deep Mind's AlphaGo beats the world's best go players. In our own lab, we found that AI systems can diagnose skin cancer in images more accurately than some of the best board-certified dermatologists. I have long maintained that the Google self-driving car drives better than average drivers like myself. And the team is now operating these cars on public roads without the need of a safety driver. And Cresta, a start-up company, has shown that AI systems teamed with human specialists can double the efficacy of online sales teams. I believe that in the not-so-distant future, AI will be able to free us from repetitive work. AI systems will be able to watch human experts at work, and gradually acquire the skills we bring to bear in our daily work. As this happens, more and more repetitive work will be done by the machines, freeing us up to pursue more creative work. This revolution has a parallel in history. Prior to the invention of the steam engine, most of us were farmers. Most people were defined through their physical strength and agility (and not the brilliance of their minds), performing highly repetitive work in the fields. But machines have turned farmers into super-humans. According to FarmersFeedUS.org, one American farmer feeds 155 people. As a result, less than 2% of the US population works in agriculture. This has freed up 98% of us to find different jobs. About 75% of the US labor force works in offices. We have become lawyers, !64
  • 65.
    ! ! AIINDEX, NOVEMBER 2017 accountants, doctors, software engineers. Most of our work is highly repetitive. It is conceivable that today's AI technology can learn the patterns in our repetitive work, and help us do this work faster. Eventually we will all become super-human, aided by AI to organize our lives and our understanding of the world. Is this good or is this bad? I predict history will look back as a massive advancement of humanity. As many of us stopped engaging in repetitive physical labor, we became more educated, we became more inventive. With this new revolution, I predict we will enter an era of unprecedented human creativity. With this new revolution, I predict we will enter an era of unprecedented human creativity. But it also pushes burdens on people. It has been estimated that one ninth of jobs are in jeopardy if self-driving taxis become the dominant method of daily transportation. To stay ahead of those changes, we have to become lifelong learners. We have to acquire new skill sets and learn to master new technologies. As a society, we need to find new ways to help all of us adapt to those changes. This report is important. It diligently investigates the recent advances in AI, and documents its effect on society. I applaud the authors for putting together such a carefully researched report. I hope this report will constructively contribute to the much needed public discussion on AI. If we master this challenge, if we are prepared, and if we lead, the future will be amazing. For all of us. !65
  • 66.
    ! ! AIINDEX, NOVEMBER 2017 Michael Wooldridge Oxford The AI Index report makes for fascinating reading, from my perspective as an AI researcher, as Head of Department of Computer Science at the University of Oxford, and also as someone has served as president of the International Joint Conference on AI (http://www.ijcai.org/), and as president of the European Association for AI (http:// www.eurai.org/). The report presents compelling and comprehensive evidence that on a range of fronts, AI techniques are making steady progress on core problems that have been associated with AI since its earliest days (game playing, machine translation, theorem proving, question answering, and so on); in many of these, AI is already at or above the accepted level of human expertise. The report also provides pretty clear evidence – as if evidence were really needed – that AI is attracting the attention of students and industry, with admissions exploding on AI courses, and a huge growth in AI startup companies. There is, clearly, an AI bubble at present; the question that this report raises for me is whether this bubble will burst (cf. the dot com boom of 1996-2001), or gently deflate; and when this happens, what will be left behind? My great fear is that we will see another AI winter, prompted by disillusion following the massive speculative investment that we are witnessing right now. There are plenty of charlatans and snake oil salesmen out there, who are quite happy to sell whatever they happen to be doing as AI, and it is a source of great personal frustration that the press are happy to give airtime to views on AI that I consider to be ill-informed at best, lunatic fringe at worst (for a good recent example, see: http://tinyurl.com/y9g74kkr). However, while I think some deflation of the current bubble is inevitable within the next few years, I think there is cause for hope that it will be a dignified and gentle deflation, rather than a spectacular bust. The main reason for this is that, as the AI Index clearly demonstrates, AI is delivering on competence. Across a wide spectrum of !66
  • 67.
    ! ! AIINDEX, NOVEMBER 2017 tasks, AI systems are showing steadily (sometimes rapidly) increasing performance, and these capabilities are being deployed with great success in many different application areas. To put it another way, I think there is substance underneath the current AI bubble, and major companies now understand how to use AI techniques productively. Because there is demonstrable substance, and demonstrable (in the scientific sense) progress, I don’t believe we will see the backlash associated with the AI winter and the end of the expert systems boom. (I look forward to reading the AI Index report for 2027, to see how this prediction pans out). I think there is substance underneath the current AI bubble. There is one aspect of AI which is not reflected in the “technical performance” section of the AI Index report, and for entirely understandable reasons. That is progress towards general AI. The main reason general AI is not captured in the report is that neither I nor anyone else would know how to measure progress. The closest in the report currently is question answering, which could be understood as demonstrating comprehension of a kind, but that is not quite general AI. I don’t think the Turing test is an appropriate measure of general AI, however influential and ingenious it is, for reasons that will be well-known to an AI audience. So how might we test progress towards general AI? This seems particularly important if only to address or dispel fears about a sudden possible rise in general AI competence – fears which still seem to preoccupy much of the press and presumably many of the lay public. !67
  • 68.
    ! ! AIINDEX, NOVEMBER 2017 GET INVOLVED! We believe initiatives to understand the progress or impact of AI technologies cannot succeed without engaging a diverse community. No initiative to understand the impact of AI technologies can succeed without engaging a diverse community. There are many ways, large and small, that you can support the AI Index and we would love to get you involved. Share Feedback on the AI Index 2017 Report We want to hear your perspective on the data in this report, what you feel we are missing, and what opportunities you think we should take advantage of when collecting about communicating about data related to AI. Feel free to write us a thorough review over email or your quick take on Twitter at @indexingai. Open Up Your Data Reach out to us if you or your organization have the ability to share relevant data. We partnered with a large set of organizations to generate this report and strong partnerships will continue to be a cornerstone of the AI Index’s operating model going forward. Provide Domain Knowledge Future iterations of the AI Index report will quantify how AI impacts specific verticals, such as healthcare, transportation, agriculture etc. We must work with professionals across industries to accomplish this. If you or an organization you know of might be a resource in tracking the impact of AI in specific areas, please get in touch with us. !68
  • 69.
    ! ! AIINDEX, NOVEMBER 2017 Correct Us We want to keep the information we provide as accurate as possible. Still, we collected data from a wide variety of sources and may have made mistakes in our aggregation process. Let us know if you see any errors and we will update the version of this PDF and any information on our website. Support Data Collection for the AI Index There will always be more data about AI than we can collect and organize. We would love to work with you to collect the information that is most important. If you know of a useful data source we have missed or a metric we should be tracking, send us a quick message to put us on the right track. Help Us Go International We have already begun working with international partners to collect data that goes beyond the United States. If you have relevant international data we would love to hear from you. Get in Touch! Did any of the findings in this report surprise you? Is there something you can’t believe we left out? Reach out to us on Twitter @indexingai or contact us at feedback@aiindex.org. Lastly, to get periodic updates about the AI Index and about the current state of AI, please subscribe for email updates at aiindex.org. !69
  • 70.
    ! ! AIINDEX, NOVEMBER 2017 ACKNOWLEDGEMENTS The AI Index is indebted to the One Hundred Year Study on AI at Stanford University (AI100), which incubated and provided seed funding for launching the Index. We were also graciously supported in various ways by the following individuals at Stanford: Tom Abate, Amy Adams, Russ Altman, Tiffany Murray, Andrew Myers. We also gratefully acknowledge the additional startup funds provided by Google, Microsoft and Bytedance (Toutiao). However, the AI Index is an independent effort and does not necessarily reflect the views of these organizations. In this startup phase the AI Index has benefitted from the wisdom and advice of its advisory committee, whose members include: Michael Bowling, Ernie Davis, Julia Hirschberg, Eric Horvitz, Karen Levy, Alan Mackworth, Tom Mitchell, Sandy Pentland, Chris RĂ©, Daniela Rus, Sebastian Thrun, Hal Varian, and Toby Walsh. We are also indebted to the Expert Forum contributors, some of whom are on our advisory committee listed above, whose contributions to this report and to the ongoing discussions of the place of AI in society are invaluable: Susan Alzner, Barbara Grosz, Eric Horvitz, Kai-Fu Lee, Alan Mackworth, Andrew Ng, Daniela Rus, Megan Smith, Sebastian Thrun, Michael Wooldridge. We also appreciate the advice and support we received from the following individuals: Toby Boyd, Kevin Leyton-Brown, Miles Brundage, AJ Bruno, Jeff Dean, Catherine Dong, Peter Eckersley, Stefano Ermon, Oren Etzioni, Carl Germann, Marie Hagman, Laura Hegarty, Holger Hoose, Anita Huang, Dan Jurafsky, Kevin Knight, Jure Leskovec, Tim Li, Terah Lyons, Mariano Mamertino, Christopher Manning, Gary Marcus, Dewey !70
  • 71.
    ! ! AIINDEX, NOVEMBER 2017 Murdick, Lynne Parker, Daniel Rock, Amy Sandjideh, Skyler Schain, Geoff Sutcliffe, Fabian Westerheide, Susan Woodward. And the various organizations these individuals represented that provided data for the inaugural report: Allen Institute for Artificial Intelligence, Crunchbase, Electronic Frontier Foundation, Elsevier, EuroMatrix, Google Brain, Indeed.com, Monster.com, Sand Hill Econometrics, Sinovation Ventures, TrendKite, VentureSource. We thank the following individuals for their help in acquiring conference attendance data: Chitta Baral, Maria Gini, Carol Hamilton, Kathryn B. Laskey, George Lee, Andrew McCallum, Laurent Michel, Mary Ellen Perry, Claude-Guy Quimper, Priscilla Rasmussen, Vesna Sabljakovic-Fritz, Terry Sejnowski, Brian Williams, Ramin Zabih. And we thank the following individuals for their help in acquiring course enrollment data: Lance Fortnow, Charles Isbell, Leslie Kaelbling, Steven Lavalle, Dan Klein, Lenny Pitt, Mehran Saham, Tuomas Sandholm, Michael-David Sasson, Manuela Veloso, Dan Weld. We could not have created this report without the contributions, large and small, of all the individuals on this list. We thank them and hope to continue engaging a large community as we work to ground conversations about Artificial Intelligence. !71
  • 72.
    ! ! AIINDEX, NOVEMBER 2017 APPENDIX A: DATA DESCRIPTION & COLLECTION METHODOLOGY A1. Published Papers return to published papers section Primary Sources & Data Sets Elsevier’s Scopus database of academic publications, which has indexed almost 70 million documents (69,794,685). See more information about Scopus. Definition of Collected Data The number of academic papers published each year that have been indexed by the Scopus catalog in the subject area “Computer Science” and have been indexed with the key term “Artificial Intelligence”. For reference: ‱ The entire Scopus database contains over 200,000 (200,237) papers in the field of Computer Science that have been indexed with the key term “Artificial Intelligence”. ‱ The Scopus database contains almost 5 million (4,868,421) papers in the subject area “Computer Science”.‹ Both numbers cited above, as well as the number of total publications in the Scopus database, were recorded November 2017. Data Collection Process We made queries to the Scopus database of published academic papers to count the number of AI-related papers, the number of papers in the Computer Science subject !72
  • 73.
    ! ! AIINDEX, NOVEMBER 2017 area, and the number of papers in the total database. For example, the queries used to obtain the count of the relevant papers for the year 2000 are: AI query title-abs-key(artificial intelligence) AND SUBJAREA(COMP) AND PUBYEAR AFT 1999 AND PUBYEAR BEF 2001 CS query SUBJAREA(COMP) AND PUBYEAR AFT 1999 AND PUBYEAR BEF 2001 All Scopus query PUBYEAR AFT 1999 AND PUBYEAR BEF 2001 Queries were made for each year from 1996 to 2016. Elsevier also provided access to the Scopus API to automate the process of extracting data from Scopus. For more information about fields in Scopus’ query language, see Scopus Field Specification. For more information about Elsevier’s APIs, see the Elsevier API documentation. For more information about the Scopus search API, see the search API documentation. Nuances The Scopus system is retroactively updated. As a result, the number of papers the Scopus system returns for a given query may increase over time. For example, the query “SUBJAREA (COMP) AND PUBYEAR BEF 2000” may return a larger and larger number of papers over time as Scopus’ coverage grows more comprehensive. !73
  • 74.
    ! ! AIINDEX, NOVEMBER 2017 Members of the Elsevier team commented that data about papers published after 1995 would be the most reliable and that their system’s data processing was more standardized after this date. For this reason, we only collect data on papers published in 1996 or later from the Scopus source. Scopus captures a wide range of sources. Their indexing technique and query language also makes it easy to identify papers related to a particular topic. Other viable sources of data about published papers include Web of Knowledge, Microsoft Academic, DBLP, CiteSeerX and Google Scholar. While the total number of papers and the specific sources captured differs for each system, we expect that the trend in paper publishing growth should remain mostly constant across databases. !74
  • 75.
    ! ! AIINDEX, NOVEMBER 2017 A2. Course Enrollment return to course enrollment section Primary Sources & Data Sets University enrollment records. Enrollment data was collected from the following universities: University of California Berkeley, Carnegie Mellon University, Georgia Institute of Technology, University of Illinois Urbana Champaign, Massachusetts Institute of Technology, Stanford, and University of Washington. Definition of Collected Data The number of students enrolled in representative undergraduate AI and ML courses at a selection of universities for each academic year. The “academic year” begins with Fall of that year. Collection Process We reached out to representatives at each university who facilitated the identification of AI & ML courses and the collection of enrollment data from school records. Nuances Intro AI & ML courses were selected, despite many universities’ additional course offerings beyond introductory classes. These courses are more consistent across universities and easy to distinguish. Many universities had more demand from students to take the introductory AI & ML courses than they could support. Our data only represents what universities were able to provide. !75
  • 76.
    ! ! AIINDEX, NOVEMBER 2017 Some of the particularly strong upticks and downticks between given years are a result of administrative quirks, not student interest. For example, our contact at Stanford explained the downtick in ML course enrollment between 2015 and 2016 as follows: “The ML class is usually only taught once per year.  But in 2015-16 it was taught twice (once in Fall and once in Spring).  The Spring quarter offering wasn’t listed until after Fall quarter enrollment had already occurred.  So, I’d imagine (based on intuition, not hard data) that the Spring offering in 2015-16 siphoned some of the students who would have otherwise taken it in Fall 2016-17, leading to a lower enrollment in Fall 2016-17.  So, really there should be some smoothing going on in the enrollments between 2015-16 and 2016-17.  I don’t believe there was actually a real decline in interest in the ML course.” !76
  • 77.
    ! ! AIINDEX, NOVEMBER 2017 A3. Conference Attendance return to conference attendance section Primary Sources & Data Sets The records of organizations that host AI-related conferences. Data was collected for the following conferences: AAAI, AAMAS, ACL, CP, CVPR, ECAI, ICAPS, ICRA, ICLR, ICML, IJCAI, IROS, KR, NIPS, UAI. Definition of Collected Data The number of attendees present at a selection of academic conferences related to artificial intelligence and its subfields. We defined “large conferences” to be those with more than 1000 attendees in 2016. “Small conferences” are defined as those with less than 1000 attendees in 2016. Data Collection Process The AI Index team worked with conference organizers and the leaders of sponsoring organizations to collect attendance data for each conference. Nuances of Data Not all conference organizing teams had all attendance data accessible. Many of the leadership teams noted that attendance data was missing for some years and some could only report approximations. From our review, it seems appropriate to accept the estimates provided by the various leadership teams as accurate. Not all conferences are run annually, and some conferences have skipped years.
 !77
  • 78.
    ! ! AIINDEX, NOVEMBER 2017 A4. AI-Related Startups return to AI-related startups section Primary Sources & Data Sets Crunchbase VentureSource, the comprehensive database of venture backed companies Sand Hill Econometrics, a provider of indices for venture backed private companies Definition of Collected Data The number of active startups each year identified as developing or deploying AI systems. Data Collection Process We first collected a list of all organizations with an AI-related category label in Crunchbase. To obtain the set of category labels we reviewed the set of all categories in Crunchbase and chose a set we felt captured areas of AI technology, listed below. We obtained the category labels and the list of organizations through the Crunchbase API, provided to us by Crunchbase. This list of organizations from Crunchbase was then cross-referenced with the list of all venture-backed companies in the VentureSource database. Any venture backed companies from the Crunchbase list that were identified in the VentureSource database were included. VentureSource also associates keywords with each company. Any company with “AI” or “Machine Learning” in the VentureSource keywords was also included in the set of relevant startups. See more about the Crunchbase API here. See a list of Crunchbase Categories here. !78
  • 79.
    ! ! AIINDEX, NOVEMBER 2017 All interaction with the VentureSource product was conducted by Sand Hill Econometrics. Nuance List of Crunchbase “category” labels used to identify AI companies: Artificial Intelligence, Machine Learning, Natural Language Processing, Computer Vision, Facial Recognition, Image Recognition, Speech Recognition, Semantic Search, Semantic Web, Text Analytics, Virtual Assistant, Visual Search, Predictive Analytics, Intelligent System. Determining which companies are “AI related” has no simple answer. Our heuristics currently favor machine learning technologies. !79
  • 80.
    ! ! AIINDEX, NOVEMBER 2017 A5. AI-Related Startup Funding return to AI-related startup funding section Primary Sources & Data Sets Crunchbase VentureSource, the comprehensive database of venture backed companies Sand Hill Econometrics, the premier provider of indices for venture backed private companies Definition of Collected Data The data displayed is the amount of funding invested each year by venture capitalists into startups where AI plays an important role in some key function of the business. Data Collection Process The set of companies for the AI-Related Startups section was used (see description). The investment data about this set of companies was then retrieved from VentureSource and aggregated to provide yearly funding data. All interaction with the VentureSource product was conducted by Sand Hill Econometrics. !80
  • 81.
    ! ! AIINDEX, NOVEMBER 2017 A6. Job Openings return to job openings section Primary Sources & Data Sets Indeed.com Monster.com Definition of Collected Data The Indeed.com data represents the share of jobs in each country that require AI skill, normalized to the share percentage in January 2013. The Monster.com data represents the absolute number of AI related job openings over time, broken down by jobs that require specific skills in AI subfields. Note that the jobs in the breakdown may overlap. For example, a job requiring Machine Learning skills could also require Natural Language Processing skills. This job would be double counted in the breakdown graph. Data Collection Process We worked with the Indeed and Monster teams directly to obtain this data. Indeed.com and Monster used different processes for identifying AI jobs and provided different kinds of data about AI job growth data. Indeed.com first identified a range of job titles that had AI-related keywords in the associated job listing more than 50% of the time. The keywords used: Artificial Intelligence, Machine Learning, Natural Language Processing. Natural Language Processing was found to be associated with over 90% of job titles that had the other AI keywords in the description. Once these job titles were obtained, Indeed looked at, for each country, what percentage of total jobs were AI-related in !81
  • 82.
    ! ! AIINDEX, NOVEMBER 2017 that country. They tracked this percentage over time and returned the data to us, normalized starting at the  value in 2013. Using data provided by CEB's TalentNeuron tool, Monster identified the number of job postings in the U.S. that included "artificial intelligence" as a required skill for 2015, 2016, and YTD 2017 (through Nov 10). To create the breakdown, the same tool was used for skills requiring “artificial intelligence” in addition to another skill keyword like “computer vision”. !82
  • 83.
    ! ! AIINDEX, NOVEMBER 2017 A7. Robot Imports return to robot imports section Primary Sources & Data Sets World Robotics Report, produced annually by the International Federation of Robotics. Definition of Collected Data The data displayed is the number of industrial robots imported each year into North America and Internationally. Industrial robots are defined by the ISO 8373:2012 standard. Data Collection Process The International Federation of Robotics’ annual World Robotics Report contains data about the volume of robot imports into North America and Internationally. We extracted shipment data since the year 2000 from these reports. Nuances It is unclear how to identify what percentage of robot units run software that would be classified as “AI” and it is unclear to what extent AI development contributes to industrial robot usage.
 !83
  • 84.
    ! ! AIINDEX, NOVEMBER 2017 A8. GitHub Project Statistics return to GitHub project statistics section Primary Sources & Data Sets GitHub Archive GitHub Archive on BigQuery Definition of Collected Data The number of Stars for various GitHub repositories overtime. The repositories included: apache/incubator-mxnet, BVLC/caffe, caffe2/caffe2, dmlc/mxnet, fchollet/keras, Microsoft/CNTK, pytorch/pytorch, scikit-learn/scikit-learn, tensorflow/tensorflow, Theano/Theano. Collection Process GitHub archive data is stored on Google BigQuery. We interfaced with Google BigQuery to count the number of “WatchEvents” for each repository of interest. A sample of code for collecting the data over the course of 2016 is displayed on the next page: !84
  • 85.
    ! ! AIINDEX, NOVEMBER 2017 SELECT project, YEAR(star_date) as yearly, MONTH(star_date) as monthly, SUM(daily_stars) as monthly_stars‹ ‹ FROM (‹ SELECT repo.name as project, DATE(created_at) as star_date, COUNT(*) as daily_stars‹ FROM TABLE_DATE_RANGE( [githubarchive:day.], TIMESTAMP(“20160101"), TIMESTAMP(“20161231"))‹ WHERE repo.name IN ( “tensorflow/tensorflow", “fchollet/keras", “apache/incubator-mxnet", “scikit-learn/scikit-learn", "caffe2/caffe2", "pytorch/pytorch", "Microsoft/CNTK", “Theano/Theano", "dmlc/mxnet", "BVLC/caffe")‹ AND type = ‘WatchEvent’ GROUP BY project, star_date‹ )‹ GROUP BY project, yearly, monthly‹ ORDER BY project, yearly, monthly !85
  • 86.
    ! ! AIINDEX, NOVEMBER 2017 Nuances The GitHub Archive currently does not provide a way to count when users remove a Star from a repository. Therefore, the data reported slightly over estimates the count of Stars. Comparison with the actual number of Stars for the repositories on GitHub shows that the numbers are fairly close and the trends remain unchanged. There are other ways to retrieve GitHub star data. The star-history tool was used to spot-check our results. Forks of GitHub project are also interesting to investigate. We found that the trends of repository Stars and Forks were almost identical. However, if you are interested in looking at the absolute Fork data, you can find the data on our website at aiindex.org, or use the BigQuery code above with type=‘ForkEvent’ instead of type=‘WatchEvent’). !86
  • 87.
    ! ! AIINDEX, NOVEMBER 2017 A9. Sentiment of Media Coverage return to sentiment of media coverage section Primary Sources & Data Sets TrendKite Definition of Collected Data The TrendKite service indexes general media articles and they employ a sentiment analysis classifier that categorizes articles as “positive”, “negative”, or “neutral”. We display the percentage of articles categorized as positive and negative (the remaining articles are neutral). Collection Process We used the below query to identify AI articles. We adjusted it to remove a source that introduced a disproportionate amount of irrelevant articles with negative sentiment. Query ”Artificial Intelligence” AND NOT “MarketIntelligenceCenter.com’s" NOT site_urls_ll:( “individual.com" OR "MarketIntelligenceCenter.com") TrendKite picks up articles from many sources, but provides filters to make searches more relevant. We employed filters that: ‱ Only included English-language articles ‱ Removed press releases ‱ Removed financial news ‱ Removed obituaries !87
  • 88.
    ! ! AIINDEX, NOVEMBER 2017 With this data we intend to share the general public interest in AI and coverage of AI for the general public. This filters helped us simplify the space that our signal is drawn from. !88
  • 89.
    ! ! AIINDEX, NOVEMBER 2017 A10. Object Detection return to object detection section Primary Sources & Data Sets LSVRC ImageNet Competition 2010 - 2017 ImageNet Data Set Definition of Collected Data The accuracy of the winning teams in the object detection challenges for the LSVRC ImageNet competition since 2010. See definition of metrics on the LSVRC website. Data Collection Process We collected the competition data from the leaderboards for each LSVRC competition hosted on the ImageNet website. Nuances The ImageNet competition is finished as of 2017. It may be possible to continue surveying the literature for new state of the art results on ILSVRC test sets, but it is likely that new benchmarks may need to be identified and tracked. The estimate of human-level performance is from Russakovsky et al, 2015. !89
  • 90.
    ! ! AIINDEX, NOVEMBER 2017 A11. Vision Question Answering return to visual question answering section Primary Sources & Data Sets Arxiv (For literature review) VQA Data Set The VQA data set consists of images, questions about the content of those images, and 10 human-generated answers to those questions. Definition of Collected Data The data collected represents the accuracy of each AI system to produce open-ended answers to questions about images (in contrast to producing answers to multiple choice questions about images). Accuracy is defined as in the original VQA paper. We collect the accuracies reported in academic papers when state-of-the-art results were achieved. Data Collection Process We performed a literature review to identify when papers achieved new state-of-the- art results on the VQA 1.0 data set between 2016 and 2017. Nuances of Data In conducting our literature review it is quite possible that we missed results which would slightly alter the timeline of new state-of-the-art achievements. Ensembles were considered, not just single models. With ImageNet closing as a competition driving progress in vision tasks, we decided to survey the landscape of progress in the Visual Question Answering domain. It seems !90
  • 91.
    ! ! AIINDEX, NOVEMBER 2017 there may not be an “ImageNet” replacement in the near future however, and we may need to continue measuring punctuated progress, as we have done with VQA, until a more dominant benchmark arises. VQA 1.0 was retired shortly after it’s release in favor of VQA 2.0 which, among other things, adds more data in an attempt to debias aspects of the data set. !91
  • 92.
    ! ! AIINDEX, NOVEMBER 2017 A12. Parsing return to parsing section Primary Sources & Data Sets Penn Treebank The Wall Street Journal portion of the Penn Treebank is a data set of sentences annotated with a constituency-based parse tree for each sentence. Section 23 of this data set has become the primary test set for research into automatic parsers. Definition of Collected Data Automatic parsers are evaluated by comparing the constituents of automatically generated parses to the constituents in gold parses from a test set. The precision and recall of the generated constituents are combined and reported as the F1 score. We report is the F1 score of parsers on sentences in section 23 of the WSJ portion of the Penn Treebank. We report these scores for sentences of length <40 words and on the entire set of sentences where each are available. Learn more about Constituency- based parse trees on the wikipedia page for parse trees. Data Collection Process We conducted a literature review to identify when new parsers increased the state of the art in automatic parsing. We collected the F1 scores of parsers we identified going back to 1995. Ensembles were included, not just single models. Nuances of Data In the early days of automatic parsing research, parsers were typically evaluated only on sentences of length <40 words and length <100 words for computational and methodological reason. We have recorded the F1 scores of systems on sentences of length <40 words and on all sentences in the corpus when available.
 !92
  • 93.
    ! ! AIINDEX, NOVEMBER 2017 A13. Machine Translation return to machine translation section Primary Sources & Data Sets Conference / Workshop on Machine Translation (WMT) news translation task EuroMatrix There is an annual Conference on Machine Translation, which spun out of an annual Workshop on Machine Translation. Each year WMT hosts a news translation task and provides new training and test data sets. Teams of attendees submit the translation systems they have built to participate in the translation task. Definition of Collected Data The main metric used by WMT aims at ranking the competing entries and does not allow year-over-year comparisons.  It is also very labor intensive.  We have fallen back on BLEU, an automatic method that does a rough comparison of the system translation to a number of human-generated translations.  It is a modified version of precision, between 0 and 1, where higher is better. One can also calculate the average BLEU score of a machine translation system on a corpus of translation pairs. For each year, we have recorded the highest average BLEU score achieved by a system submitted to that year’s news translation task for English to German and German to English. See below for the nuances of the WMT translation task and the BLEU metric. Data Collection Process EuroMatrix has recorded the BLEU scores of submissions to the news translation task since 2006 on the English to German and German to English language pairs. We selected the BLEU score of a top performing system each year, specifically using BLEU (11b), which defines a protocol for tokenizing sentences. When possible, we selected !93
  • 94.
    ! ! AIINDEX, NOVEMBER 2017 the score of a system that had a high-ranking BLEU score in both pairs as the representative for that year. See the implementation of 11b tokenization in the linked file. Nuances of the Data BLEU can be computed automatically and it has been shown to correlate with human judgement of translation quality. However, the metric cannot be used across corpuses and it can misleading to compare BLEU scores between systems. While the graphs trends upward generally, we can see one way this metric is flawed in 2017, when the BLEU scores fell significantly compared to the 2016 scores (though, the 2017 scores are still higher than the 2015 scores). It is unlikely that the performance of MT systems declined compared to 2016, but the evaluation scheme presented here is not perfect. However, looking at trends over larger time periods, the BLEU score can give an indication of progress in the area of machine translation. !94
  • 95.
    ! ! AIINDEX, NOVEMBER 2017 A14. Question Answering return to question answering section Primary Sources & Data Sets Stanford Question Answering Dataset The Stanford Question Answering Dataset (SQuAD) is a data set of over 500 articles and 100,000 question-answer pairs associated with the articles. Given a question about the content of an article, the task is to identify the answer within the article. Definition of Collected Data The chosen evaluation metric on this data set is “Exact Match” (EM), the percentage of answers generated by a system that exactly match the answer in the test set. The data displayed is the state-of-the-art EM score of question-answering systems on the SQuAD data set over time. Data Collection Process We collected the results from the leaderboard hosted at the SQuAD website. Nuances of Data All answers in the SQuAD data set are direct quotes from the associated article. Therefore, the job of the system is really to identify what subsection of the given article contains the answer to the posed question. While easy to track, it is not clear how long the SQuAD data set will be of interest. Scores for the task have risen rapidly since SQuAD’s introduction in June 2016. The Exact Match score of humans on this data set is reported to be 82.304.
 !95
  • 96.
    ! ! AIINDEX, NOVEMBER 2017 A15. Speech Recognition return to speech recognition section Primary Sources & Data Sets Switchboard Hub5’00 data set (Speech and Transcripts). EFF AI Progress Metrics Definition of Collected Data The state-of-the-art Word Error Rate (WER) of trained speech recognition systems on the standard Switchboard Hub5’00 data set over time. WER is the number of errors -- word substitutions, deletions and insertions-- needed to map the transcription to the gold standard, normalized by the length of the sentence.  We plot Word Accuracy, or 1 - WER to keep the direction of progress consistent across graphs. Data Collection Process The Electronic Frontier Foundation previously performed a literature review to extract performance of speech recognition systems on the HUB5’00 data set. We simply display these results in our report. Nuances of Data The Switchboard data set has been in use for a long time. There is concern that our AI systems may be significantly overfit to this specific data and that further progress on this data set may be less indicative of overall progress in the field going forward. There has recently been some disagreement about what the human performance for WER on the Switchboard HUB5’00 data set actually is. There have been reports of 5.1% and 5.9%, and even reports of below 5%. In this report we choose to use the 5.1% measure as the bar for human performance. !96
  • 97.
    ! ! AIINDEX, NOVEMBER 2017 A16. Theorem Proving return to theorem proving section Primary Sources & Data Sets Thousands of Problems for Theorem Provers (TPTP) TPTP is a large set of Theorem Proving problem instances. Definition of Collected Data The Automatic Theorem Proving (ATP) community has developed a method for determining how “difficult” a given problem instance is to solve with current ATP technology. We record the average difficulty of a subset of TPTP problems over time. The chosen TPTP problems are those which have not been updated since TPTP v5.0.0 (year 2010). We graph 1 - Difficulty and title this “Tractability” to maintain a consistent direction of progress across graphs. See the definition of TPTP problem difficulty in a paper by the TPTP maintainer. See a visual example of how the difficulty of a given TPTP problem instance is calculated. Data Collection Process The TPTP data set includes the difficulty of each problem at each version. We wrote scripts to extract these difficulties from the desired subset of TPTP problem instances and to compute the average difficulties the relevant problems problems over time. The scripts will be made available on the AI Index website at aiindex.org. Nuances of Data The definition of TPTP problem difficulty used by the community has some quirks. It is dependent on the set of available ATP systems. It is possible for a problem to become !97
  • 98.
    ! ! AIINDEX, NOVEMBER 2017 more difficult over time if many useful ATP systems are created that cannot solve the problem. See a review of the TPTP v6.4.0 data set by its maintainer. !98
  • 99.
    ! ! AIINDEX, NOVEMBER 2017 A17. SAT Solving return to SAT Solving section Primary Sources & Data Sets SAT Competition SAT Solver Performance Data The SAT competition has an “industrial” track for problem instances that take the form of practical problems. Holger Hoos and Kevin Leyton-Brown took 69 solvers and 1076 problem instances that have been a part of the competition since 2007 and ran each solver on each problem on the same hardware. Definition of Collected Data For each year, we take the average of the percentage of problems (all problems in the competition since 2007) completed by solvers submitted that year as well as the percentage of problems solved by the best solver. Collection Process Hoos & Leyton-Brown collected the performance of each solver on each problem. We simply aggregated the data to produce the score described above. Nuances This metric will improve simply with processor speed, although Hoos and Leyton- Brown have corrected for this by running everything on the same hardware. While this metric essentially tracks how efficient SAT solvers are becoming over time, this metric does not quantify the novelty of contributions of new SAT solvers over time. In other words, it may be possible for this metric to mostly represent engineering feats (which are still important) as opposed to algorithmic breakthrough. We are !99
  • 100.
    ! ! AIINDEX, NOVEMBER 2017 reviewing methodologies that may better quantify the fundamental contribution of newly created SAT solvers. !100
  • 101.
    ! ! AIINDEX, NOVEMBER 2017 !101