Downloaded 14 times

![TABLE OF CONTENTS
163
CHAPTER 7 PREVIEW
Artificial Intelligence
Index Report 2021
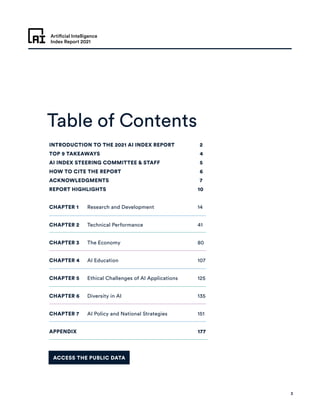
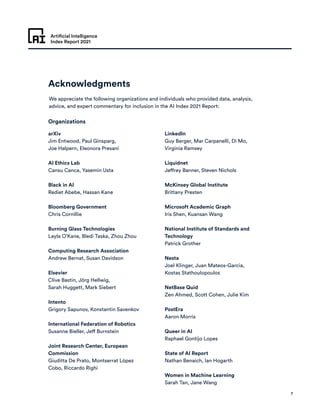
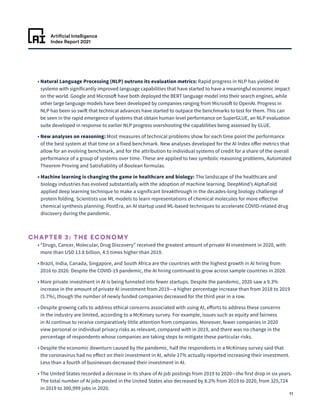
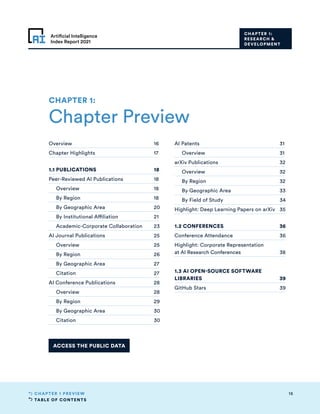
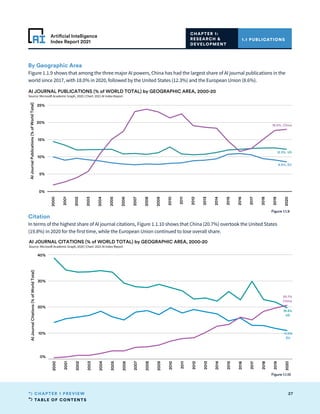
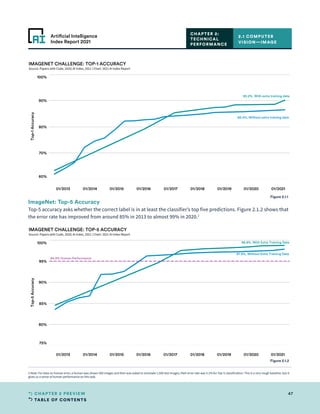
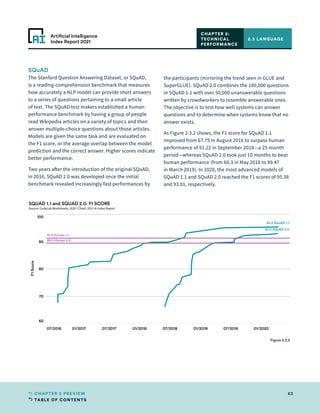
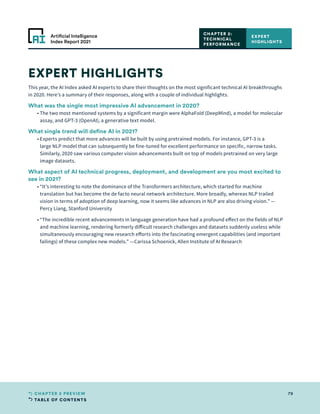
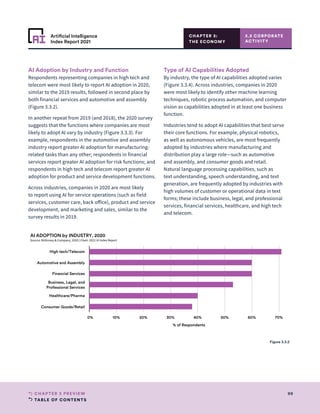
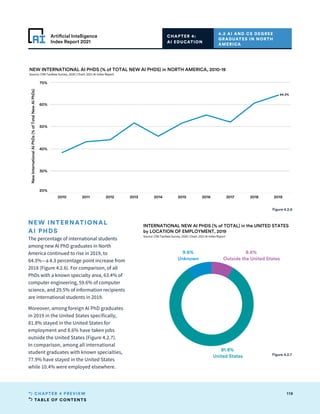
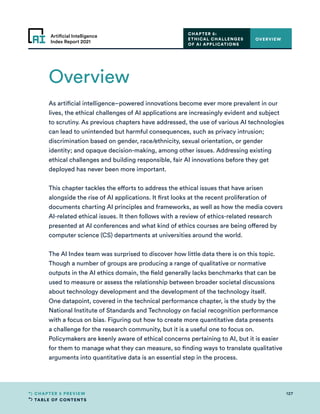
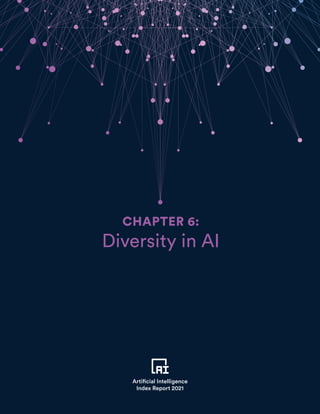
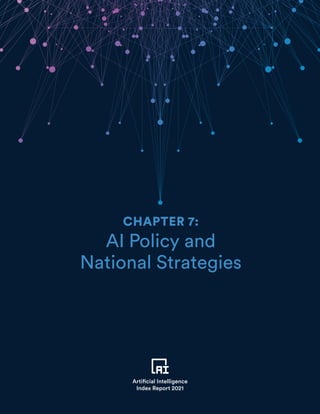
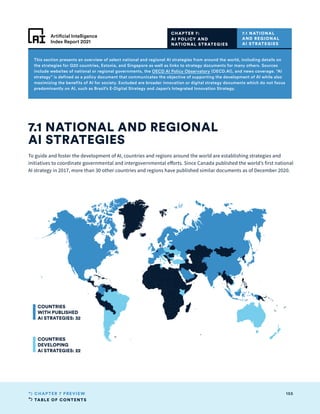
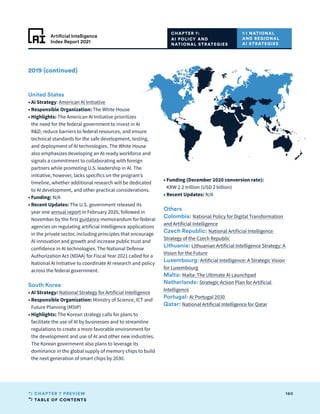
Strategies Announced
Argentina
•
Related Document: N/A
•
Responsible Organization: Ministry of Science,
Technology and Productive Innovation (MINCYT)
• Status: Argentina’s AI plan is a part of the Argentine
Digital Agenda 2030 but has not yet been published. It is
intended to cover the decade between 2020 and 2030,
and reports indicate that it has the potential to reap huge
benefits for the agricultural sector.
Australia
•
Related Documents: Artificial Intelligence Roadmap /
An AI Action Plan for all Australians
•
Responsible Organizations: Commonwealth Scientific
and Industrial Research Organisation (CSIRO), Data 61,
and the Australian government
• Status: The Australian government published a road
map in 2019 (in collaboration with the national science
agency, CSIRO) and a discussion paper of an AI action
plan in 2020 as frameworks to develop a national
AI strategy. In its 2018–19 budget, the Australian
government earmarked AUD 29.9 million (USD 22.2
million [December 2020 conversation rate]) over four
years to strengthen the country’s capabilities in AI and
machine learning (ML). In addition, CSIRO published a
research paper on Australia’s AI Ethics Framework in 2019
and launched a public consultation, which is expected to
produce a forthcoming strategy document.
Turkey
•
Related Document: N/A
•
Responsible Organizations: Presidency of the Republic
of Turkey Digital Transformation Office; Ministry of
Industry and Technology; Scientific and Technological
Research Council of Turkey; Science, Technology and
Innovation Policies Council
• Status: The strategy has been announced but not yet
published. According to media sources, it will focus
on talent development, scientific research, ethics and
inclusion, and digital infrastructure.
Others
Austria: Artificial Intelligence Mission Austria
(official report)
Bulgaria: Concept for the Development of Artificial
Intelligence in Bulgaria Until 2030 (concept document)
Chile: National AI Policy (official announcement)
Israel: National AI Plan (news article)
Kenya: Blockchain and Artificial Intelligence Taskforce
(news article)
Latvia: On the Development of Artificial Intelligence
Solutions (official report)
Malaysia: National Artificial Intelligence (Al) Framework
(news article)
New Zealand: Artificial Intelligence: Shaping a Future
New Zealand (official report)
Sri Lanka: Framework for Artificial Intelligence (news
article)
Switzerland: Artificial Intelligence (official guidelines)
Tunisia: National Artificial Intelligence Strategy (task
force announced)
Ukraine: Concept of Artificial Intelligence Development
in Ukraine AI (concept document)
Vietnam: Artificial Intelligence Development Strategy
(official announcement)
7.1 NATIONAL
AND REGIONAL
AI STRATEGIES
CHAPTER 7:
AI POLICY AND
NATIONAL STRATEGIES](https://image.slidesharecdn.com/2021-ai-index-reportmaster-210525050640/85/Artificial-Intelligence-Index-Report-2021-163-320.jpg)
![TABLE OF CONTENTS
198
APPENDIX
Artificial Intelligence
Index Report 2021
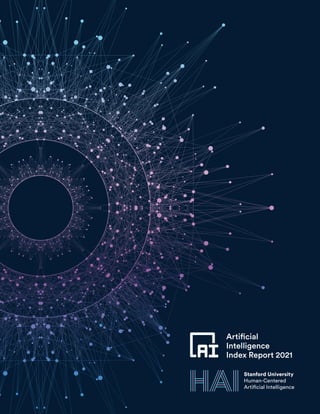
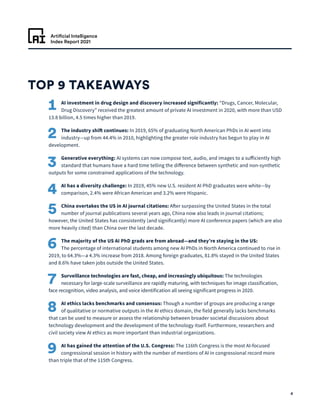
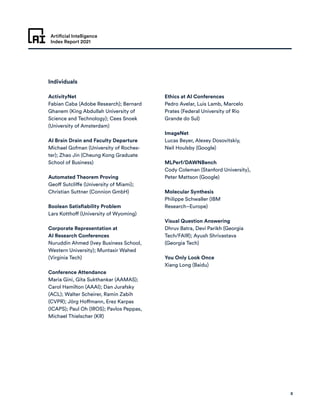
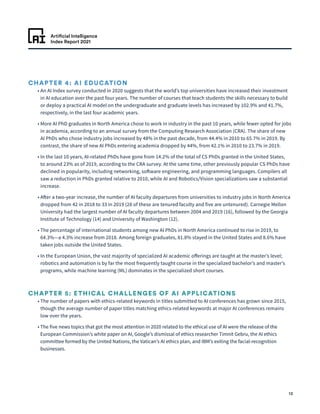
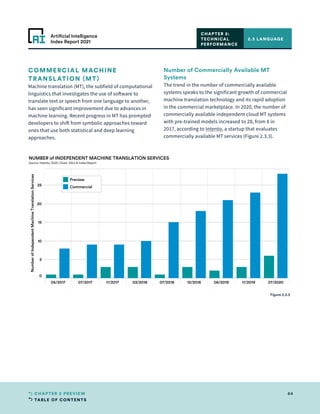
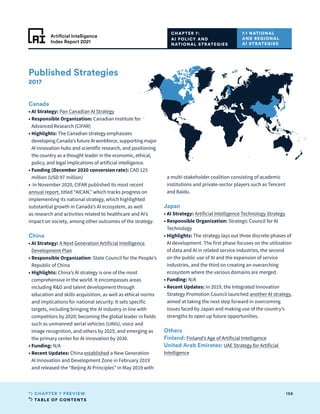
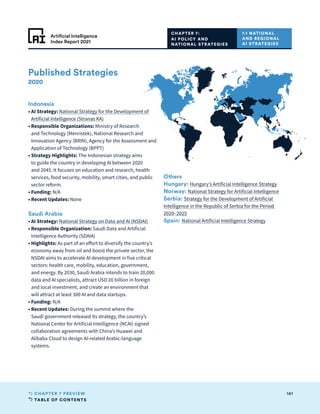
VISUAL QUESTION ANSWERING
(VQA)
VQA accuracy data was provided by the VQA team. Learn
more about VQA here. More details on VQA 2020 are
available here.
Methodology
Given an image and a natural language question about the
image, the task is to provide an accurate natural language
answer. The challenge is hosted on the VQA Challenge
website. The challenge is hosted on EvalAI. The challenge
link is here.
The VQA v2.0 training, validation, and test sets, containing
more than 250,000 images and 1.1 million questions,
are available on the download page. All questions are
annotated with 10 concise, open-ended answers each.
Annotations on the training and validation sets are
publicly available.
VQA Challenge 2020 is the fifth edition of the VQA
Challenge. Results from previous versions of the VQA
Challenge were announced at the VQA Challenge
Workshop in CVPR 2019, CVPR 2018, CVPR 2017, and CVPR
2016. More details about past challenges can be found
here: VQA Challenge 2019, VQA Challenge 2018, VQA
Challenge 2017, VQA Challenge 2016.
VQA had 10 humans answer each question. More details
about the VQA evaluation metric and human accuracy
can be found here (see Evaluation Code section) and
in sections three (“Answers”) and four (“Inter-Human
Agreement”) of the paper.
See slide 56 for the progress graph in VQA in the 2020
Challenge. The values corresponding to the progress graph
are available in a sheet. Here is the information about the
teams that participated in the 2020 challenge and their
accuracies. For more details about the teams, please refer
to the VQA website.
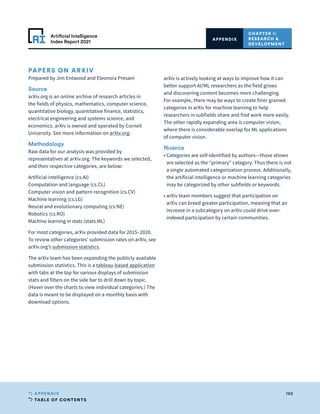
PAPERS WITH CODE:
PAPER AND CODE LINKING
We used paperswithcode (PWC) for referencing technical
progress where available. Learn more about PWC here and
see the public link here.
Methodology
For papers, we follow specific ML-related categories on
arxiv (see [1] below for the full list) and the major ML
conferences (NeurIPS, ICML, ICLR, etc.). For code, we
follow GitHub repositories mentioning papers. We have
good coverage of core ML topics but are missing some
applications—for instance, applications of ML in medicine
or bioinformatics, which are usually in journals behind
paywalls. For code, the dataset is fairly unbiased (as long
as the paper is freely available).
For tasks (e.g., “image classification”), the dataset has
annotated those on 1,600 state-of-the-art papers from the
database, published in 2018 Q3.
For state-of-the-art tables (e.g., “image classification on
ImageNet”), the data has been scraped from different
sources (see the full list here), and a large number focusing
on CV and NLP were hand-annotated. A significant portion
of our data was contributed by users, and they have added
data based on their own preferences and interests. Arxiv
categories we follow:
ARXIV_CATEGORIES = “cs.CV”, “cs.AI”, “cs.LG”, “cs.CL”, “cs.
NE”, “stat.ML”,”cs.IR”}
Process of Extracting Dataset at Scale
1)
Follow various paper sources (as described above) for
new papers.
2)
Conduct a number of predefined searches on GitHub
(e.g., for READMEs containing links to arxiv).
3) Extract GitHub links from papers.
4) Extract paper links from GitHub.
5)
Run validation tests to decide if links from 3) and 4) are
bona fide links or false positives.
6)
Let the community fix any errors and/or add any missing
values.
CHAPTER 2:
TECHNICAL
PERFORMANCE
APPENDIX](https://image.slidesharecdn.com/2021-ai-index-reportmaster-210525050640/85/Artificial-Intelligence-Index-Report-2021-198-320.jpg)
![TABLE OF CONTENTS
211
APPENDIX
Artificial Intelligence
Index Report 2021
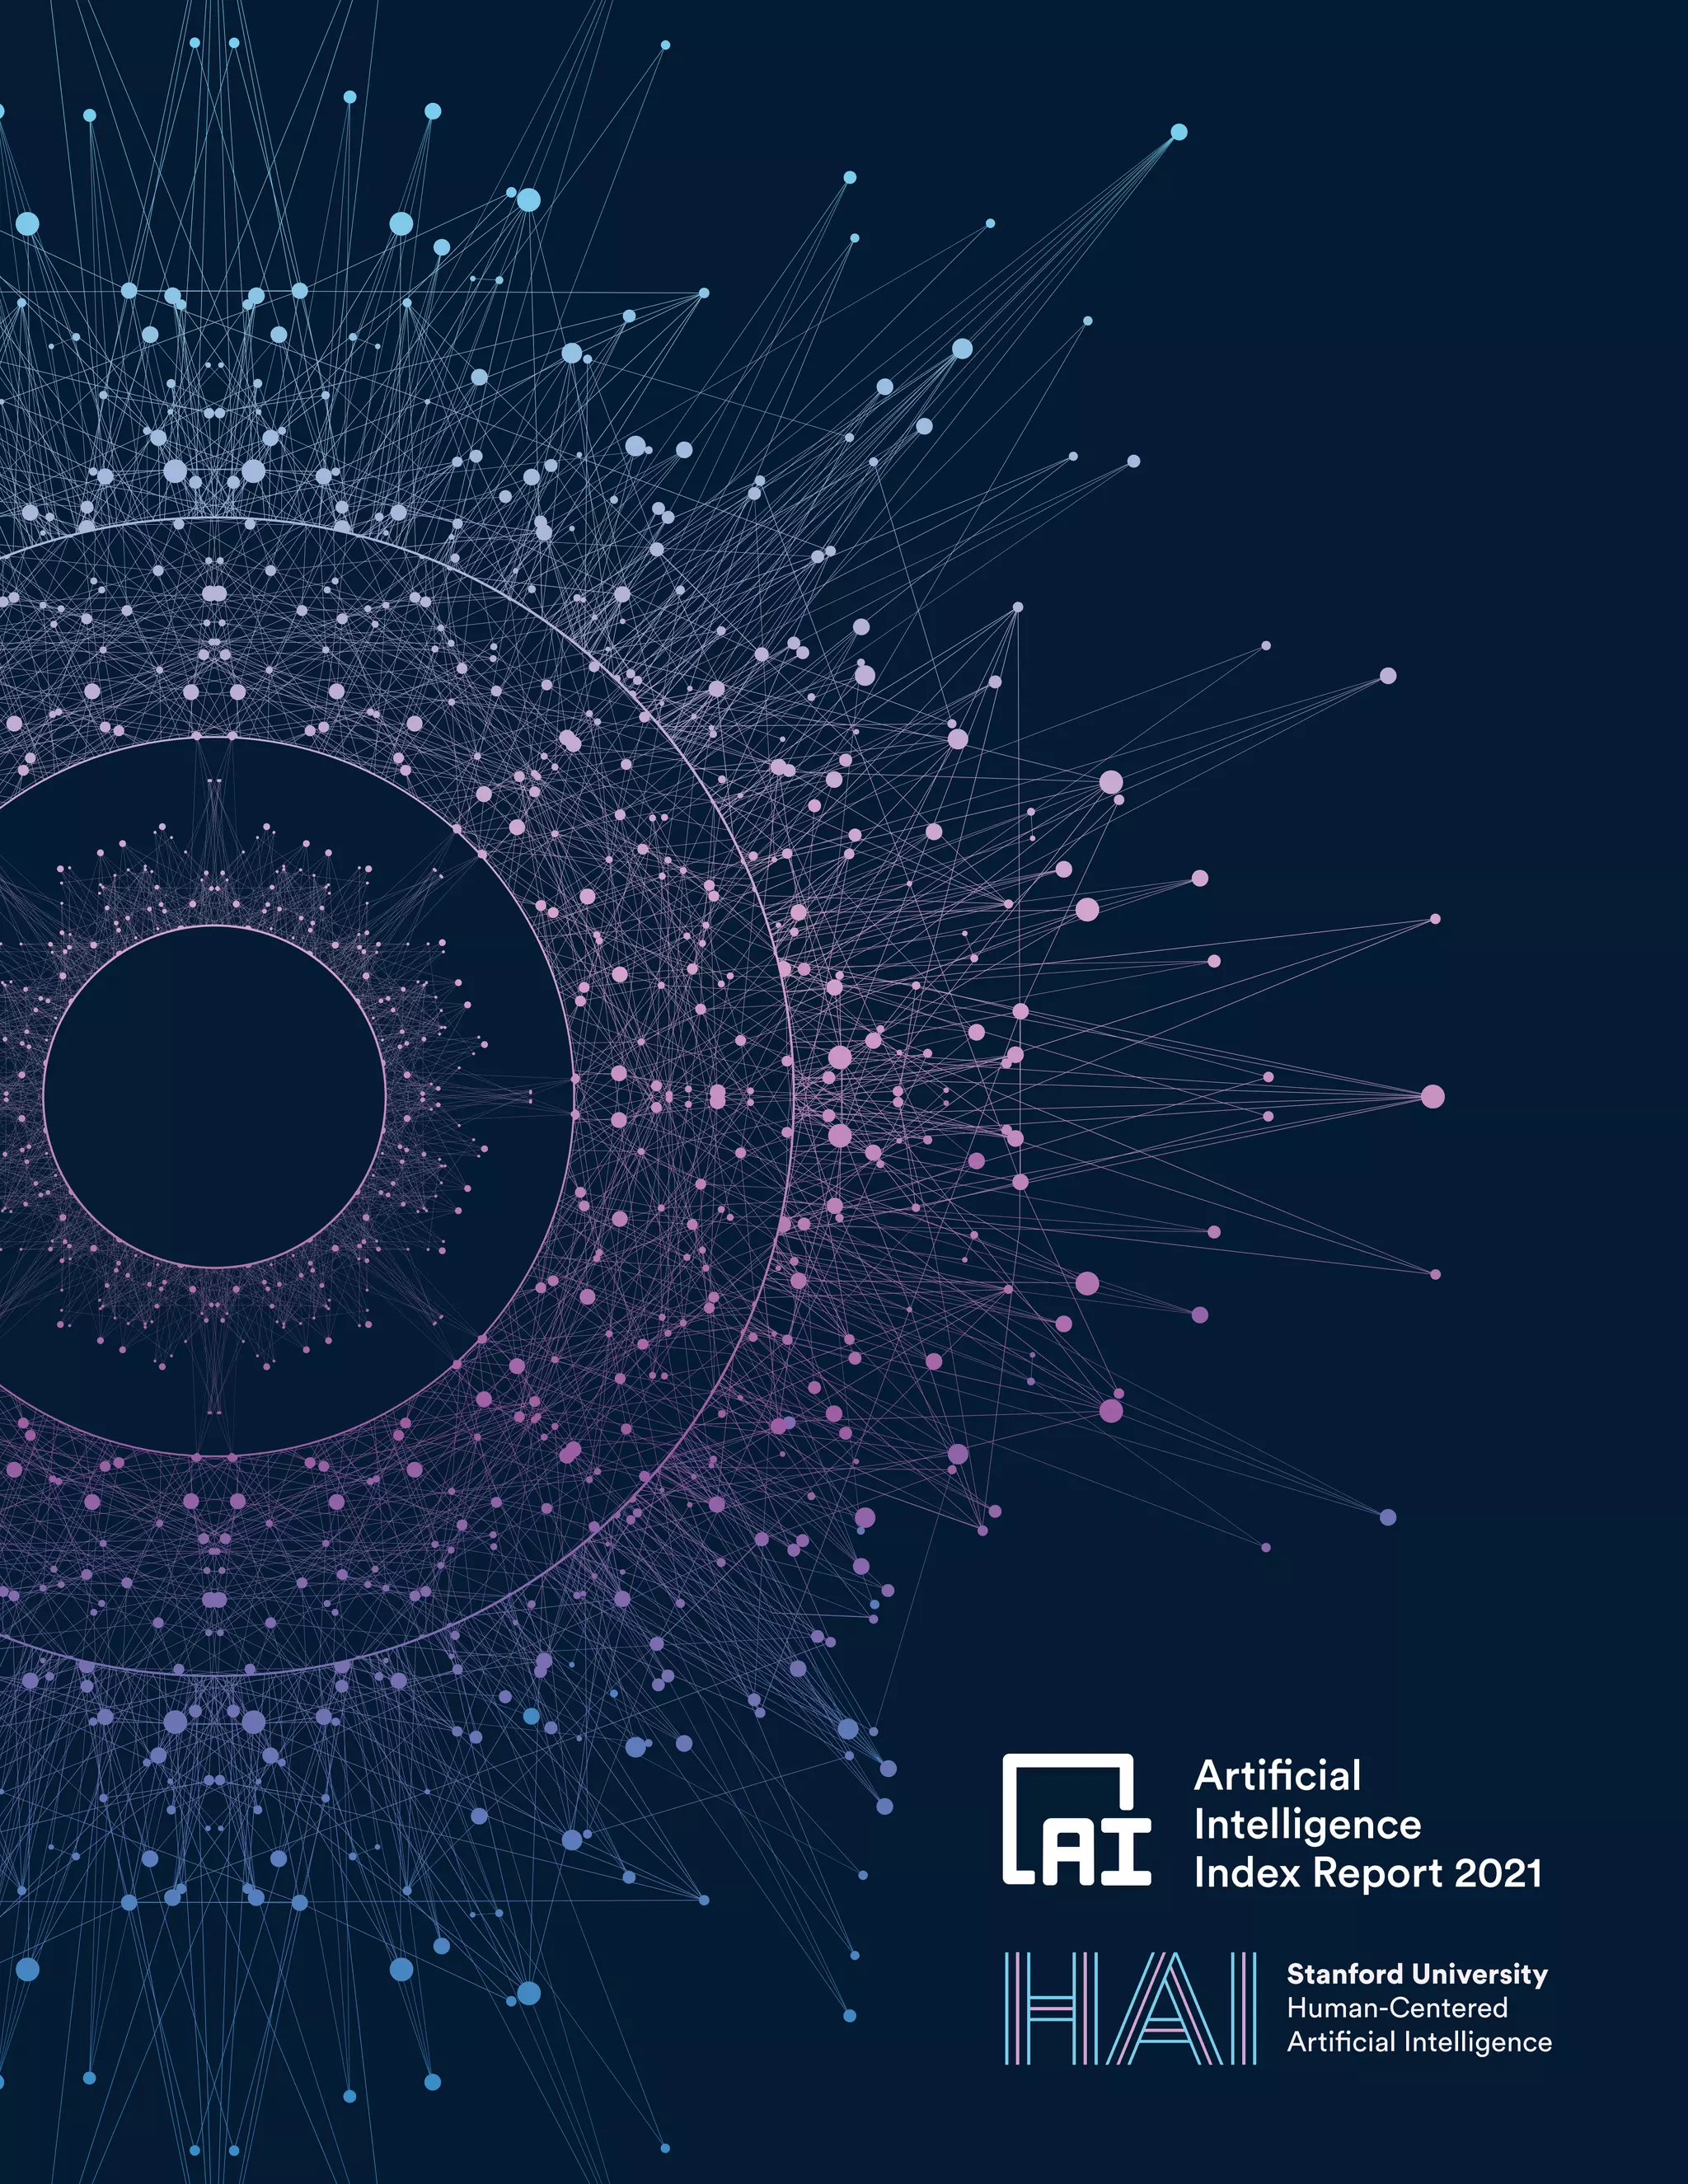
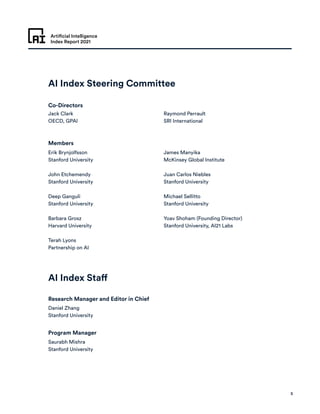
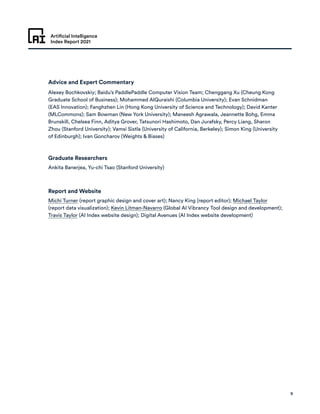
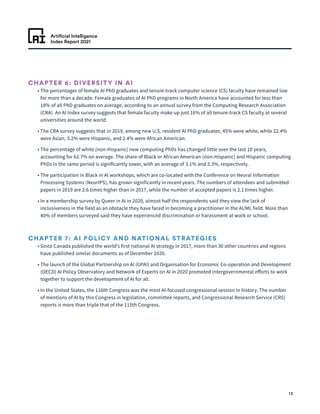
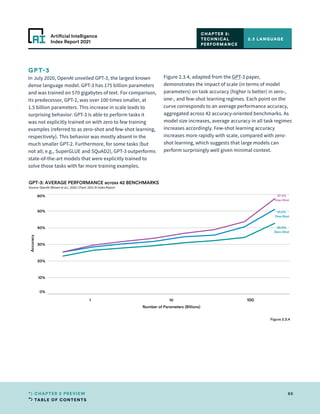
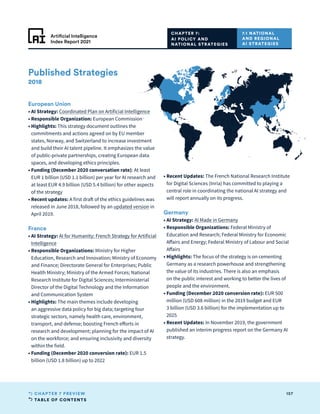
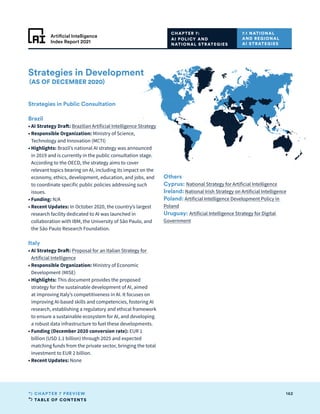
NETBASE QUID
Prepared by Julie Kim
Quid is a data analytics platform within the NetBase
Quid portfolio that applies advanced natural language
processing technology, semantic analysis, and artificial
intelligence algorithms to reveal patterns in large,
unstructured datasets and generate visualizations to allow
users to gain actionable insights. Quid uses Boolean query
to search for focus areas, topics, and keywords within
the archived news and blogs, companies, and patents
database, as well as any custom uploaded datasets. Users
can then filter their search by published date time frame,
source regions, source categories, or industry categories
on the news; and by regions, investment amount,
operating status, organization type (private/public), and
founding year within the companies’ database. Quid
then visualizes these data points based on the semantic
similarity.
Network
Searched for [AI technology keywords + Harvard ethics
principles keywords] global news from January 1, 2020, to
December 31, 2020.
Search Query: (AI OR [“artificial intelligence”](“artificial
intelligence” OR “pattern recognition” OR algorithms)
OR [“machine learning”](“machine learning” OR
“predictive analytics” OR “big data” OR “pattern
recognition” OR “deep learning”) OR [“natural language”]
(“natural language” OR “speech recognition”) OR NLP
OR “computer vision” OR [“robotics”](“robotics” OR
“factory automation”) OR “intelligent systems” OR [“facial
recognition”](“facial recognition” OR “face recognition”
OR “voice recognition” OR “iris recognition”) OR
[“image recognition”](“image recognition” OR “pattern
recognition” OR “gesture recognition” OR “augmented
reality”) OR [“semantic search”](“semantic search”
OR “data-mining” OR “full-text search” OR “predictive
coding”) OR “semantic web” OR “text analytics” OR
“virtual assistant” OR “visual search”) AND (ethics OR
“human rights” OR “human values” OR “responsibility” OR
“human control” OR “fairness” OR discrimination OR non-
discrimination OR “transparency” OR “explainability” OR
“safety and security” OR “accountability” OR “privacy” )
News Dataset Data Source
Quid indexes millions of global-source, English-language
news articles and blog posts from LexisNexis. The platform
has archived news and blogs from August 2013 to the
present, updating every 15 minutes. Sources include over
60,000 news sources and over 500,000 blogs.
Visualization in Quid Software
Quid uses Boolean query to search for topics, trends, and
keywords within the archived news database, with the
ability to filter results by the published date time frame,
source regions, source categories, or industry categories.
(In this case, we only looked at global news published from
January 1, 2020, to December 31, 2020.) Quid then selects
the 10,000 most relevant stories using its NLP algorithm
and visualizes de-duplicated unique articles.
CHAPTER 5: ETHICAL CHALLENGES
OF AI APPLICATIONS
CHAPTER 5: ETHICAL
CHALLENGES OF
AI APPLICATIONS
APPENDIX](https://image.slidesharecdn.com/2021-ai-index-reportmaster-210525050640/85/Artificial-Intelligence-Index-Report-2021-211-320.jpg)
![TABLE OF CONTENTS
212
APPENDIX
Artificial Intelligence
Index Report 2021
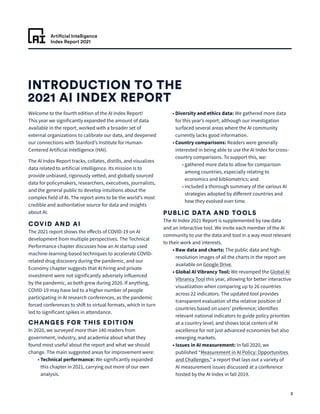
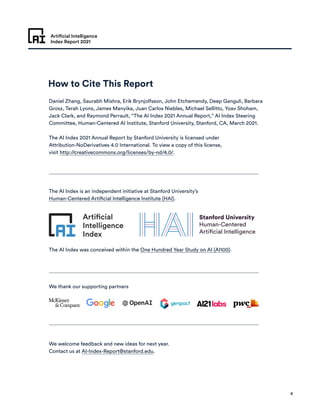
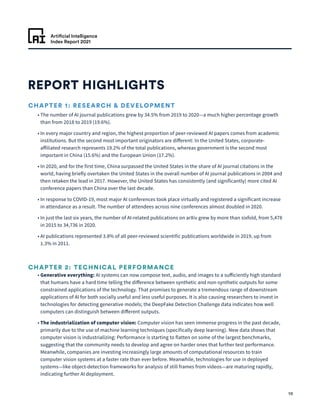
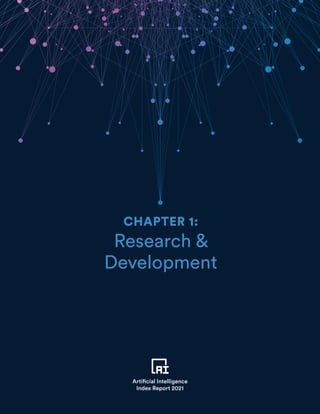
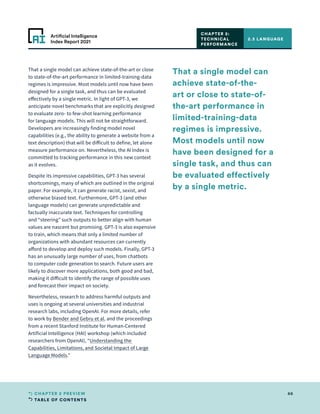
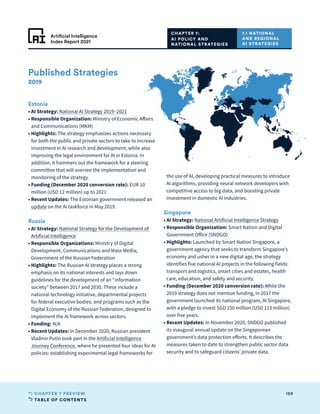
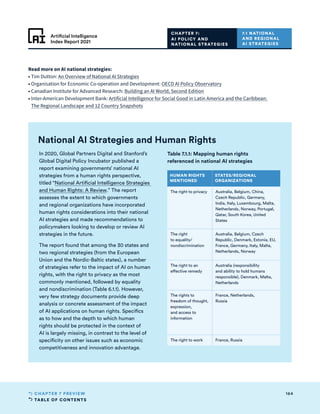
ETHICS IN AI CONFERENCES
Prepared by Marcelo Prates, Pedro Avelar, and Luis C.
Lamb
Source
Prates, Marcelo, Pedro Avelar, Luis C. Lamb. 2018.
On Quantifying and Understanding the Role of Ethics in
AI Research: A Historical Account of Flagship Conferences
and Journals. September 21, 2018.
Methodology
The percent of keywords has a straightforward
interpretation: For each category (classical/trending/
ethics), the number of papers for which the title (or
abstract, in the case of the AAAI and NeurIPS figures)
contains at least one keyword match. The percentages do
not necessarily add up to 100% (e.g, classical/trending/
ethics are not mutually exclusive). One can have a paper
with matches on all three categories.
To achieve a measure of how much Ethics in AI is
discussed, ethics-related terms are searched for in the
titles of papers in flagship AI, machine learning, and
robotics conferences and journals.
The ethics keywords used were the following:
Accountability, Accountable, Employment, Ethic, Ethical,
Ethics, Fool, Fooled, Fooling, Humane, Humanity, Law,
Machine Bias, Moral, Morality, Privacy, Racism, Racist,
Responsibility, Rights, Secure, Security, Sentience,
Sentient, Society, Sustainability, Unemployment, and
Workforce.
The classical and trending keyword sets were compiled
from the areas in the most cited book on AI by Russell
and Norvig [2012] and from curating terms from the
keywords that appeared most frequently in paper titles
over time in the venues.
The keywords chosen for the classical keywords category
were:
Cognition, Cognitive, Constraint Satisfaction, Game
Theoretic, Game Theory, Heuristic Search, Knowledge
Representation, Learning, Logic, Logical, Multiagent,
Natural Language, Optimization, Perception, Planning,
Problem Solving, Reasoning, Robot, Robotics, Robots,
Scheduling, Uncertainty, and Vision.
The curated trending keywords were:
Autonomous, Boltzmann Machine, Convolutional
Networks, Deep Learning, Deep Networks, Long Short
Term Memory, Machine Learning, Mapping, Navigation,
Neural, Neural Network, Reinforcement Learning,
Representation Learning, Robotics, Self Driving, Self-
Driving, Sensing, Slam, Supervised/Unsupervised
Learning, and Unmanned.
The terms searched for were based on the issues exposed
and identified in papers below, and also on the topics
called for discussion in the First AAAI/ACM Conference on
AI, Ethics, and Society.
J. Bossmann. Top 9 Ethical Issues in Artificial Intelligence.
2016. World Economic Forum.
Emanuelle Burton, Judy Goldsmith, Sven Koenig,
Benjamin Kuipers, Nicholas Mattei, and Toby Walsh.
Ethical Considerations in Artificial Intelligence Courses. AI
Magazine, 38(2):22–34, 2017.
The Royal Society Working Group, P. Donnelly, R.
Browsword, Z. Gharamani, N. Griffiths, D. Hassabis, S.
Hauert, H. Hauser, N. Jennings, N. Lawrence, S. Olhede,
M. du Sautoy, Y.W. Teh, J. Thornton, C. Craig, N. McCarthy,
J. Montgomery, T. Hughes, F. Fourniol, S. Odell, W. Kay,
T. McBride, N. Green, B. Gordon, A. Berditchevskaia, A.
Dearman, C. Dyer, F. McLaughlin, M. Lynch, G. Richardson,
C. Williams, and T. Simpson. Machine Learning: The
Power and Promise of Computers That Learn by Example.
The Royal Society, 2017.
CHAPTER 5: ETHICAL
CHALLENGES OF
AI APPLICATIONS
APPENDIX](https://image.slidesharecdn.com/2021-ai-index-reportmaster-210525050640/85/Artificial-Intelligence-Index-Report-2021-212-320.jpg)
![TABLE OF CONTENTS
219
APPENDIX
Artificial Intelligence
Index Report 2021
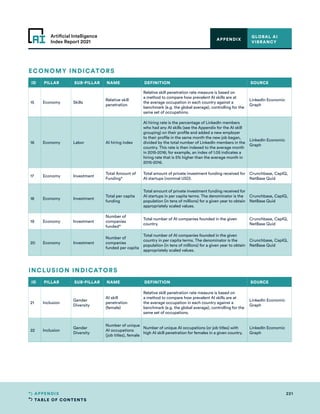
The webtool allows users to adjust weights to each
metric based on their individual preference. The default
settings of the tool allow the user to select between three
weighting options:
All weights to midpoint
This button assigns equal weights to all indicators.
Only absolute metrics
This button assigns maximum weights to absolute
metrics. Per capita metrics are not considered.
Only per capita metrics
This button assigns maximum weights to per capita
metrics. Absolute metrics are not considered.
The user can adjust the weights to each metric based on
their preference. The charts automatically update when
any weight is changed.
The user can select “Global” or “National” view to
visualize the results. The “Global” view offers a cross-
country comparative view based on the weights selected
by the user. The “National” view offers a country deep
dive to assess which AI indicators a given country is
relatively better at. The country-metric specific values
are scaled (0-100), where 100 indicates that a given
country has the highest number in the global distribution
for that metric, and conversely small numbers like 0 or 1
indicates relatively low values in the global distribution
This can help identify areas for improvement and
identify national policy strategies to support a vibrant AI
ecosystem.
CONSTRUCTION OF THE GLOBAL AI
VIBRANCY: COMPOSITE MEASURE
Source
The data is collected by AI Index using diverse datasets
that are referenced in the 2020 AI Index Report chapters.
Methodology
Step 1:
Obtain, harmonize, and integrate data on
individual attributes across countries and time.
Step 2:
Use Min-Max Scalar to normalize each country-year
specific indicator between 0-100.
Step 3:
Take arithmetic Mean per country-indicator for a
given year.
Step 4:
Build modular weighted for available pillars and
individual indicators.
Aggregate Measure
The AI Vibrancy Composite Index can be expressed in the
following equation:
where c represents a country and t represents year, is
the scaled (0-100) individual indicator, is the weight
assigned to individual indicators, is weight specific
to one of the three high-level pillars and N is the number of
indicators available for a given country for a specific year.
Normalization
To adjust for differences in units of measurement and
ranges of variation, all 22 variables were normalized into
the [0, 100] range, with higher scores representing better
outcomes. A minimum-maximum normalization method
was adopted, given the minimum and maximum values of
each variable respectively. Higher values indicate better
outcomes. The normalization formula is:
Coverage and Nuances
A threshold of 73% coverage was chosen to select the final list
of countries based on an average of available data between
2015-2020. Russia and South Korea were added manually
due to their growing importance in the global AI landscape,
even though they did not pass the 73% threshold.
GLOBAL AI
VIBRANCY
APPENDIX](https://image.slidesharecdn.com/2021-ai-index-reportmaster-210525050640/85/Artificial-Intelligence-Index-Report-2021-219-320.jpg)


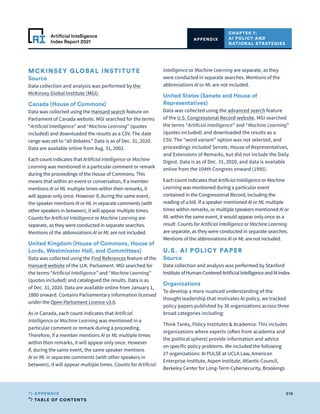
The 2021 AI Index Report provides a comprehensive overview of artificial intelligence trends, showcasing increased investment and development in AI technologies, particularly in drug discovery, despite the impacts of COVID-19. It highlights the evolving landscape of AI research, including significant progress in natural language processing and machine learning applications, while also addressing challenges related to diversity and ethical standards within the field. The report aims to serve as a reliable data source for various stakeholders, enhancing understanding and discussions surrounding AI's complexities.


![iSkysoft Data Recovery 5.0.1.3 Crack + Serial Key [2025]](https://cdn.slidesharecdn.com/ss_thumbnails/artificialintelligence22-250528111409-7bb27b53-thumbnail.jpg?width=640&height=640&fit=bounds)

![Directory Lister Pro 2.42 Enterprise + Crack Download [Latest]](https://cdn.slidesharecdn.com/ss_thumbnails/artificialintelligence22-250528124124-08bcb9e9-thumbnail.jpg?width=640&height=640&fit=bounds)

![EndNote Crack 20 Build 14672 + Serial Key Free Download [Latest]](https://cdn.slidesharecdn.com/ss_thumbnails/artificialintelligence22-250602144051-91223e8c-thumbnail.jpg?width=640&height=640&fit=bounds)
![NIUBI Partition Editor 7.3.7 + License Key [Latest]](https://cdn.slidesharecdn.com/ss_thumbnails/artificialintelligence22-250529151611-84713241-thumbnail.jpg?width=640&height=640&fit=bounds)
![GridinSoft Anti-Malware 4.1.74 Crack + Activation Code [Latest]](https://cdn.slidesharecdn.com/ss_thumbnails/artificialintelligence22-250529091117-4735c160-thumbnail.jpg?width=640&height=640&fit=bounds)
![TuneFab Spotify Music Converter 3.1.3 + Crack [Latest]](https://cdn.slidesharecdn.com/ss_thumbnails/artificialintelligence22-250529070550-59b281b6-thumbnail.jpg?width=640&height=640&fit=bounds)