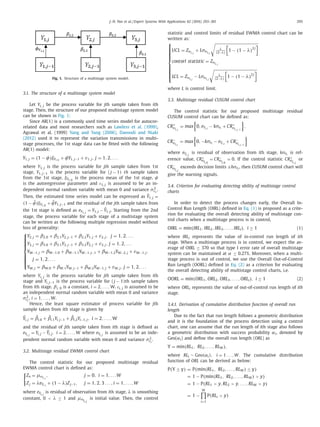
The document proposes new approaches for monitoring quality in multistage manufacturing systems. It develops a multiple linear regression model to describe the relationship between process outputs at different stages, accounting for autocorrelation within stages and correlation between neighboring stages. It then introduces multistage residual EWMA and CUSUM control charts to monitor overall process quality. An overall run length concept is used to compare the performance of these charts in detecting changes. A numerical example illustrates applying the multistage residual control charts to monitor a three-stage silicon wafer manufacturing process.
Applications Residual Control Charts Based on Variable LimitsIJERA Editor
The main purpose of this paper is to verify the stability of a productive process in the presence of the effects of autocorrelation and volatility, in order to capture these characteristics by a joint forecast model which produces residuals that are evaluated by a control chart based on variable control limits. The methodology employed will be the joint estimation of the residuals by ARIMA – ARCH models and the conditional standard deviation from residuals to establish the chart control limits. The joint AR (1)-ARCH (1) model shows that an appropriate forecasting model brings a great contribution to the performance of residual control charts in monitoring the stability of industrial variables using just one chart to monitor mean and variance together.
Research and Development the Adaptive Control Model Using the Spectrometer De...theijes
In this paper there are consider the automatic adaptive control system, selected adaptive control system with the standard model.The mathematical model of adaptive control system with the etalon-model is developed. Constructed and researched mathematical model of adaptive system with a reference model using MathLab Simulink software.There are researched adaptive control system responds to various external influences.
The Effect of Sample Size On (Cusum and ARIMA) Control ChartsINFOGAIN PUBLICATION
This document discusses the effect of sample size on CUSUM and ARIMA control charts. It summarizes that increasing the sample size decreases the deviation between observations and the range of CUSUM values. Larger sample sizes make it easier to detect changes from the target value. CUSUM and ARIMA control charts are presented as statistical process control methods that can detect small changes in process parameters. The average run length is discussed as an important metric for evaluating control chart performance, with smaller average run lengths indicating better ability to detect when a process is out of control.
Design and Implementation of Model Reference Adaptive Controller using Coeffi...IOSR Journals
This document describes the design and implementation of a model reference adaptive controller (MRAC) using the coefficient diagram method (CDM) for a nonlinear process. It begins by introducing MRAC for single-input single-output plants, developing the MRAC design and control law. It then provides basics of the CDM design approach. The document applies the CDM-MRAC to a spherical tank level process in simulation, comparing its performance to a linear PI controller. Simulation results show the CDM-MRAC has faster rise time and settling time than the PI controller.
Performance analysis of a liquid column in a chemical plant by using mpceSAT Publishing House
This document discusses the use of model predictive control (MPC) to control the composition of a liquid column in a chemical plant. It provides background on MPC and how it can be used for multivariable processes like liquid columns. The document describes modeling a liquid column process in MATLAB Simulink and comparing the performance of MPC and PID control of the column. The results show that MPC provides better control of the column composition and liquid level than PID control.
International Journal of Computational Engineering Research(IJCER)ijceronline
International Journal of Computational Engineering Research(IJCER) is an intentional online Journal in English monthly publishing journal. This Journal publish original research work that contributes significantly to further the scientific knowledge in engineering and Technology.
Automated well test analysis ii using ‘well test auto’Alexander Decker
This document describes an automated computer program called WELL TEST AUTO that was developed to fully automate well test analysis and interpretation. The program selects reservoir models and estimates parameter values. It was tested on 10 datasets, including simulated and actual field data. Selected results from 3 of the datasets are presented, showing that the program correctly identified the reservoir model and provided acceptable estimates of parameters like permeability and skin. The program implements an artificial intelligence approach to automate the entire well test interpretation workflow in a visual basic program.
Assimilation of spa and pmt for random shocks in manufacturing process 2IAEME Publication
This document summarizes an article that discusses combining statistical process control (SPC) techniques with engineering process control (EPC) methods to detect and adjust for random shifts in a manufacturing process mean. Specifically, it proposes using control charts like CUSUM or EWMA to detect shifts, estimating the size of any shift, and then implementing sequential adjustments based on stochastic approximation techniques to bring the process mean back to target. The document analyzes how well different control chart and adjustment method combinations perform at minimizing the average squared deviation of the process from the target, especially for smaller shift sizes where only a few adjustments are possible due to production run constraints.
Compensation of Data-Loss in Attitude Control of Spacecraft Systems rinzindorjej
In this paper, a comprehensive comparison of two robust estimation techniques namely, compensated closed-loop Kalman filtering and open-loop Kalman filtering is presented. A common problem of data loss in a real-time control system is investigated through these two schemes. The open-loop scheme, dealing with the data-loss, suffers from several shortcomings. These shortcomings are overcome using compensated scheme, where an accommodating observation signal is obtained through linear prediction technique -- a closed-loop setting and is adopted at a posteriori update step. The calculation and employment of accommodating observation signal causes computational complexity. For simulation purpose, a linear time invariant spacecraft model is however, obtained from the nonlinear spacecraft attitude dynamics through linearization at nonzero equilibrium points -- achieved off-line through Levenberg-Marguardt iterative scheme. Attempt has been made to analyze the selected example from most of the perspectives in order to display the performance of the two techniques.
This document provides an overview of statistical quality control (SQC). It describes the three main categories of SQC as descriptive statistics, statistical process control (SPC), and acceptance sampling. Control charts are discussed as a key SPC tool used to monitor processes and identify variations. The concepts of process capability, six sigma quality levels, and acceptance sampling plans are also introduced.
This document discusses statistical quality control (SQC) and its three main categories: descriptive statistics, statistical process control (SPC), and acceptance sampling. SPC involves measuring quality characteristics and charting them to identify variations. Control charts show whether a process is in or out of statistical control. Acceptance sampling randomly inspects a batch to determine if it should be accepted or rejected. The document also covers process capability indices, six sigma methodology, and implications for quality managers regarding inspection frequency, location, and tools.
Six sigma-in-measurement-systems-evaluating-the-hidden-factory (2)Bibhuti Prasad Nanda
The document discusses a case study conducted at W.R. Grace to evaluate the measurement system for an important quality variable, CTQ1, at four worldwide production locations. An MSA study was performed to determine the %GRR, P/T ratio, and bias of the CTQ1 measurement. The results showed high measurement variation contributed by the operators and interactions between operators and samples. Process data was then linked to the MSA study, showing representative samples were selected and improvements to the measurement system could reduce hidden factory costs from over-processing and rework.
Statistical quality control refers to using statistical methods to monitor and maintain quality in products and services. It involves collecting data samples from a production process and using statistical process control and acceptance sampling techniques to determine if the process is functioning properly and producing acceptable quality levels. The main objectives are to control materials, internal rejections, customer issues, supplier evaluations, and corrective actions. Control charts graphically display process data over time and can identify changes or abnormalities that require process adjustments to maintain control. Common types include X-bar and R charts for variables and P charts for attributes.
International Journal of Engineering Research and Applications (IJERA) is an open access online peer reviewed international journal that publishes research and review articles in the fields of Computer Science, Neural Networks, Electrical Engineering, Software Engineering, Information Technology, Mechanical Engineering, Chemical Engineering, Plastic Engineering, Food Technology, Textile Engineering, Nano Technology & science, Power Electronics, Electronics & Communication Engineering, Computational mathematics, Image processing, Civil Engineering, Structural Engineering, Environmental Engineering, VLSI Testing & Low Power VLSI Design etc.
This document presents a study on developing a tool wear monitoring approach based on analyzing dynamic force signals during turning operations. Force signals are measured during machining with progressive tool wear. The proposed approach involves decomposing the force signals into deterministic and stochastic components. Time series analysis is used to model the stochastic component and develop autoregressive moving average (ARMA) models to represent the tool state at different wear levels. The models are further reduced into a "Green's Function" parameter to reflect changes in damping of the cutting process with tool wear. It is proposed that this Green's Function concept can form the basis of a diagnostic technique for tool wear monitoring.
This document lists various Russian military aircraft, including the Mil Mi-24PN helicopter, Kamov Ka-31 helicopter, Mikoyan-Gurevich MiG-21-93 fighter jet, Sukhoi Su-27UB fighter jet, Sukhoi Su-34 fighter bomber, Tupolev Tu-160 strategic bomber, and Yakovlev Yak-38U V/STOL fighter. It mentions each aircraft model multiple times and concludes by saying the show is over and to see you in 2009.
Este documento anuncia a edição de Primavera da Caminhada, que ocorrerá no dia 2 de outubro. O objetivo é promover a saúde e a inclusão social, convidando marilienses de todas as idades a participarem. Diferentemente de edições anteriores, não haverá camisetas personalizadas para evitar que pessoas se sintam excluídas. Hidratação e apoio médico serão fornecidos. Após a caminhada de 4km, haverá sorteio de prêmios.
Real time marketing: Cómo salir victorioso de la vorágine del NOW
Información General
Lo quiero ya, ahora, no quiero esperar y además quiero que sea relevante. El nuevo Internet del 'Now' nos ha hecho más exigentes que nunca y las marcas deben tomar nota y adaptarse a ello o morir. Cada momento es una oportunidad para crear relevancia de marca, aunque eso no signifique que debamos participar en cada evento, noticia o momento. El Real Time Marketing es Storytelling impulsado por lo instantáneo.
Consciente del desafío que esto supone, nos adentraremos en este viaje para entender cómo podemos planificar una campaña de Real Time Marketing, utilizar este paradigma a nuestro favor y salir victoriosos contra la vorágine del 'Now'. Algunas de las claves son planificar posibles eventos, engancharnos a la escucha del mercado, tener un equipo creativo con gran intuición y definir protocolos de actuación.
La Unión Europea ha acordado un paquete de sanciones contra Rusia por su invasión de Ucrania. Las sanciones incluyen restricciones a las transacciones con bancos rusos clave y la prohibición de la venta de aviones y equipos a Rusia. Los líderes de la UE esperan que las sanciones aumenten la presión económica sobre Rusia y la disuadan de continuar su agresión contra Ucrania.
Descriptive epidemiology involves observing disease distribution in populations and identifying characteristics associated with disease. It defines the population and disease, then describes disease distribution by time, place and person. Disease occurrence is measured and compared to indices to formulate etiological hypotheses. Descriptive studies define populations and diseases, measure prevalence or incidence, and compare data to generate hypotheses about disease causation and distribution patterns over time, between locations, and among demographic groups. This allows identifying high-risk groups and clues about disease etiology.
Рынок электронной торговли. Новостной мониторинг, выпуск 2016/16Data Insight
Новости электронной торговли в России и за рубежом, выходит 1 раз в неделю. Включает в себя: новости, исследования, стратегические решения, новые маркетинговые инструменты, финансовые показатели крупнейших онлайн-магазинов.
Подписка бесплатная - http://www.datainsight.ru/ecomm_weekly
Case Study Analysis on General ElectricSubhi Pradhan
This document provides a case study analysis of General Electric's organizational strategy. It analyzes GE's internal capabilities, which it identifies as key sources of sustained competitive advantage. These capabilities include leadership, human resource development, organizational structure, innovation, marketing/brand portfolio, and customer service. For each capability, the document describes how GE has built and leveraged that capability, such as through training programs, decentralizing its structure, launching initiatives like Ecomagination, diversifying its portfolio for synergies, and focusing on customer relationships. The overall analysis aims to understand the roots of GE's competitiveness through its internal capabilities.
SYSTEM IDENTIFICATION AND MODELING FOR INTERACTING AND NON-INTERACTING TANK S...ijistjournal
System identification from the experimental data plays a vital role for model based controller design. Derivation of process model from first principles is often difficult due to its complexity. The first stage in the development of any control and monitoring system is the identification and modeling of the system. Each model is developed within the context of a specific control problem. Thus, the need for a general system identification framework is warranted. The proposed framework should be able to adapt and emphasize different properties based on the control objective and the nature of the behavior of the system. Therefore, system identification has been a valuable tool in identifying the model of the system based on the input and output data for the design of the controller. The present work is concerned with the identification of transfer function models using statistical model identification, process reaction curve method, ARX model, genetic algorithm and modeling using neural network and fuzzy logic for interacting and non interacting tank process. The identification technique and modeling used is prone to parameter change & disturbance. The proposed methods are used for identifying the mathematical model and intelligent model of interacting and non interacting process from the real time experimental data.
Data-driven adaptive predictive control for an activated sludge processjournalBEEI
Data-driven control requires no information of the mathematical model of the controlled process. This paper proposes the direct identification of controller parameters of activated sludge process. This class of data-driven control calculates the predictive controller parameters directly using subspace identification technique. By updating input-output data using receding window mechanism, the adaptive strategy can be achieved. The robustness test and stability analysis of direct adaptive model predictive control are discussed to realize the effectiveness of this adaptive control scheme. The applicability of the controller algorithm to adapt into varying kinetic parameters and operating conditions is evaluated. Simulation results show that by a proper and effective excitation of direct identification of controller parameters, the convergence and stability of the implicit predictive model can be achieved.
Direct digital control scheme for controlling hybrid dynamic systems using AN...XiaoLaui
An Estimator Based Inverse Dynamics Controller (EBIDC), which utilizes an Artificial Neural Network (ANN) based state estimation scheme for nonlinear autonomous hybrid systems which are subjected to state disturbances and measurement noises that are stochastic in nature, is proposed in this paper. A salient feature of the proposed scheme is that it offers better state estimates and hence a better control of non-measurable state variables with a non linear approach in correcting the a priori estimates by avoiding statistical linearization involved in existing approaches based on derivative free estimation methods. Simulation results guarantees significant reduction in Integral Square Error (ISE) and standard deviation (σ) of error, between the controlled variable and set point and control signal computation time when compared with best existing related work based on Unscented Kalman Filter (UKF) and Ensembeled Kalman Filter (EnKF). Detailed analysis of the experimental results on real plant under different operating conditions such as servo and regulatory operations, initial condition mismatch, and different types of faults in the system, confirms robustness of proposed approach in these conditions and support the simulation results obtained. The main advantage of the proposed controller is that the control signal computation time is very much less than the selected sampling time of the process, so direct control of the plant is possible with this approach.
This document discusses double-sampling control charts for attributes. Specifically, it presents the use of a double-sampling np control chart proposed by De Araújo Rodríguez (2011) to monitor binomial processes with low production volumes. The paper describes the double-sampling np chart methodology, applies it to a welding process example with 512 pieces per shift, and finds optimal chart designs through mathematical modeling and computer programming. An example application illustrates monitoring the welding process using one of the optimal designs found.
2-DOF BLOCK POLE PLACEMENT CONTROL APPLICATION TO:HAVE-DASH-IIBTT MISSILEZac Darcy
In a multivariable servomechanism design, it is required that the output vector tracks a certain reference
vector while satisfying some desired transient specifications, for this purpose a 2DOF control law
consisting of state feedback gain and feedforward scaling gain is proposed. The control law is designed
using block pole placement technique by assigning a set of desired Block poles in different canonical forms.
The resulting control is simulated for linearized model of the HAVE DASH II BTT missile; numerical
results are analyzed and compared in terms of transient response, gain magnitude, performance
robustness, stability robustness and tracking. The suitable structure for this case study is then selected.
Analysis and Modeling of PID and MRAC Controllers for a Quadruple Tank System...dbpublications
Multivariable systems exhibit complex dynamics because of the interactions between input variables and output variables. In this paper an approach to design auto tuned decentralized PI controller using ideal decoupler and adaptive techniques for controlling a class of multivariable process with a transmission zero. By using decoupler, the MIMO system is transformed into two SISO systems. The controller parameters were adjusted using the Model Reference Adaptive reference Control. In recent process industries, PID and MRAC are the two widely accepted control strategies, where PID is used at regulatory level control and MRAC at supervisory level control. In this project, LabVIEW is used to simulate the PID with Decoupler and MRAC separately and analyze their performance based on steady state error tracking and overshoot.
Integral Backstepping Sliding Mode Control of Chaotic Forced Van Der Pol Osci...ijctcm
ABSTRACT
Forced Van der Pol oscillator exhibits chaotic behaviour and instability under certain parameters and this poses a great threat to the systems where it has been applied hence, the need to develop a control method to stabilize and control chaos in a Forced Van der Pol oscillator so as to avoid damage in the controlled system and also to prevent unmodeled dynamics from being introduced in the system. Sliding Mode control makes use of the regulatory variables derived from the controlled Lyapunov function to bring the new variables to stability. The essence of using Integral Backstepping was to prevent chattering which can occur in the control input and can cause instability to the system by igniting unmodeled dynamics. Simulation was done using MATLAB and the results were provided to show the effectiveness of the proposed control method. Integral Backstepping Sliding Mode control method was effective towards stability and chaos control. It was also robust towards matched and unmatched disturbance.
A Level Training Set with both a Computer-Based Control and a Compact Control...ijesajournal
In engineering education, the combination with theoretical education and practical education is an
essential problem. The taught knowledge can be quickly forgotten without an experimental application. In
addition, the theoretical knowledge’s cannot be easily associated applications by students when they start
working in industry. To eliminate these problems, a number of education tools have been developed in
engineering education. This article presents a modelling, simulation and practice study of a newly designed
liquid level training set developed for the control engineering students to simulate, examine and analyze
theoretically and experimentally the controllers widely used in the control of many industrial processes.
The newly designed training set combines two control structures, which are a computer-based control and
a digital signal processing-based control. The set displays the results related to experiments in real time as
well as. These features have made it a suitable laboratory component on which the students can both
simulate and test the performance of liquid level control systems by using theoretical different control
structures.
A LEVEL TRAINING SET WITH BOTH A COMPUTER- BASED CONTROL AND A COMPACT CONTRO...ijesajournal
In engineering education, the combination with theoretical education and practical education is an essential problem. The taught knowledge can be quickly forgotten without an xperimental application. In addition, the theoretical knowledge’s cannot be easily associated applications by students when they start
working in industry. To eliminate these problems, a number of education tools have been developed in engineering education. This article presents a modelling, simulation and practice study of a newly designed liquid level training set developed for the control engineering students to simulate, examine and analyze
theoretically and experimentally the controllers widely used in the control of many industrial processes. The newly designed training set combines two control structures, which are a computer-based control and a digital signal processing-based control. The set displays the results related to experiments in real time as
well as. These features have made it a suitable laboratory component on which the students can both simulate and test the performance of liquid level control systems by using theoretical different control structures.
This document presents a second order integral sliding mode control approach for speed control of a DC motor system. The DC motor system is modeled as a second order system with uncertainty and disturbances. Three controllers are designed and compared - a second order integral sliding mode controller, a conventional sliding mode controller, and a PID controller. Simulation results show that the proposed second order integral sliding mode controller has the fastest response time, no overshoot, smooth control input, and drives the sliding surface to zero, performing better than the other controllers in terms of robustness and disturbance rejection.
Experimental verification of SMC with moving switching lines applied to hoisti...ISA Interchange
In this paper we propose sliding mode control strategies for the point-to-point motion control of a hoisting crane. The strategies employ time-varying switching lines (characterized by a constant angle of inclination) which move either with a constant deceleration or a constant velocity to the origin of the error state space. An appropriate design of these switching lines results in non-oscillatory convergence of the regulation error in the closed-loop system. Parameters of the lines are selected optimally in the sense of two criteria, i.e. integral absolute error (IAE) and integral of the time multiplied by the absolute error (ITAE). Furthermore, the velocity and acceleration constraints are explicitly taken into account in the optimization process. Theoretical considerations are verified by experimental tests conducted on a laboratory scale hoisting crane.
IRJET- Two-Class Priority Queueing System with Restricted Number of Priority ...IRJET Journal
This document summarizes a research paper that analyzes a two-class priority queueing system with a restricted number of high priority customers and catastrophes. The system has Poisson arrivals for each class and exponential service times. Customers are served with preemptive priority, where high priority customers preempt low priority service. The paper derives the generating function and steady-state probabilities for the number of customers in each class. It then uses this to obtain expressions for performance measures like the mean queue length. The impact of catastrophes on the system is also studied.
This document introduces the fuzzy model reference learning control (FMRLC) method. FMRLC uses a reference model to provide feedback to modify the membership functions of a fuzzy controller. This allows the closed-loop system to behave like the reference model and achieve the desired performance. The effectiveness of FMRLC is demonstrated through its application to rocket velocity control and robot manipulator control. FMRLC can achieve high performance learning control for nonlinear, time-varying systems.
State Estimation based Inverse Dynamic Controller for Hybrid system using Art...XiaoLaui
Authors have proposed State Estimation Based Inverse Dynamics Controller (SEBIDC), which utilizes an Artificial Neural Network (ANN) based state estimation scheme for nonlinear autonomous hybrid systems which are subjected to state disturbances and measurement noises that are stochastic in nature. A salient feature of the proposed scheme is that it offers better state estimates and hence a better control of non-measurable state variables with a non linear approach in correcting the a priori estimates by avoiding statistical linearization involved in existing approaches based on derivative free estimation methods. Simulation results guarantees significant reduction in Integral Square Error (ISE) and standard deviation (σ) of error, between the controlled variable and set point and control signal computation time when compared with best existing related work based on Unscented Kalman Filter (UKF) and Ensemble Kalman Filter (EnKF). Detailed analysis of the experimental results on real plant under different operating conditions such as servo and regulatory operations, initial condition mismatch, and different types of faults in the system, confirms robustness of proposed approach in these conditions and support the simulation results obtained. The main advantage of the proposed controller is that the control signal computation time is very much less than the selected sampling time of the process, so direct control of the plant is possible with this approach.
2-DOF Block Pole Placement Control Application To: Have-DASH-IIBITT MissileZac Darcy
In a multivariable servomechanism design, it is required that the output vector tracks a certain reference
vector while satisfying some desired transient specifications, for this purpose a 2DOF control law
consisting of state feedback gain and feedforward scaling gain is proposed. The control law is designed
using block pole placement technique by assigning a set of desired Block poles in different canonical forms.
The resulting control is simulated for linearized model of the HAVE DASH II BTT missile; numerical
results are analyzed and compared in terms of transient response, gain magnitude, performance
robustness, stability robustness and tracking. The suitable structure for this case study is then selected.
In this paper, the tracking control scheme is presented using the framework of finite-time sliding mode control (SMC) law and high-gain observer for disturbed/uncertain multi-motor driving systems under the consideration multi-output systems. The convergence time of sliding mode control is estimated in connection with linear matrix inequalities (LMIs). The input state stability (ISS) of proposed controller was analyzed by Lyapunov stability theory. Finally, the extensive simulation results are given to validate the advantages of proposed control design.
International Journal of Mathematics and Statistics Invention (IJMSI) is an international journal intended for professionals and researchers in all fields of computer science and electronics. IJMSI publishes research articles and reviews within the whole field Mathematics and Statistics, new teaching methods, assessment, validation and the impact of new technologies and it will continue to provide information on the latest trends and developments in this ever-expanding subject. The publications of papers are selected through double peer reviewed to ensure originality, relevance, and readability. The articles published in our journal can be accessed online.
2. 294 J.-N. Pan et al. / Expert Systems With Applications 62 (2016) 293–301
neighboring stages and the residual EWMA and CUSUM control
charts for each stage can be constructed accordingly. Then, we pro-
pose a new Overall Run Length (ORL) for evaluating the overall
detecting ability of new control chars for multistage manufactur-
ing systems. In addition, the cumulative density function (CDF) of
ORL is derived and its correctness has also been confirmed. Subse-
quently, a simulation study is conducted to explore various combi-
nation of control parameters for multistage residual control charts
when the average of Overall In-Control Run Length (AOIRL) is fixed
at 370 (i.e. we fix the type I error rate of the overall multistage sys-
tem at 0.27%). Once the AOIRL is fixed at 370, the average of Over-
all Out-of-Control Run Length (AOORL) is used to evaluate the de-
tecting ability of multistage residual control charts when the mul-
tistage system is out of control. Furthermore, a sensitivity analysis
is performed to explore the effect of AOORL on the detecting abil-
ity of multistage residual control charts when the number of stage
increases. Finally, a numerical example with oxide thickness mea-
surements of a three-stage silicon wafer manufacturing process is
used to illustrate the usefulness of our proposed multistage resid-
ual control charts in the Phase II monitoring.
2. Literature review
2.1. Monitoring the process quality for multistage systems
In a multistage manufacturing system, the quality characteris-
tics of interest are often highly dependent. To monitor and diag-
nose the multistage manufacturing system, Zhang (1984), Zhang
(1987), Zhang (1990) & Zhang (1992) proposed the Cause-Selecting
Charts (CSCs). The advantage of this method is that once an out-
of-control signal or a special cause occurs in the process, it can
effectively distinguish which stage/subprocess is out of control.
To monitor quality of a process with multivariate variables,
Hawkins (1991) proposed Shewhart and CUSUM control charts
based on regression-adjusted variables. He further proposed the
concept of group charts. Tsung & Xiang (2004) proposed Group
EWMA Chart with One-Step Forecasting Errors (OFSE) combining
quality characteristics from multistage manufacturing system into
a single stage control statistic. The control statistic is defined as:
MZj = max
1≤k≤N
Zk,j
where Zk, j is the EWMA statistics of jth OFSE. Even though this
control statistics combine the multistage control charts into a sin-
gle stage control chart, it doesn’t preserve the structure of CSCs
and thus loses the advantage of using CSCs. Moreover, it is not
easy to trace back to the root stage where the subprocess is out
of control.
Yang & Yang (2006) considered a two-step process in which
the observations X in the first step can be modeled as an auto-
correlated autoregressive model of order 1 (AR(1)) model and the
observations in the second step Y can be modeled as a transfer
function of X. The AR(1) model they used can be written as:
Xt = (1 − φ)ξX + φXt−1 + at , t = 1, 2, . . .
where ξX is the process mean of the first step, φ is the autoregres-
sive parameter satisfying φ < 1 and at are assumed to be indepen-
dent normal random variables with mean 0 and variance σ2
a . The
transfer function to express the relationship between X and Y is:
Yt = CY + V0Xt + V1Xt−1 + Nt ,t = 1, 2, . . .
where CY is a constant and Nts are independent normal random
variables with mean 0 and variance σ2
N
. Recently, Davoodi and Ni-
aki (2012) proposed a maximum likelihood method to estimate
the step-change time of the location parameter in multistage pro-
cesses.
2.2. Residual-based EWMA control chart
Lu & Reynolds (1999) proposed a residual-based EWMA con-
trol chart for monitoring the mean of process in which the obser-
vations can be described as an ARMA(1,1) model. The residual of
ARMA(1,1) model can be expressed as:
ek = Xk − ξ0 − φ(Xk−1 − ξ0) + θek−1,
where ξ0 is the process mean, φ is the autoregressive parameter
and θ is the moving average parameter. The control statistics of
the residual EWMA control chart is defined as:
Rk = (1 − λ)Rk−1 + λek
where λ is smoothing constant and ek the residual.
Lu & Reynolds (1999) assessed the performance of observation-
based and residual-based EWMA control charts respectively when
dealing with auto-correlated observations. It was found that their
performances were fairly close when monitoring low or medium
auto-correlated process. But, for a highly auto-correlated process,
the residual EWMA control chart is more effective in detecting a
process mean shift.
2.3. Residual-based CUSUM control chart
Lu & Reynolds (2001) introduced a two-sided residual CUSUM
control chart and its control statistics is defined as:
CR+
k
= max 0,CR+
k−1
+ (ek − rσe) ,
CR−
k
= max 0,CR−
k−1
− (ek + rσe)
where r is the reference value, CR+
0
= CR−
0
= 0. If the control statis-
tic CR+
k
or CR−
k
exceeds ± cσe, then control charts sends out a
warning signal. Lu & Reynolds (2001) further assessed the perfor-
mance of residual-based CUSUM control chart when dealing with
auto-correlated observations. It was found that the residual-based
CUSUM control chart has similar performance with the residual-
based EWMA control chart proposed by Lu & Reynolds (2001).
Asadzadeh et al. (2012) pointed out that their proposed con-
trol charts can be applied to multistage manufacturing processes
(MMPs) and multistage service operations (MSOs), such as surviv-
ability measures in healthcare services. Asadzadeh et al. (2013) de-
veloped a cause-selecting CUSUM control chart based on pro-
portional hazard model and binary frailty model. Moreover,
Asadzadeh et al. (2015) revised proportional hazard model to han-
dle autocorrelation within observations and proposed one CUSUM
and two EWMA control charts. The other type of EWMA control
chart can be referred to Yang et al. (2011) in which they proposed
a nonparametric version of the EWMA Sign chart without assum-
ing a process distribution.
3. Development of multistage residual control charts
Yang & Yang (2006) considered a two-step process in which the
observations X in the first step can be modeled as an AR(1) model
and observations in the second step Y can be modeled as a transfer
function of X. However, they did not take the autocorrelation of Yt
into account when constructing multistage system models. In this
section, a new multiple regression model for multistage manufac-
turing processes is developed by considering both the autocorrela-
tion within stage and the correlation occurring between the neigh-
boring stages. Then, the residual EWMA and CUSUM control charts
for each stage can be constructed accordingly.
3. J.-N. Pan et al. / Expert Systems With Applications 62 (2016) 293–301 295
Fig. 1. Structure of a multistage system model.
3.1. The structure of a multistage system model
Let Yi, j be the process variable for jth sample taken from ith
stage. Then, the structure of our proposed multistage system model
can be shown in Fig. 1:
Since AR(1) is a commonly used time series model for autocor-
related data and most researchers such as Lawless et al. (1999),
Agrawal et al. (1999) Yang and Yang (2006), Davoodi and Niaki
(2012) used it to represent the variation transmissions in multi-
stage processes, the 1st stage data can be fitted with the following
AR(1) model:
Y1,j = (1 − φ)ξY1,0
+ φY1,j−1 + ε1,j, j = 1, 2, . . .
where Y1, j is the process variable for jth sample taken from 1st
stage, Y1, j−1 is the process variable for ( j − 1) th sample taken
from the 1st stage, ξY1,0
is the process mean of the 1st stage, φ
is the autoregressive parameter and ɛ1, j is assumed to be an in-
dependent normal random variable with mean 0 and variance σ2
ε1
.
Then, the estimated time series model can be expressed as ˆY1, j =
(1 − ˆφ)ξY1,0
+ ˆφY1, j−1 and the residual of the jth sample taken from
the 1st stage is defined as eY1,j
= Y1, j − ˆY1, j. Starting from the 2nd
stage, the process variable for each stage of a multistage system
can be written as the following multiple regression model without
loss of generality:
⎧
⎪⎪⎪⎪⎪⎨
⎪⎪⎪⎪⎪⎩
Y2,j = β2,0 + β2,1Y2,j−1 + β2,2Y1,j + ε2,j, j = 1, 2, . . .
Y3,j = β3,0 + β3,1Y3,j−1 + β3,2Y2,j + ε3,j, j = 1, 2, . . .
YW−1,j = βW−1,0 + βW−1,1YW−1,j−1 + βW−1,2YW−2,j + εW−1,j,
j = 1, 2, . . .
YW,j = βW,0 + βW,1YW,j−1 + βW,2YW−1,j + εW,j, j = 1, 2, . . .
where Yi, j is the process variable for jth sample taken from ith
stage and Yi, j−1 is the process variable for ( j − 1)th sample taken
from ith stage. βi, 0 is a constant, i = 2, . . . , W. ɛi, j is assumed to be
an independent normal random variable with mean 0 and variance
σ2
εi
, i = 1, . . . , W.
Hence, the least square estimator of process variable for jth
sample taken from ith stage is given by
ˆYi,j = ˆβi,0 + ˆβi,1Yi,j−1 + ˆβi,2Yi−1,j, i = 2, . . . , W
and the residual of jth sample taken from ith stage is defined as
eYi,j
= Yi, j − ˆYi, j, i = 2, . . . , W where eYi,j
is assumed to be an inde-
pendent normal random variable with mean 0 and variance σ2
εi
.
3.2. Multistage residual EWMA control chart
The control statistic for our proposed multistage residual
EWMA control chart is defined as:
Zo = μeYi,j
, j = 0, i = 1, . . .W
Zj = λeYi,j
+ (1 − λ)Zj−1, j = 1, 2, 3 . . . , i = 1, . . . ,W
where eYi,j
is residual of observation from ith stage, λ is smoothing
constant, 0 < λ ≤ 1 and μeYi,j
is initial value. Then, the control
statistic and control limits of residual EWMA control chart can be
written as:
⎧
⎪⎪⎪⎪⎪⎪⎨
⎪⎪⎪⎪⎪⎪⎩
UCL = ZeYi,j
+ LσeYi,j
λ
(2−λ)
1 − (1 − λ)2 j
contorl statistic = ZeYi,j
LCL = ZeYi,j
− LσeYi,j
λ
(2−λ)
1 − (1 − λ)2 j
where L is control limit.
3.3. Multistage residual CUSUM control chart
The control statistic for our proposed multistage residual
CUSUM control chart can be defined as:
CR+
eYi,j
= max 0, eYi,j
− kσei
+ CR+
eYi,j−1
,
CR−
eYi,t
= max 0, −kσei
− eYi,j
+ CR−
eYi,j−1
where eYi,j
is residual of observation from ith stage, kσei
is ref-
erence value, CR+
eYi,0
= CR−
eYi,0
= 0. If the control statistic CR+
eYi,j
or
CR−
eYi,j
exceeds decision limits ±hσei
, then CUSUM control chart will
give the warning signals.
3.4. Criterion for evaluating detecting ability of multistage control
charts
In order to detect the process changes early, the Overall In-
Control Run Length (OIRL) defined in Eq. (1) is proposed as a crite-
rion for evaluating the overall detecting ability of multistage con-
trol charts when a multistage process is in control,
OIRL = min(IRL1, IRL2, IRL3, . . . , IRLi), i ≥ 1 (1)
where IRLi represents the value of in-control run length of ith
stage. When a multistage process is in control, we expect the av-
erage of OIRL ≥ 370 so that type I error rate of overall multistage
system can be maintained at α ≤ 0.27%. Moreover, when a multi-
stage process is out of control, we use the Overall Out-of-Control
Run Length (OORL) defined in Eq. (2) as a criterion for evaluating
the overall detecting ability of multistage control charts, i.e.
OORL = min(ORL1, ORL2, ORL3, . . . , ORLi), i ≥ 1 (2)
where ORLi represents the value of out-of-control run length of ith
stage.
3.4.1. Derivation of cumulative distribution function of overall run
length
Due to the fact that run length follows a geometric distribution
and it is the foundation of the process detection using a control
chart, one can assume that the run length of ith stage also follows
a geometric distribution with success probability αi, denoted by
Geo(αi) and define the overall run length (ORL) as
Y = min(RL1, RL2, . . . , RLW),
where RLi ∼ Geo(αi), i = 1 . . . ,W. The cumulative distribution
function of ORL can be derived as below:
P(Y ≤ y) = P(min(RL1, RL2, . . . , RLW) ≤ y)
= 1 − P(min(RL1, RL2, . . . , RLW) > y)
= 1 − P(RL1 > y, RL2 > y, . . . , RLW > y)
= 1 −
W
i=1
P(RLi > y)
4. 296 J.-N. Pan et al. / Expert Systems With Applications 62 (2016) 293–301
Table 1
Various combinations of control parameters (λ, L) for multistage residual EWMA control
chart in which AOIRLs are close to 370 under different autocorrelations.
AOIRL = 370 (λ, L)
φ = 0.25 (0.05, 2.91) (0.10, 3.11) (0.15, 3.16) (0.20, 3.21) (0.25, 3.24)
φ = 0.50 (0.05, 2.94) (0.10, 3.12) (0.15, 3.17) (0.20, 3.23) (0.25, 3.25)
φ = 0.75 (0.05, 2.98) (0.10, 3.15) (0.15, 3.19) (0.20, 3.25) (0.25, 3.27)
= 1 −
W
i=1
[1 − P(RLi ≤ y)]
= 1 −
W
i=1
1 − 1 − (1 − αi)y
= 1 −
W
i=1
(1 − αi)y
= 1 −
W
i=1
(1 − αi)
y
If we let W
i=1(1 − αi) = 1 − α∗, then P(Y ≤ y) = 1 − (1 − α∗)y,
where α∗ = 1 − W
i=1(1 − αi). It is proven that ORL follows a ge-
ometric distribution with success probability α∗. In practice, if we
assume that type I error rate for each stage are equal, then the
type I error of the overall system can be obtained:
α∗
= 1 − (1 − α)W
Hence, if we set the overall type I error rate is α∗ and divided it
into W stages, then the corrected type I error rate α for each stage
can be obtained as:
α = 1 − (1 − α∗
)
1
W
Similar to the run length, ORL statistics can be extended to
ARMA(p,q) models. Thus, one can use our proposed multistage
residual EWMA and CUSUM control charts to detect the process
change in a multistage manufacturing system if the process data
for each stage follow ARMA(p,q) models.
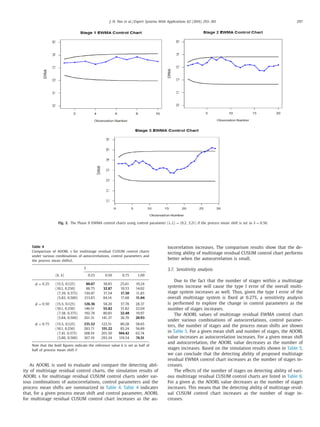
3.5. Simulation results for multistage residual EWMA control charts
In our simulation studies, once the average of OIRL (AOIRL) is
fixed at 370, the average of OORL (AOORL) is used to evaluate the
detecting performance of multistage residual control charts with
that of Phase II control charts after conducting 1000 simulation
runs. Without loss of generality, we consider a multistage system
with three stages and the sample size is set as 3000 for each stage.
Moreover, the process variances for each stages are assumed to
be homogeneous and the amount of process mean shift for each
stage are also assumed to be the same when a multistage system
is out of control. Based on the same setting of control parameter
as shown in Lucas & Saccucci (1990), the AOIRL of our proposed
multistage residual EWMA control chart using (λ, L) = (0.05, 2.615)
equals 500 when the number of stage is set as W = 1. The AOIRL
of our proposed control chart equals 88.32 when the process mean
shift is set to be δ = 0.25. These two results are fairly closed to
those given by Lucas & Saccucci (1990). Thus, the correctness of
our computer simulation program is confirmed.
By fixing the AOIRL at 370, various combinations of control pa-
rameters for multistage residual EWMA control chart under differ-
ent autocorrelations are listed in Table 1. Table 1 indicates that,
for a given autocorrelation φ, the control limit L increases as the
smoothing constant λ increases; for a given smoothing constant λ,
the control limit L increases slightly as the autocorrelation φ in-
creases.
Table 2
Comparison of AOORLs for multistage residual EWMA control charts
under various combinations of autocorrelations, control parameters and
the process mean shiftsδ.
AOORL δ
(λ, L) 0.25 0.50 0.75 1.00
φ = 0.25 (0.05, 2.91) 56.88 5.40 1.12 1.00
(0.10, 3.11) 96.27 18.98 4.04 1.31
(0.15, 3.16) 118.29 28.82 7.71 2.53
(0.20, 3.21) 146.82 40.22 12.70 4.65
(0.25, 3.24) 165.13 48.66 16.39 6.40
φ = 0.50 (0.03, 2.79) 78.01 8.90 1.31 1.00
(0.05, 2.94) 118.95 25.48 4.88 1.36
(0.10, 3.12) 180.32 54.29 17.69 6.27
(0.15, 3.17) 196.25 69.40 27.00 11.24
(0.20, 3.23) 237.28 89.15 38.16 17.32
(0.25, 3.25) 244.64 103.69 49.30 23.18
φ = 0.75 (0.02, 2.74) 207.11 54.47 12.24 3.09
(0.03, 2.83) 228.25 78.75 29.24 8.65
(0.05, 2.98) 264.71 117.42 52.20 25.25
(0.10,3.15) 327.80 177.95 93.73 53.23
(0.15,3.19) 310.68 191.59 111.03 69.71
(0.20,3.25) 337.12 224.00 139.51 88.98
(0.25,3.27) 335.02 236.75 157.49 103.93
Table 3
Various combinations of control parameters (h, k) for multistage residual CUSUM
control charts in which AOIRLs are close to 370 under different autocorrelations.
AOIRL = 370 (h, k)
φ = 0.25 (15.5, 0.125) (10.1, 0.250) (7.39, 0.375) (5.82, 0.500)
φ = 0.50 (15.5, 0.125) (10.1, 0.250) (7.38, 0.375) (5.84, 0.500)
φ = 0.75 (15.5, 0.125) (10.1, 0.250) (7.41, 0.375) (5.80, 0.500)
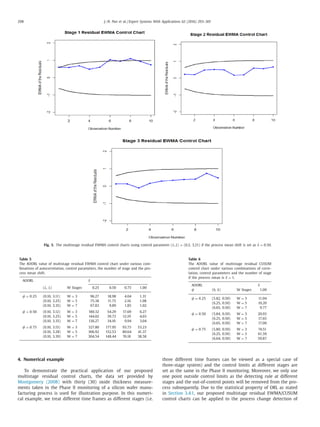
As AOORL is used to evaluate and compare the detecting ability
of multistage residual control charts, simulation results of AOORLs
for multistage residual EWMA control charts under various com-
binations of autocorrelations, control parameters and the process
mean shifts are summarized in Table 2. For a given process mean
shift and control parameter, AOORL increases as autocorrelation in-
creases. The comparison results show that the detecting ability of
multistage residual EWMA control chart performs better when the
autocorrelation is small. Thus, it is suggested to choose a smaller
smoothing constant for a process with high autocorrelation. For ex-
ample, λ = 0.03 (λ = 0.02) is a better choice for smoothing con-
stant as the autocorrelation φ = 0.5 (φ = 0.75). In addition, the
optimal choice of smoothing constant is in the range 0.01 < λ ≤
0.05 for a process with moderate or high autocorrelation.
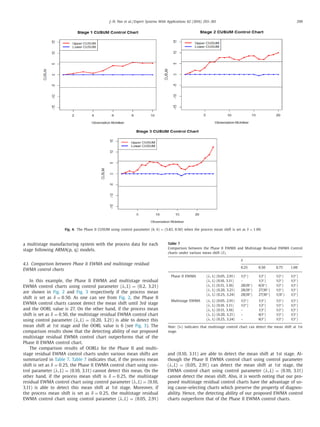
3.6. Simulation results for multistage residual CUSUM control chart
By fixing the AOIRL at 370, various combinations of control pa-
rameters for CUSUM under different autocorrelations (φ = 0.25,
0.5, 0.75) are listed in Table 3. Table 3 indicates that, for a
given autocorrelation, the reference value (k) increases as decision
limit (h) decrease. This result is consistent with the findings of
Hawkins (1993). Moreover, for a given reference value, the decision
limit is insensitive to the autocorrelation.
5. J.-N. Pan et al. / Expert Systems With Applications 62 (2016) 293–301 297
Fig. 2. The Phase II EWMA control charts using control parameter (λ, L) = (0.2, 3.21) if the process mean shift is set as δ = 0.50.
Table 4
Comparison of AOORL s for multistage residual CUSUM control charts
under various combinations of autocorrelations, control parameters and
the process mean shiftsδ.
δ
(h, k) 0.25 0.50 0.75 1.00
φ = 0.25 (15.5, 0.125) 80.67 38.85 25.61 19.24
(10.1, 0.250) 88.75 32.87 19.53 14.02
(7.39, 0.375) 130.47 37.54 17.50 11.85
(5.82, 0.500) 213.83 84.14 17.68 11.04
φ = 0.50 (15.5, 0.125) 126.36 58.20 37.78 28.37
(10.1, 0.250) 146.51 55.82 31.82 22.04
(7.38, 0.375) 192.78 80.85 32.48 19.97
(5.84, 0.500) 261.31 141.37 36.70 20.93
φ = 0.75 (15.5, 0.125) 231.52 122.51 80.28 58.65
(10.1, 0.250) 283.71 151.22 85.24 56.89
(7.41, 0.375) 308.19 201.50 104.42 63.74
(5.80, 0.500) 367.19 293.34 119.54 74.51
Note that the bold figures indicate the reference value k is set as half of
half of process mean shift δ
As AOORL is used to evaluate and compare the detecting abil-
ity of multistage residual control charts, the simulation results of
AOORL s for multistage residual CUSUM control charts under var-
ious combinations of autocorrelations, control parameters and the
process mean shifts are summarized in Table 4. Table 4 indicates
that, for a given process mean shift and control parameter, AOORL
for multistage residual CUSUM control chart increases as the au-
tocorrelation increases. The comparison results show that the de-
tecting ability of multistage residual CUSUM control chart performs
better when the autocorrelation is small.
3.7. Sensitivity analysis
Due to the fact that the number of stages within a multistage
systems increase will cause the type I error of the overall multi-
stage system increases as well. Thus, given the type I error of the
overall multistage system is fixed at 0.27%, a sensitivity analysis
is performed to explore the change in control parameters as the
number of stages increases.
The AOORL values of multistage residual EWMA control chart
under various combinations of autocorrelations, control parame-
ters, the number of stages and the process mean shifts are shown
in Table 5. For a given mean shift and number of stages, the AOORL
value increases as autocorrelation increases. For a given mean shift
and autocorrelation, the AOORL value decreases as the number of
stages increases. Based on the simulation results shown in Table 5,
we can conclude that the detecting ability of proposed multistage
residual EWMA control chart increases as the number of stages in-
creases.
The effects of the number of stages on detecting ability of vari-
ous multistage residual CUSUM control charts are listed in Table 6.
For a given φ, the AOORL value decreases as the number of stages
increases. This means that the detecting ability of multistage resid-
ual CUSUM control chart increases as the number of stage in-
creases.
6. 298 J.-N. Pan et al. / Expert Systems With Applications 62 (2016) 293–301
Fig. 3. The multistage residual EWMA control charts using control parameter (λ, L) = (0.2, 3.21) if the process mean shift is set as δ = 0.50.
Table 5
The AOORL value of multistage residual EWMA control chart under various com-
binations of autocorrelation, control parameters, the number of stage and the pro-
cess mean shift.
AOORL δ
(λ, L) W Stages 0.25 0.50 0.75 1.00
φ = 0.25 (0.10, 3.11) W = 3 96.27 18.98 4.04 1.31
(0.10, 3.25) W = 5 75.38 11.75 2.16 1.08
(0.10, 3.35) W = 7 67.83 9.89 1.85 1.02
φ = 0.50 (0.10, 3.12) W = 3 180.32 54.29 17.69 6.27
(0.10, 3.25) W = 5 144.02 39.73 12.19 4.03
(0.10, 3.35) W = 7 136.27 34.10 9.94 3.04
φ = 0.75 (0.10, 3.15) W = 3 327.80 177.95 93.73 53.23
(0.10, 3.28) W = 5 306.92 152.53 80.64 41.37
(0.10, 3.39) W = 7 304.54 148.44 76.18 38.58
4. Numerical example
To demonstrate the practical application of our proposed
multistage residual control charts, the data set provided by
Montgomery (2008) with thirty (30) oxide thickness measure-
ments taken in the Phase II monitoring of a silicon wafer manu-
facturing process is used for illustration purpose. In this numeri-
cal example, we treat different time frames as different stages (i.e.
Table 6
The AOORL value of multistage residual CUSUM
control chart under various combinations of corre-
lation, control parameters and the number of stage
if the process mean is δ = 1.
AOORL δ
φ (h, k) W Stages 1.00
φ = 0.25 (5.82, 0.50) W = 3 11.04
(6.25, 0.50) W = 5 10.20
(6.65, 0.50) W = 7 9.77
φ = 0.50 (5.84, 0.50) W = 3 20.93
(6.25, 0.50) W = 5 17.65
(6.65, 0.50) W = 7 17.00
φ = 0.75 (5.80, 0.50) W = 3 74.51
(6.25, 0.50) W = 5 61.59
(6.64, 0.50) W = 7 59.87
three different time frames can be viewed as a special case of
three-stage system) and the control limits at different stages are
set as the same in the Phase II monitoring. Moreover, we only use
one point outside control limits as the detecting rule at different
stages and the out-of-control points will be removed from the pro-
cess subsequently. Due to the statistical property of ORL as stated
in Section 3.4.1, our proposed multistage residual EWMA/CUSUM
control charts can be applied to the process change detection of
7. J.-N. Pan et al. / Expert Systems With Applications 62 (2016) 293–301 299
Fig. 4. The Phase II CUSUM using control parameter (h, k) = (5.82, 0.50) when the process mean shift is set as δ = 1.00.
a multistage manufacturing system with the process data for each
stage following ARMA(p, q) models.
4.1. Comparison between Phase Ii EWMA and multistage residual
EWMA control charts
In this example, the Phase II EWMA and multistage residual
EWMA control charts using control parameter (λ, L) = (0.2, 3.21)
are shown in Fig. 2 and Fig. 3 respectively if the process mean
shift is set as δ = 0.50. As one can see from Fig. 2, the Phase II
EWMA control charts cannot detect the mean shift until 3rd stage
and the OORL value is 27. On the other hand, if the process mean
shift is set as δ = 0.50, the multistage residual EWMA control chart
using control parameter (λ, L) = (0.20, 3.21) is able to detect this
mean shift at 1st stage and the OORL value is 6 (see Fig. 3). The
comparison results show that the detecting ability of our proposed
multistage residual EWMA control chart outperforms that of the
Phase II EWMA control chart.
The comparison results of OORLs for the Phase II and multi-
stage residual EWMA control charts under various mean shifts are
summarized in Table 7. Table 7 indicates that, if the process mean
shift is set as δ = 0.25, the Phase II EWMA control chart using con-
trol parameter (λ, L) = (0.10, 3.11) cannot detect this mean. On the
other hand, if the process mean shift is δ = 0.25, the multistage
residual EWMA control chart using control parameter (λ, L) = (0.10,
3.11) is able to detect this mean shift at 1st stage. Moreover, if
the process mean shift is set as δ = 0.25, the multistage residual
EWMA control chart using control parameter (λ, L) = (0.05, 2.91)
Table 7
Comparison between the Phase II EWMA and Multistage Residual EWMA Control
charts under various mean shift (δ).
δ
0.25 0.50 0.75 1.00
Phase II EWMA (λ, L) (0.05, 2.91) 1(I∗
) 1(I∗
) 1(I∗
) 1(I∗
)
(λ, L) (0.10, 3.11) – 1(I∗
) 1(I∗
) 1(I∗
)
(λ, L) (0.15, 3.16) 28(III∗
) 6(II∗
) 1(I∗
) 1(I∗
)
(λ, L) (0.20, 3.21) 28(III∗
) 27(III∗
) 1(I∗
) 1(I∗
)
(λ, L) (0.25, 3.24) 28(III∗
) 27(III∗
) 1(II∗
) 1(I∗
)
Multistage EWMA (λ, L) (0.05, 2.91) 1(I∗
) 1(I∗
) 1(I∗
) 1(I∗
)
(λ, L) (0.10, 3.11) 1(I∗
) 1(I∗
) 1(I∗
) 1(I∗
)
(λ, L) (0.15, 3.16) – 1(I∗
) 1(I∗
) 1(I∗
)
(λ, L) (0.20, 3.21) – 6(I∗
) 1(I∗
) 1(I∗
)
(λ, L) (0.25, 3.24) – 6(I∗
) 1(I∗
) 1(I∗
)
Note: (I∗) indicates that multistage control chart can detect the mean shift at 1st
stage.
and (0.10, 3.11) are able to detect the mean shift at 1st stage. Al-
though the Phase II EWMA control chart using control parameter
(λ, L) = (0.05, 2.91) can detect the mean shift at 1st stage, the
EWMA control chart using control parameter (λ, L) = (0.10, 3.11)
cannot detect the mean shift. Also, it is worth noting that our pro-
posed multistage residual control charts have the advantage of us-
ing cause-selecting charts which preserve the property of diagnos-
ability. Hence, the detecting ability of our proposed EWMA control
charts outperform that of the Phase II EWMA control charts.
8. 300 J.-N. Pan et al. / Expert Systems With Applications 62 (2016) 293–301
Fig. 5. The multistage residual CUSUM control chart using control parameter (h, k) = (5.82, 0.50) if the process mean shift is set as δ = 1.00.
Table 8
Comparison of OORLs between the Phase II CUSUM and Multistage Residual CUSUM Control charts un-
der various mean shifts (δ).
δ
0.25 0.50 0.75 1.00
Phase II
CUSUM (h, k) (15.5, 0.125) (10.1, 0.25) (7.39, 0.375) (5.82, 0.50)
– – 20(II∗
) 8(II∗
)
Multistage CUSUM (h, k) (15.5, 0.125) (10.1, 0.25) (7.39, 0.375) (5.82, 0.50)
– – 9(I∗
) 6(I∗
)
Note: (I∗
) indicates that multistage control chart can detect the mean shift at 1st stage.
4.2. Comparison between Phase II CUSUM and multistage residual
CUSUM control charts
The Phase II CUSUM control charts using control parameter (h,
k) = (5.82, 0.50) are shown as in Fig. 4 when the process mean
shift is set as δ = 1.00. As shown in Fig. 4, the Phase II CUSUM
control chart cannot detect the mean shift until 2nd stage. The
OORL value is 8.
If the process mean shift is set as δ = 1.00, the multistage
residual CUSUM control chart using the same control parameter is
shown in Fig. 5. Note that the multistage residual CUSUM control
chart will be able to detect this mean shift at 1st stage and the
OORL value is 6.
In addition, the comparison results of OORLs for the Phase II
and multistage residual CUSUM control charts under various pro-
cess mean shifts are summarized in Table 8. Note that, if the pro-
cess mean shift is set as δ = 0.75, the multistage residual CUSUM
control chart is able to detect the mean shift at 1st stage (OORL
= 9), whereas the Phase II CUSUM control chart cannot detect the
mean shift until 2nd stage (OORL = 20). Based on the compar-
ison results shown in Tables 7 and 8, we can conclude that the
detecting ability of our proposed multistage residual EWMA and
CUSUM control charts outperform that of the Phase II EWMA and
CUSUM control charts. Moreover, our proposed multistage residual
control charts have the advantage of using cause-selecting charts
which preserve the property of diagonosibility. Hence, the detect-
ing ability of our proposed control charts outperform that of the
Phase II control charts.
5. Conclusions and discussions
Considering both the autocorrelated process outputs and the
correlation occurring between neighboring stages, we have suc-
cessfully developed a new multiple regression model for mul-
9. J.-N. Pan et al. / Expert Systems With Applications 62 (2016) 293–301 301
tistage manufacturing systems. Then, the residual EWMA and
CUSUM control charts for each stage are constructed accordingly.
An Overall Run Length (ORL) concept is adopted as the criterion
for evaluating the detecting ability of multistage control charts.
The simulation results show that the detecting ability performs
better when the autocorrelation is smaller for multistage resid-
ual EWMA and CUSUM control charts. The cumulative distribution
function (CDF) of ORL is further derived to confirm the correct-
ness of ORL. Finally, a numerical example further illustrates that
the detecting ability of our proposed multistage residual EWMA
and CUSUM control charts outperform that of the existing Phase II
EWMA and CUSUM control charts respectively. Both simulation re-
sults and numerical example indicate that our proposed approach
provide more precise process control for auto-correlated process
outputs. It is worthy to note that, in our simulation study, the pro-
cess variances for each stage is assumed to be homogeneous and
the amount of process mean shifts for each stage are assumed to
be the same when a multistage system is out of control. These as-
sumptions may be lifted in the future studies. Again, the process
data for each stage are assumed to be stationary and follow AR(1)
model without loss generality. Future studies may consider the
cases for other time series models as well as profile data. Similar
research can be extended to develop multivariate residual MEWMA
and MCUSUM control charts for multistage manufacturing systems
with multiple quality characteristics.
Moreover, our proposed multistage EWMA and CUSUM residual
control charts can be further extended to the quality surveillance
of other multistage systems as they have the advantage of using
cause-selecting charts which preserve the property of diagonosi-
bility. In contrast with the quality surveillance using the existing
Phase II control charts, one can effectively distinguish a special
cause occurs in a particular stage and thus provides diagnostic in-
formation regarding which stage is out-of-control using our pro-
posed scheme. Although the assumption of our proposed multi-
stage residual EWMA and CUSUM control charts is based on the
AR(1) model, it can be extended to other time series models, such
as ARMA(p, q),etc. Thus, the new approach provides a better al-
ternative for detecting the process change in multistage systems
with auto-correlated process outputs. A computerized algorithm
can also be written based on our proposed scheme for the mul-
tistage residual EWMA/CUSUM control charts and it may be fur-
ther converted to an expert and intelligent system. Hopefully, the
results of this study can provide a better alternative for detecting
process change and serve as a useful guideline for quality prac-
titioners when monitoring and controlling the process quality for
multistage systems with auto-correlated data in the Phase II mon-
itoring.
Acknowledgement
The first author would like to gratefully acknowledge financial
support (MOST 104-2410-H-006-049) from the Ministry of Science
and Technology of Taiwan, ROC.
References
Asadzadeh, S., & Aghaie, A. (2012). Improving the product reliability in multistage
manufacturing and service operations. Quality and Reliability Engineering Inter-
national, 28(4), 397–407.
Asadzadeh, S., Aghaie, A., & Shahriari, H. (2013). Cause-selecting charts based on
proportional hazards and binary frailty models. International Journal of Industrial
Engineering and Production Research, 24(2), 107–112.
Asadzadeh, S., Aghaie, A., Shahriari, H., & Niaki, S. T. A. (2015). Improving reliability
in multistage processes with autocorrelated observations. Quality Technology and
Quantitative Management, 12(2), 143–157.
Davoodi, M., & Niaki, S. T. A. (2012). Estimating the step-change time of the location
parameter in multistage processes using MLE. Quality and Reliability Engineering
International, 28, 843–855.
Hawkins, D. M. (1991). Multivariate quality control based on regression -adjusted
variables. Technometrics, 33(1), 61–75.
Hawkins, D. M. (1993). Cumulative sum control charting: An underutilized SPC tool.
Quality Engineering, 5(3), 463–477.
Lawless, L. F., MacKay, R. J., & Robinson, J. A. (1999). Analysis of variation trans-
mission in manufacturing processes-part I. Journal of Quality Technology, 31(2),
131–142.
Lu, C. W., & Reynolds, M. R. (1999). EWMA control charts for monitoring the mean
of autocorrelated processes. Journal of Quality Technology, 31(2), 166–188.
Lu, C. W., & Reynolds, M. R. (2001). CUSUM charts for monitoring an autocorrelated
processes. Journal of Quality Technology, 33(3), 66–81.
Lucas, J. M., & Saccucci, M. S. (1990). Exponentially weighted moving average control
schemes: properties and enhancements. Technometrics, 32(1), 1–29.
Montgomery, D. C. (2008). Introduction to statistical quality control (p. 278). New
York: John Wiley & Sons.
Shi, J. (2006). Stream of variation modeling and analysis for multistage manufacturing
processes. Boca Raton, FL: CRC Press.
Tsung, F, & Xiang, L (2004). Multistage process control and monitoring via group
EWMA schemes. Institute of Electrical and Electronic Engineers, 2, 1087–1092.
Yang, S. F., & Yang, C. M. (2006). An approach to controlling two dependent process
steps with autocorrelated observations. International Journal of Advanced Manu-
facturing Technology, 29(1), 170–177.
Yang, S. F., Lin, J. S., & Cheng, S. W. (2011). A new nonparametric EWMA sign control
chart. Expert Systems with Applications, 38(5), 6239–6243.
Zhang, G. X. (1984). A new type of control charts and a theory of diagnosis with
control charts. In World quality congress transactions (pp. 175–185). London:
American Society for Quality Control.
Zhang, G. X. (1987). Cause-selecting control charts a new type of quality control
charts. 41st Annual Quality Congress, Minneapolis, MN, 41(0), 16–21.
Zhang, G. X. (1990). A new diagnosis theory with two kinds of quality. Total Quality
Management, 1(2), 249–257.
Zhang, G. X. (1992). Cause-selecting control chart and diagnosis, theory and prac-
tice. Department of total quality management. Aarhus School of Business. Aarhus,
Denmark.
Zou, C., & Tsung, F. (2008). Directional MEWMA schemes for multistage process
monitoring and diagnosis. Journal of Quality Technology, 40(4), 407–427.