This document provides an overview of Novozymes' latest results and strategy. Some key points:
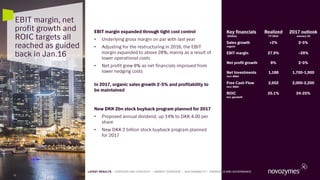
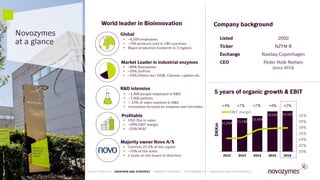
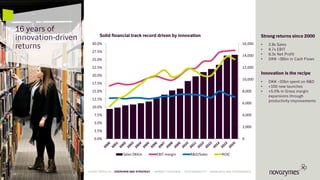
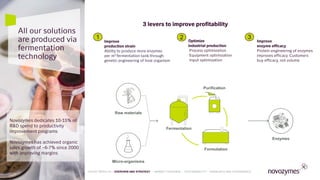
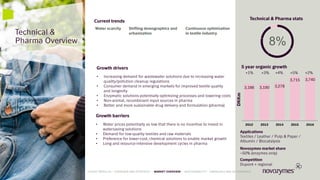
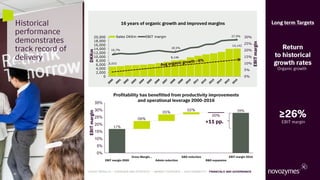
- Novozymes achieved 2% organic sales growth in 2016 with an EBIT margin of 28%, reaching financial targets.
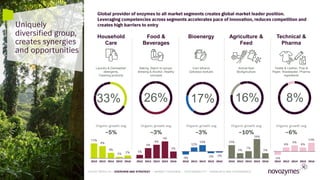
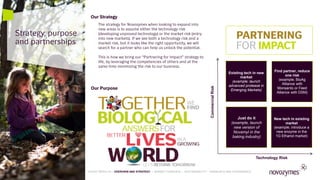
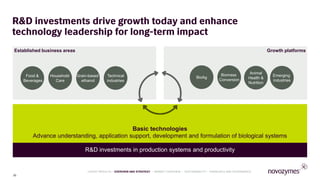
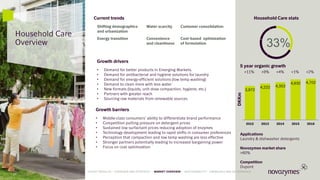
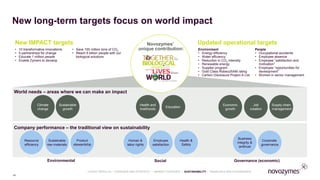
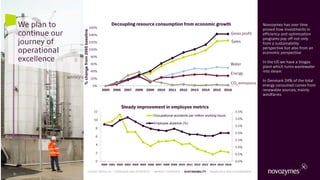
- The company's strategy focuses on investing in growth areas like emerging markets, new product launches, and technology leadership.
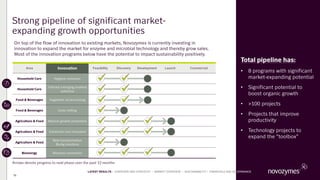
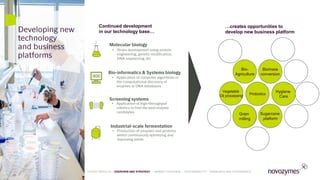
- Novozymes has a strong innovation pipeline with potential to boost organic growth, including new solutions for hygiene, grain milling, and biomass conversion.