Download to read offline

![Ponemon Institute© Research Report Page 22
Data collection methods did not include actual accounting information, but instead relied upon
numerical estimation based on the knowledge and experience of each participant. Within each
category, cost estimation was a two-stage process. First, the benchmark instrument required
individuals to rate direct cost estimates for each cost category by marking a range variable
defined in the following number line format.
How to use the number line: The number line provided under each data breach cost category is one way to
obtain your best estimate for the sum of cash outlays, labor and overhead incurred. Please mark only one
point somewhere between the lower and upper limits set above. You can reset the lower and upper limits of
the number line at any time during the interview process.
Post your estimate of direct costs here for [presented cost category]
LL ______________________________________|___________________________________ UL
The numerical value obtained from the number line rather than a point estimate for each
presented cost category preserved confidentiality and ensured a higher response rate. The
benchmark instrument also required practitioners to provide a second estimate for indirect and
opportunity costs, separately.
To keep the benchmarking process to a manageable size, we carefully limited items to only those
cost activity centers that we considered crucial to data breach cost measurement. Based upon
discussions with learned experts, the final set of items included a fixed set of cost activities. Upon
collection of the benchmark information, each instrument was re-examined carefully for
consistency and completeness.
For purposes of complete confidentiality, the benchmark instrument did not capture any
company-specific information. Subject materials contained no tracking codes or other methods
that could link responses to participating companies.
The scope of data breach cost items contained within our benchmark instrument was limited to
known cost categories that applied to a broad set of business operations that handle personal
information. We believed that a study focused on business process – and not data protection or
privacy compliance activities – would yield a better quality of results.](https://image.slidesharecdn.com/2016costofdatabreachstudy-brasil-160705121532/85/2016-cost-of-data-breach-study-brasil-23-320.jpg)

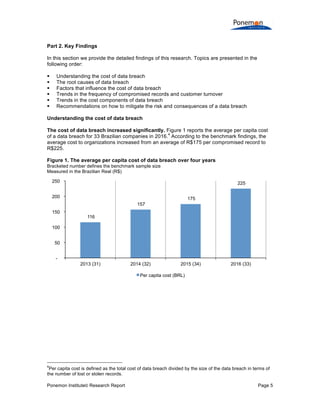
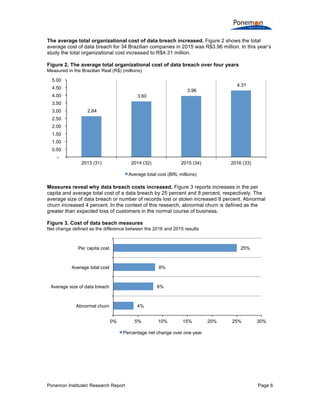
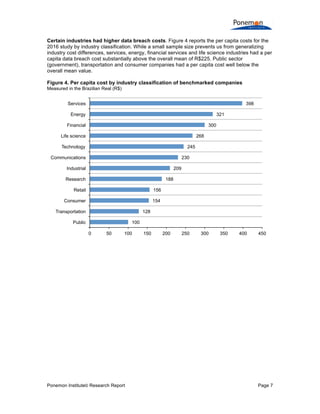
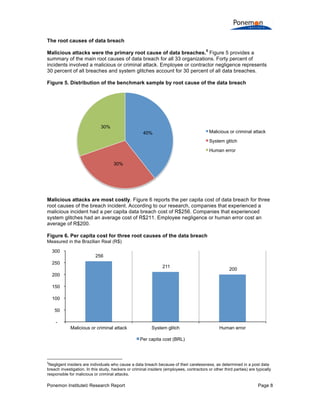
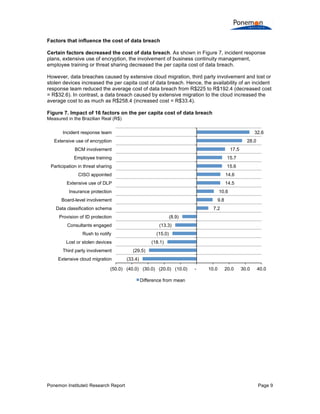
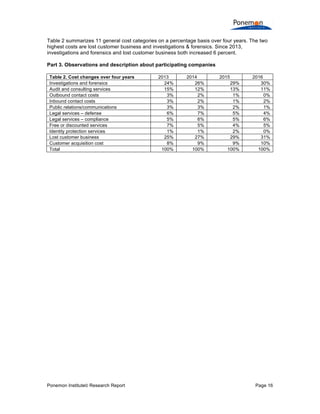
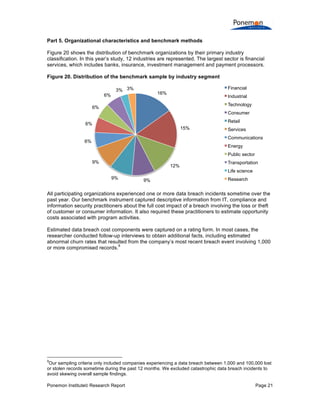
The document summarizes the key findings of a 2016 study on the cost of data breaches in Brazil conducted by IBM and Ponemon Institute. Some of the main findings include: - The average per capita cost of a data breach for Brazilian companies increased significantly from R$175 to R$225. The total average organizational cost also rose from R$3.96 million to R$4.31 million. - Malicious attacks were the leading cause of data breaches and had the highest per capita cost at R$256, followed by system glitches at R$211 and employee negligence at R$200. - Certain industries like services, energy and financial services saw higher per capita costs above the


