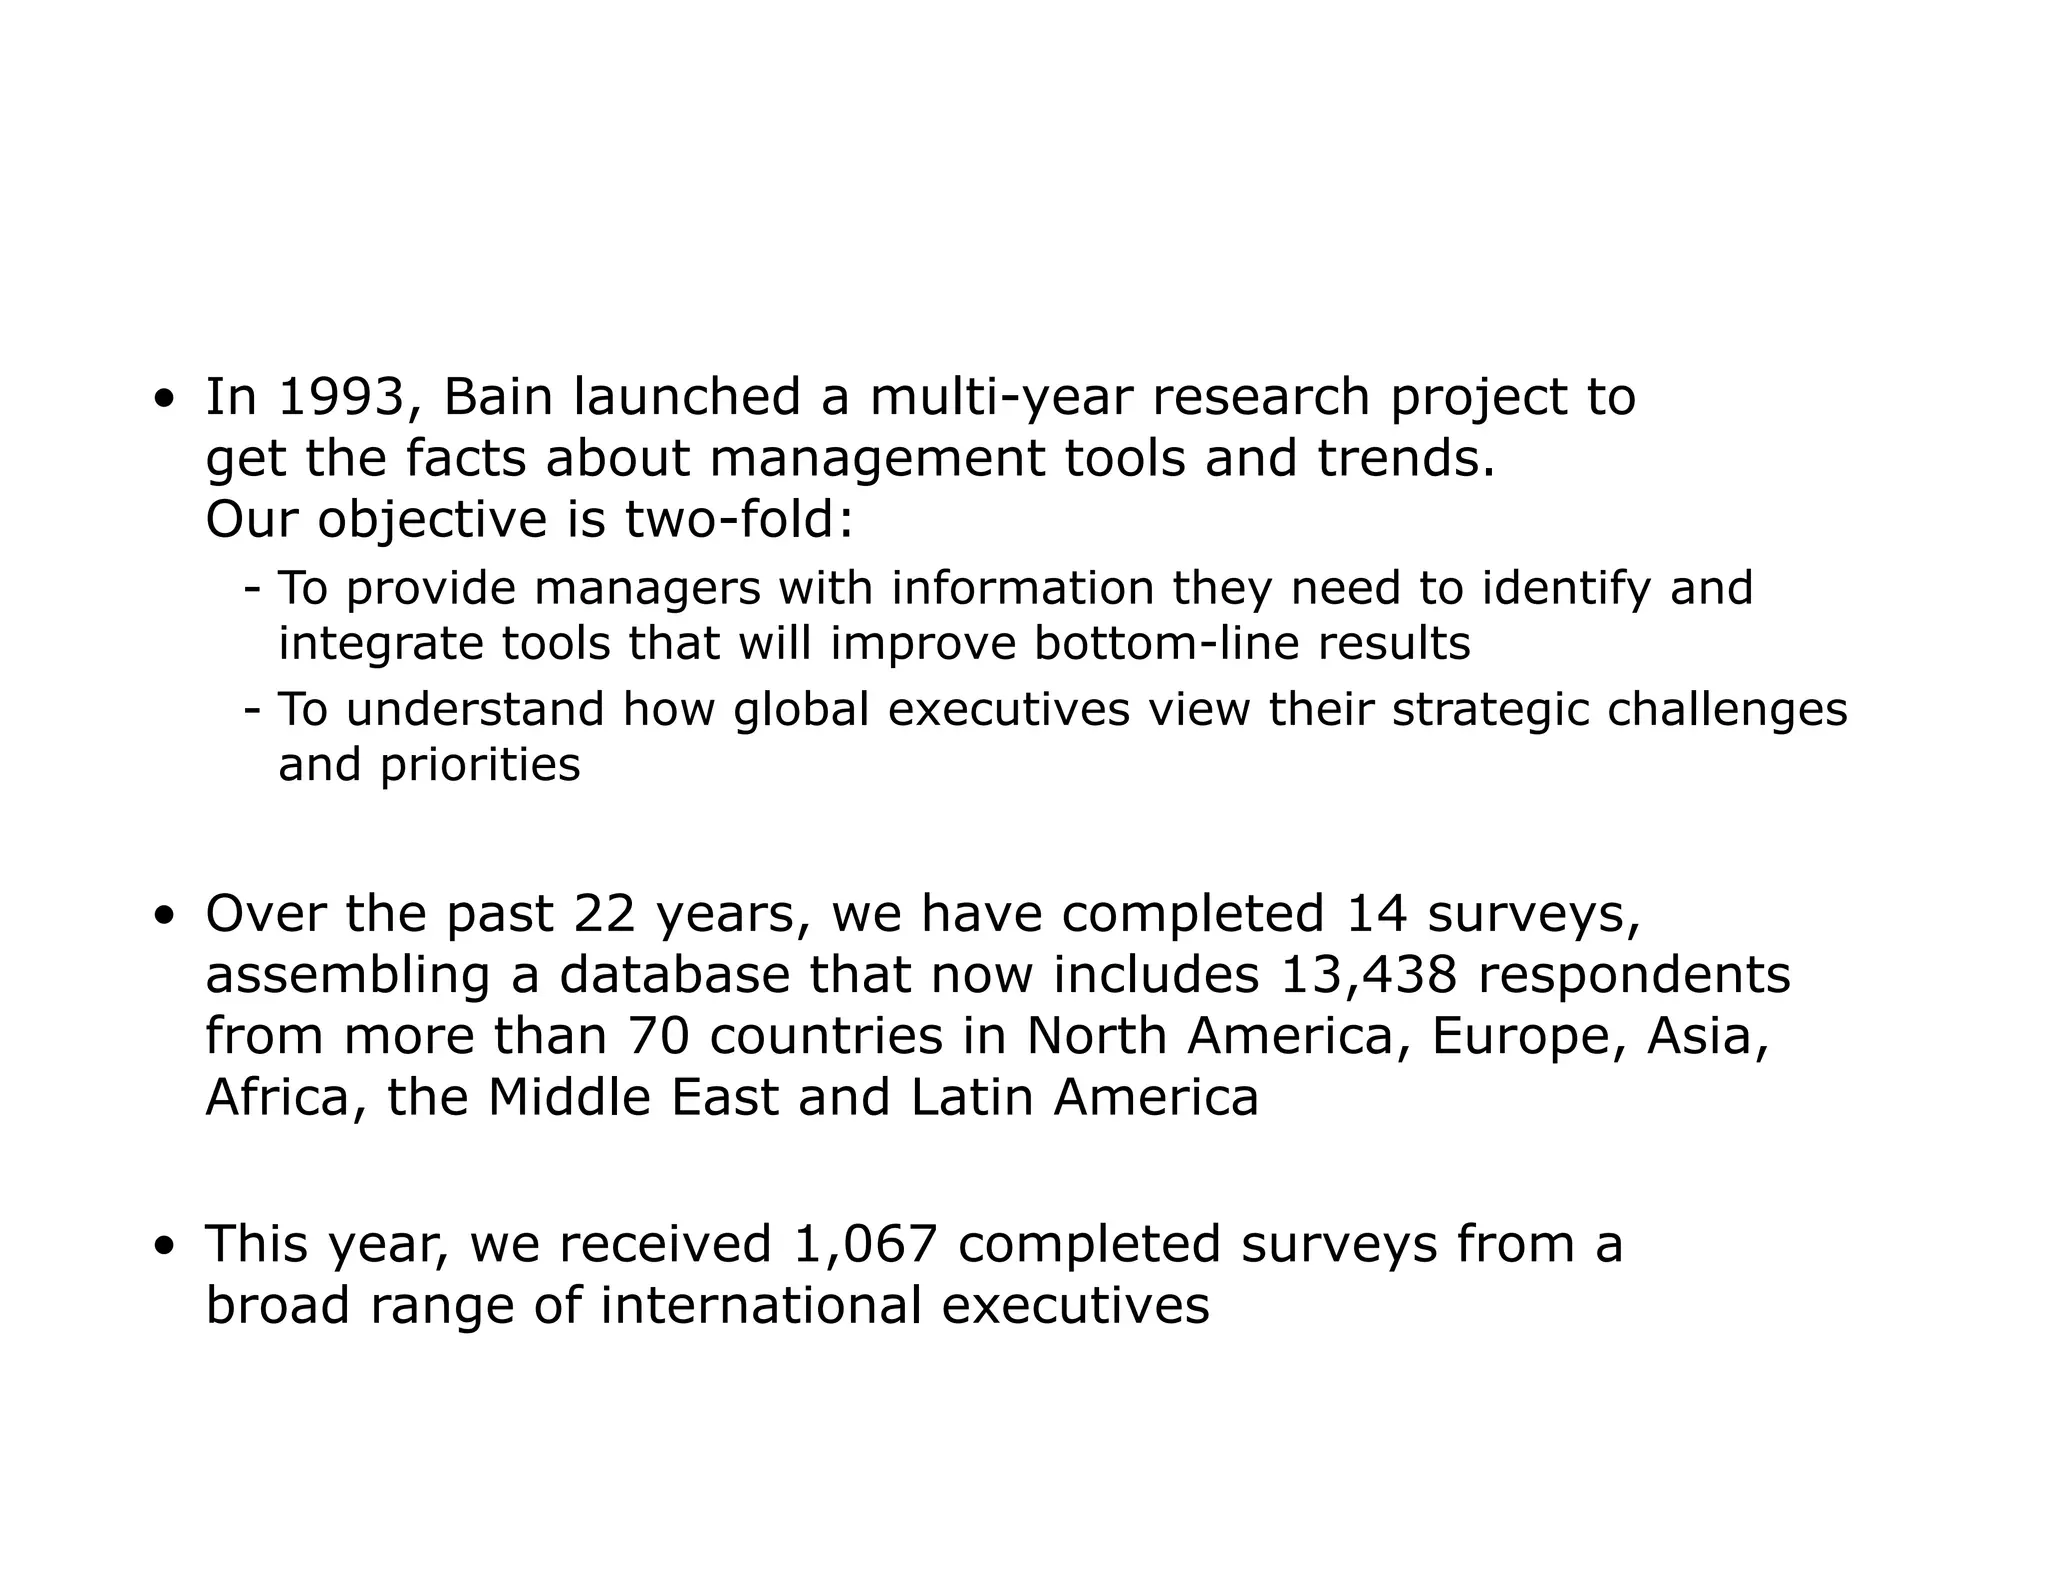
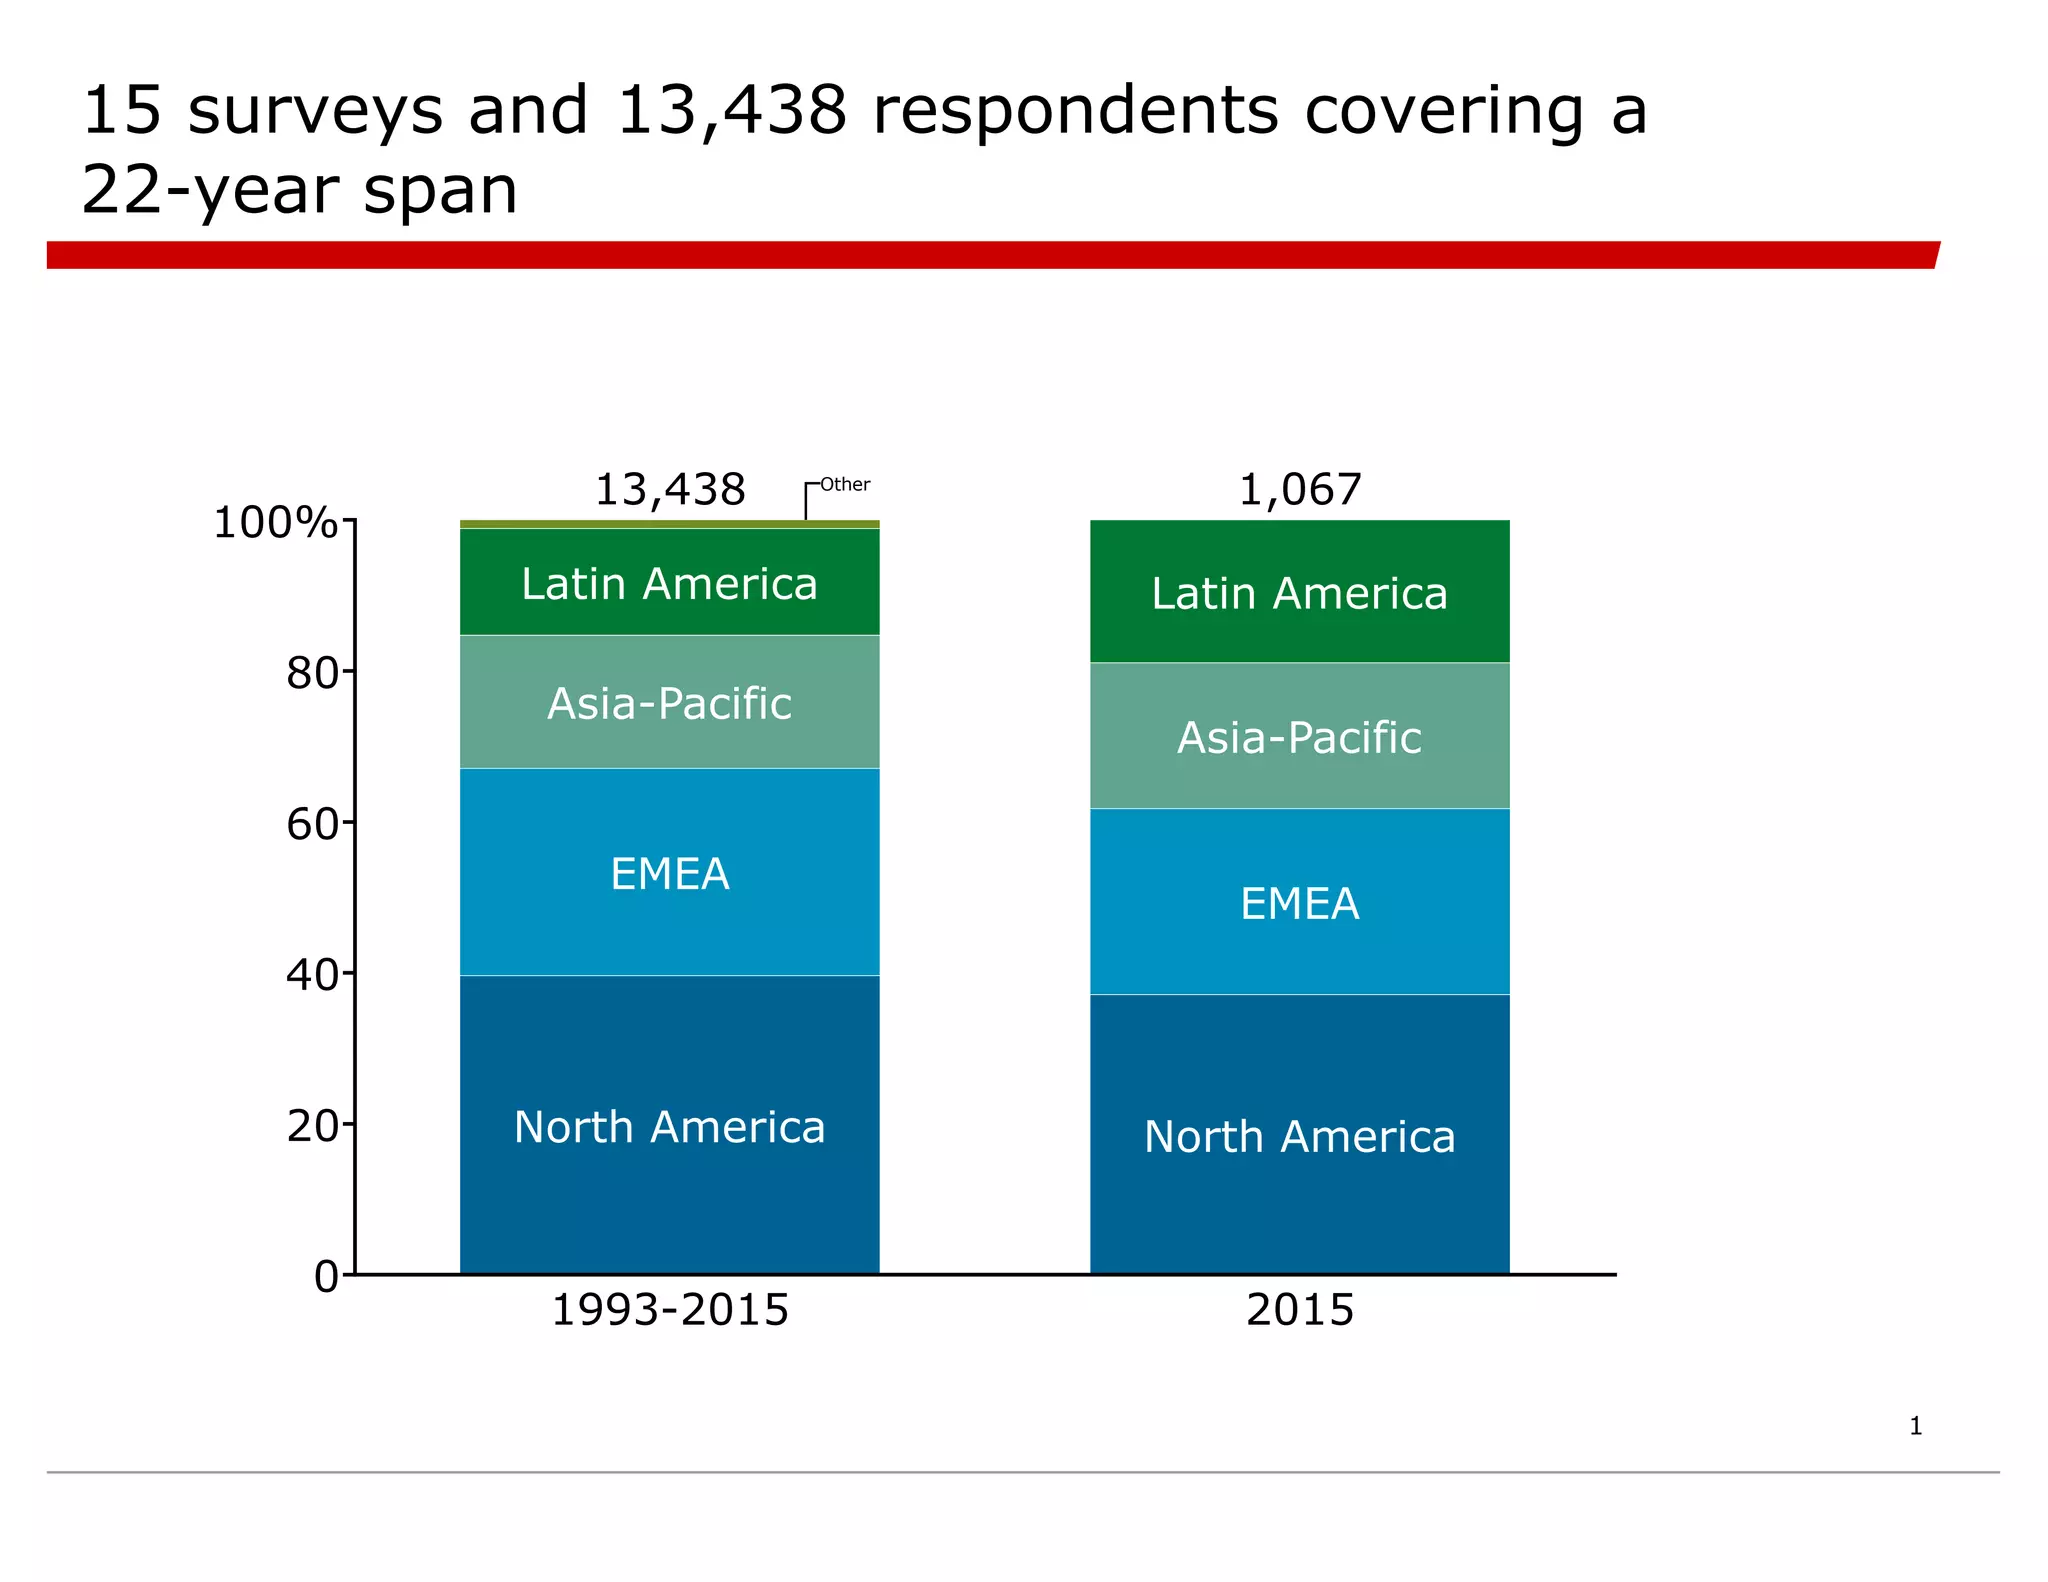
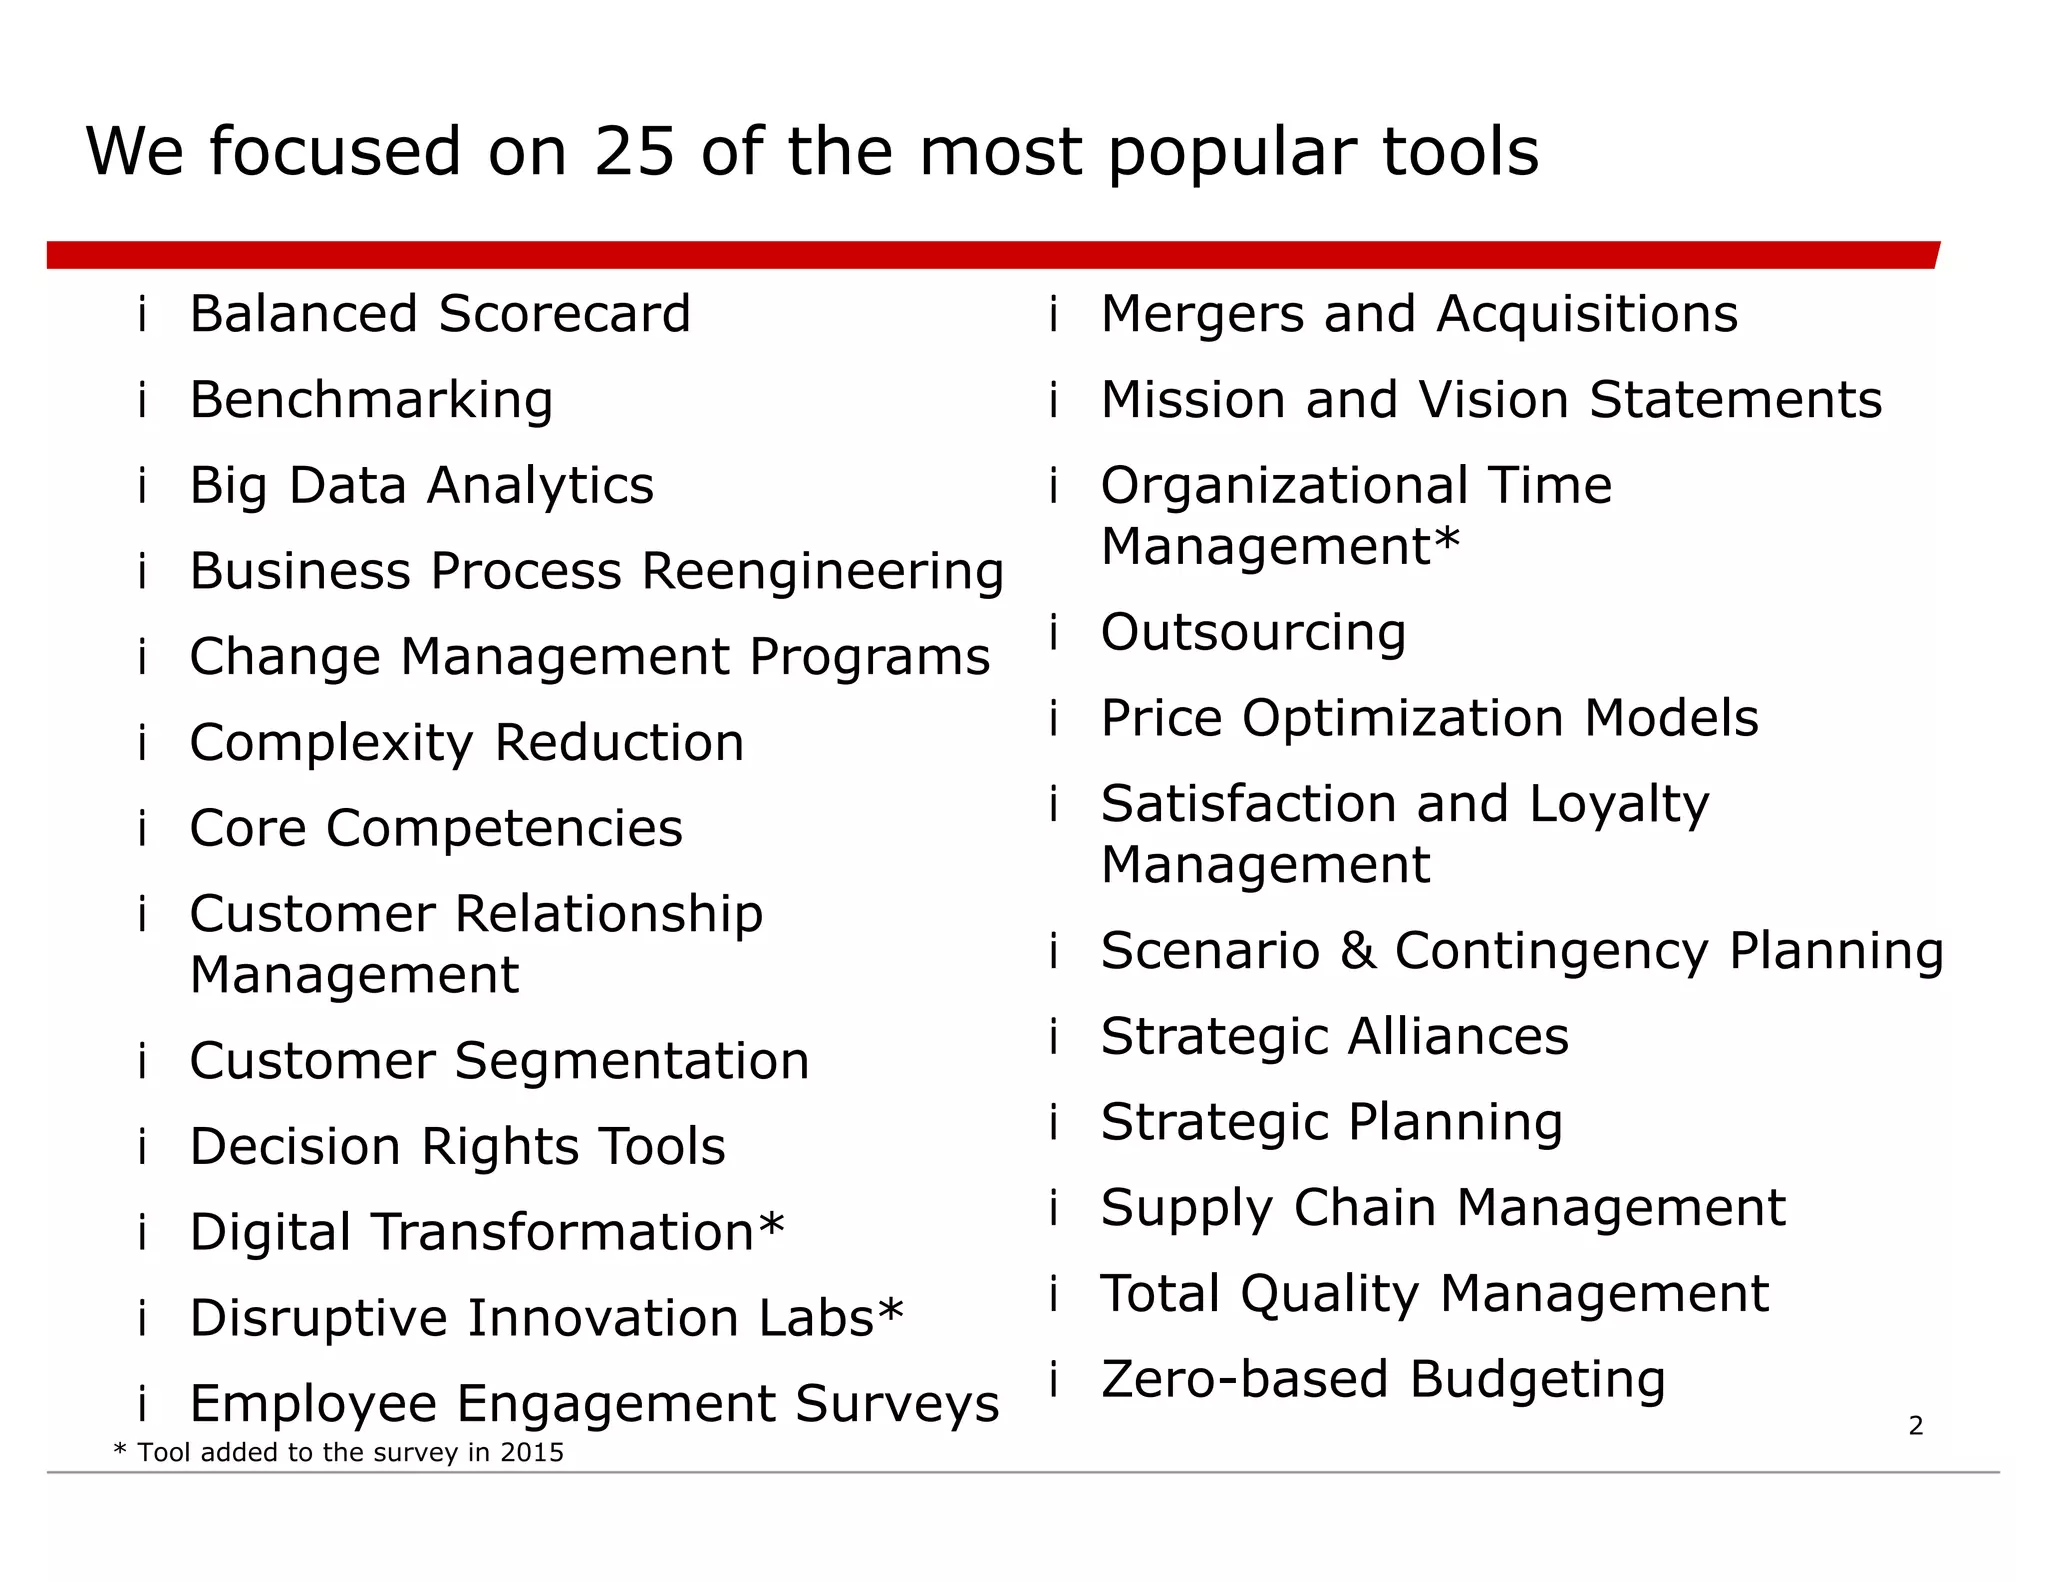
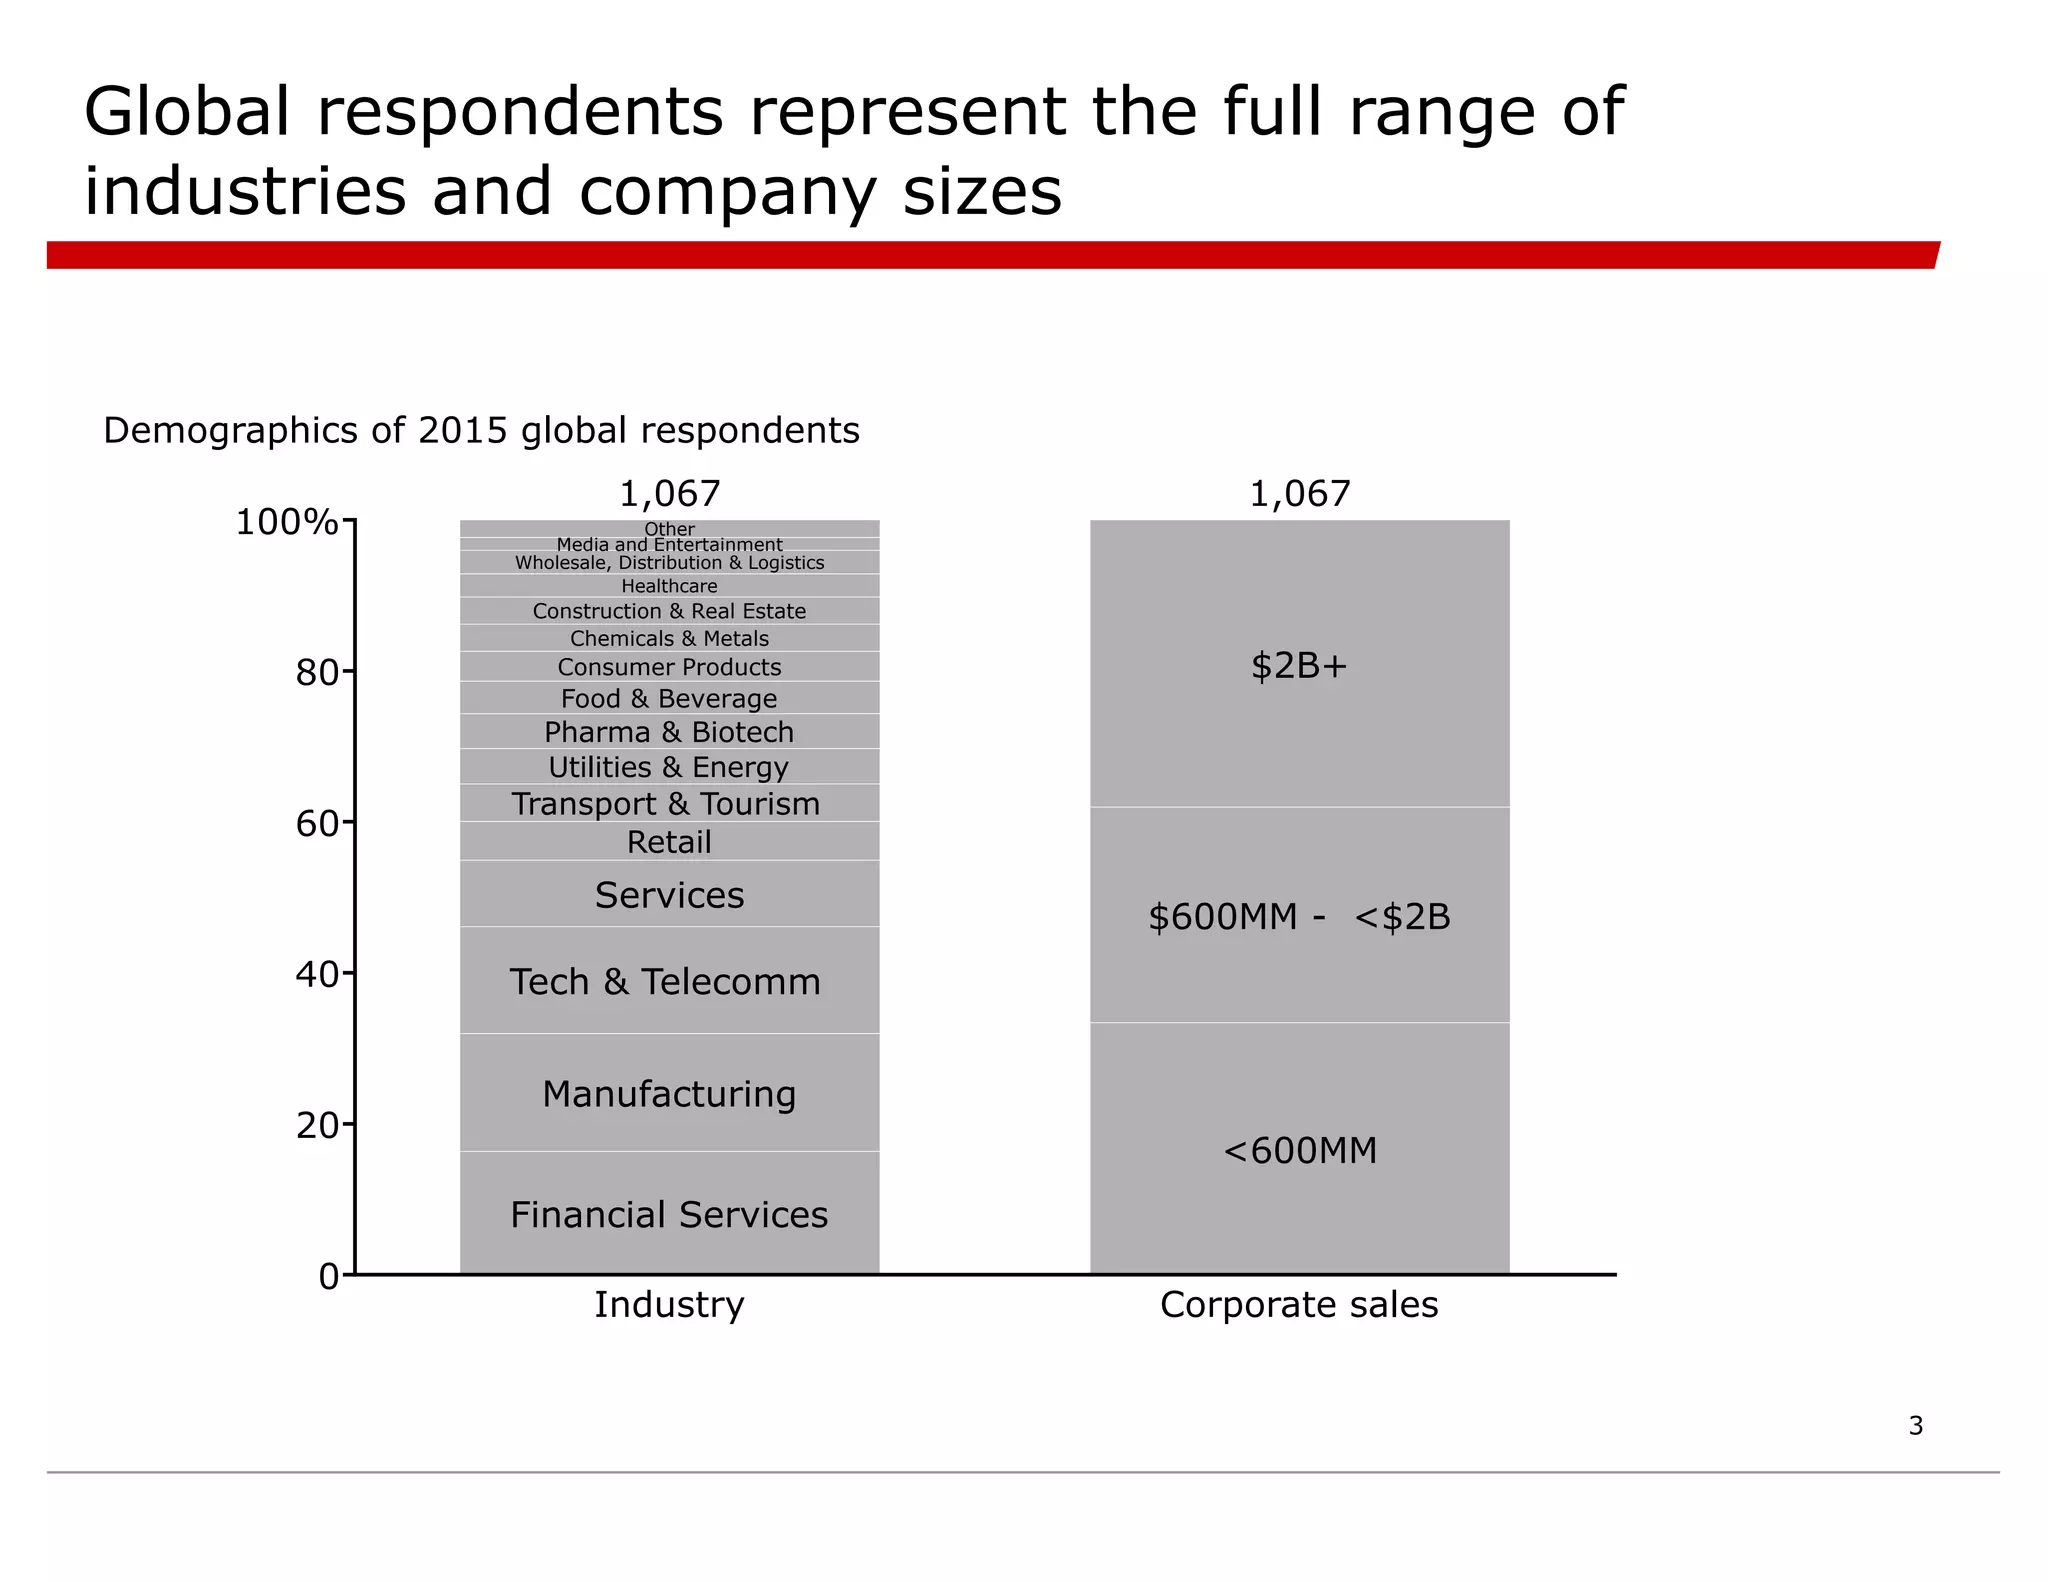
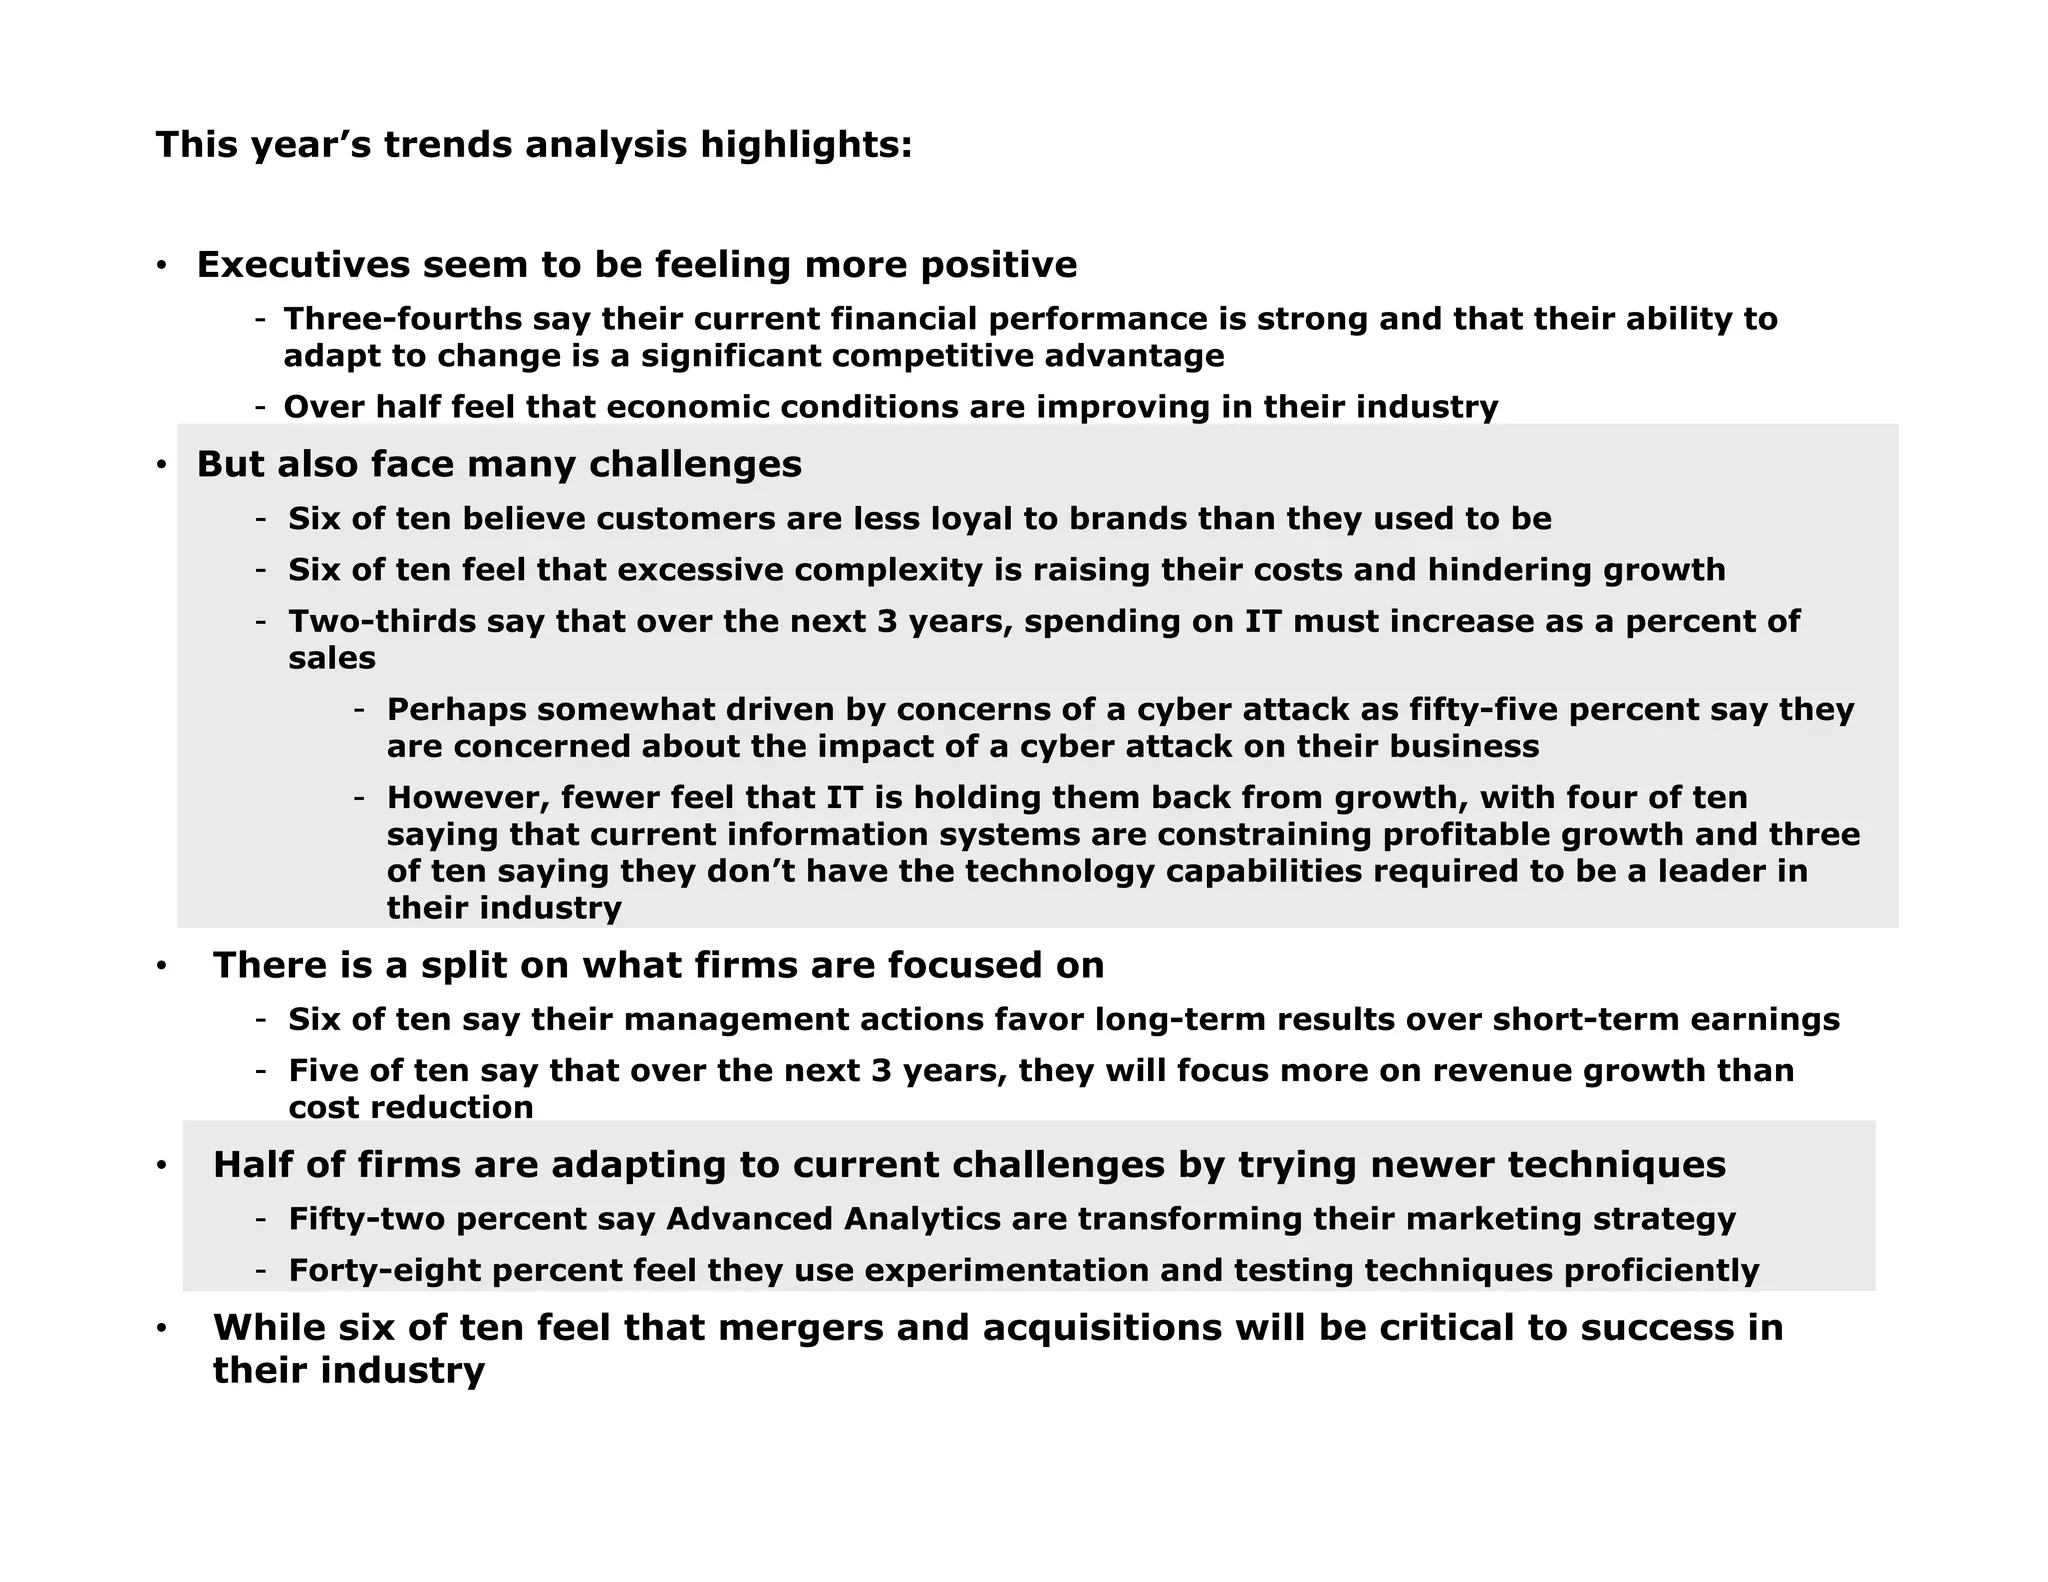
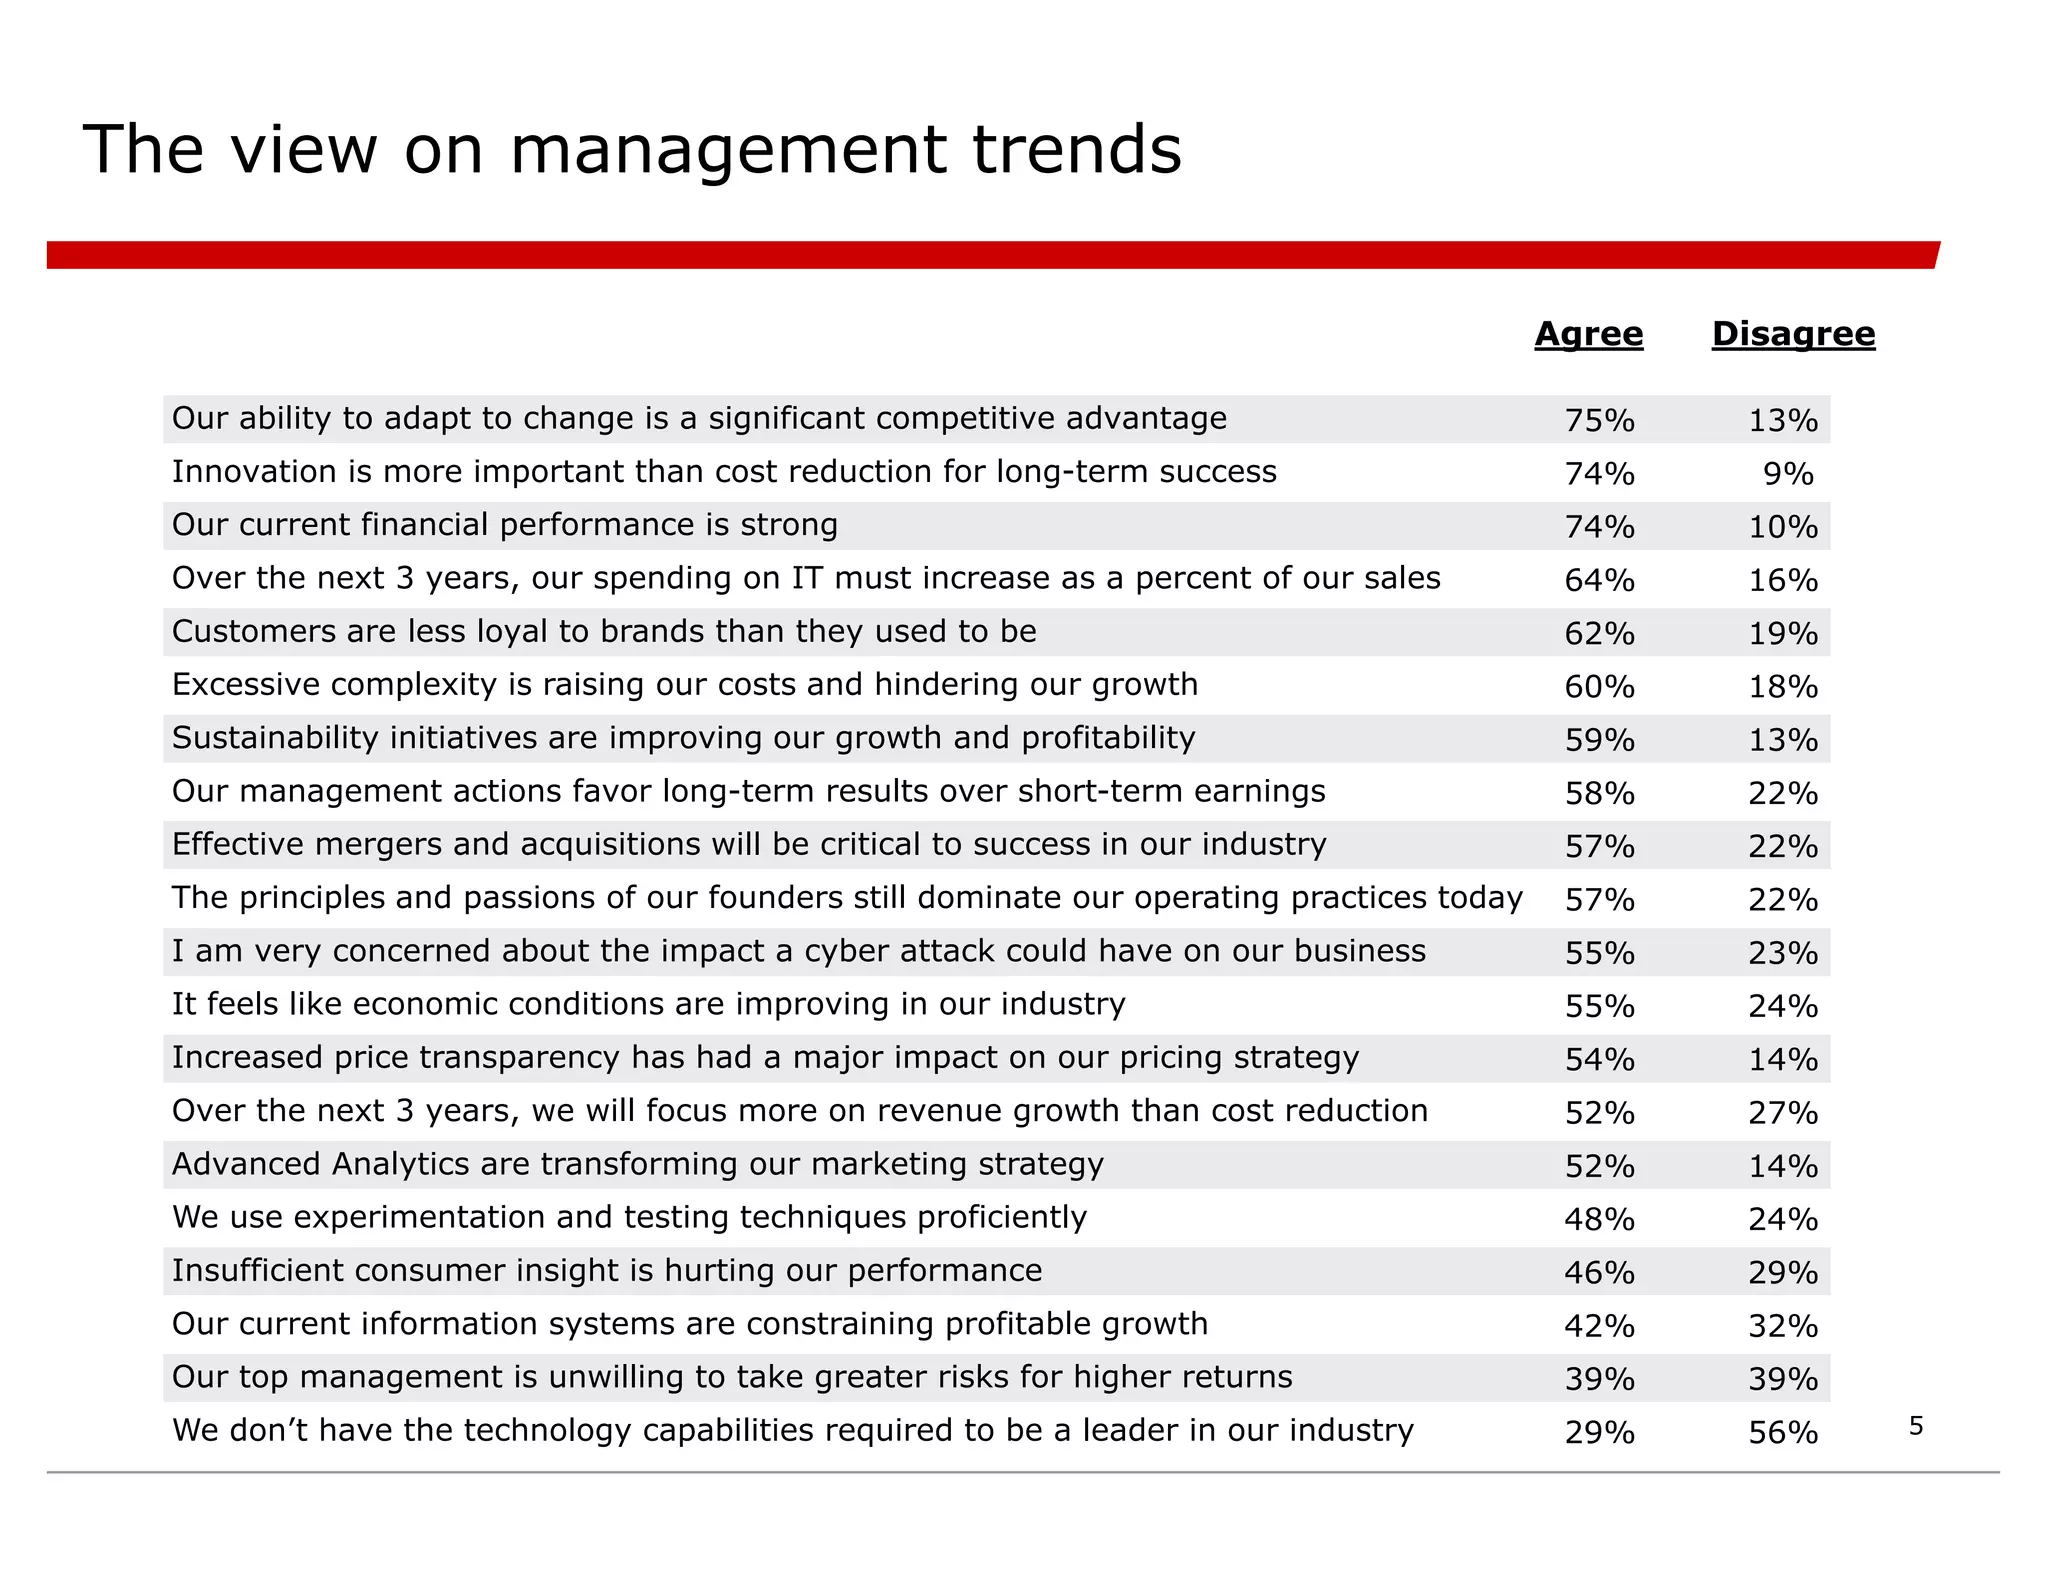
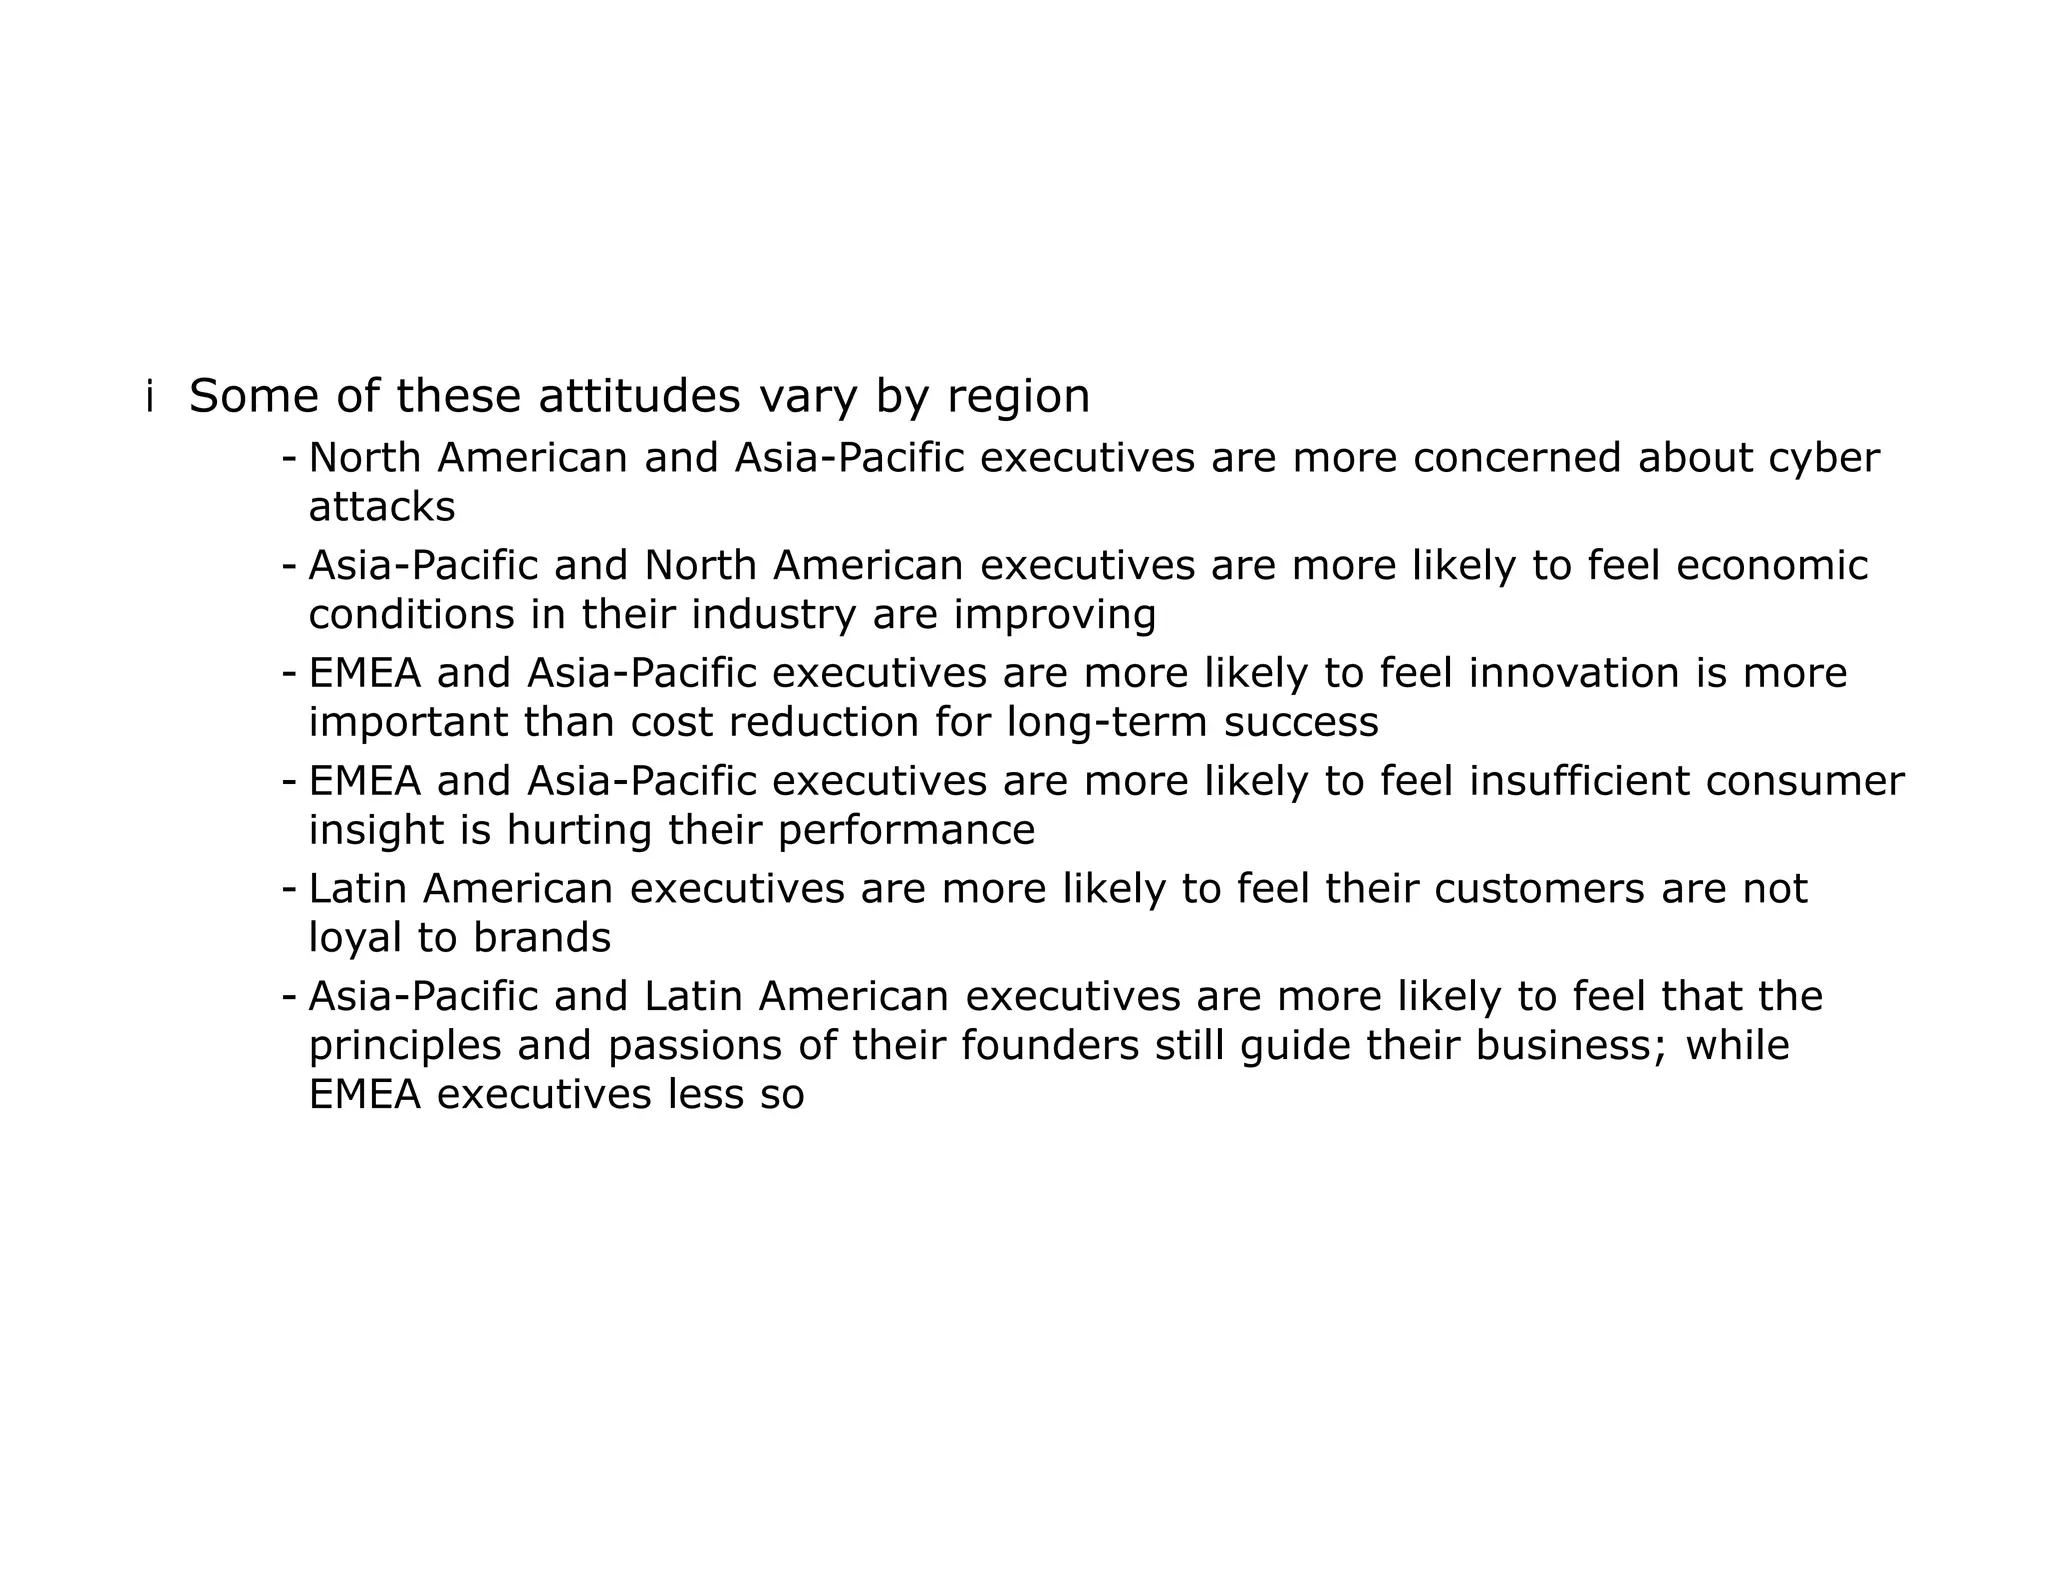
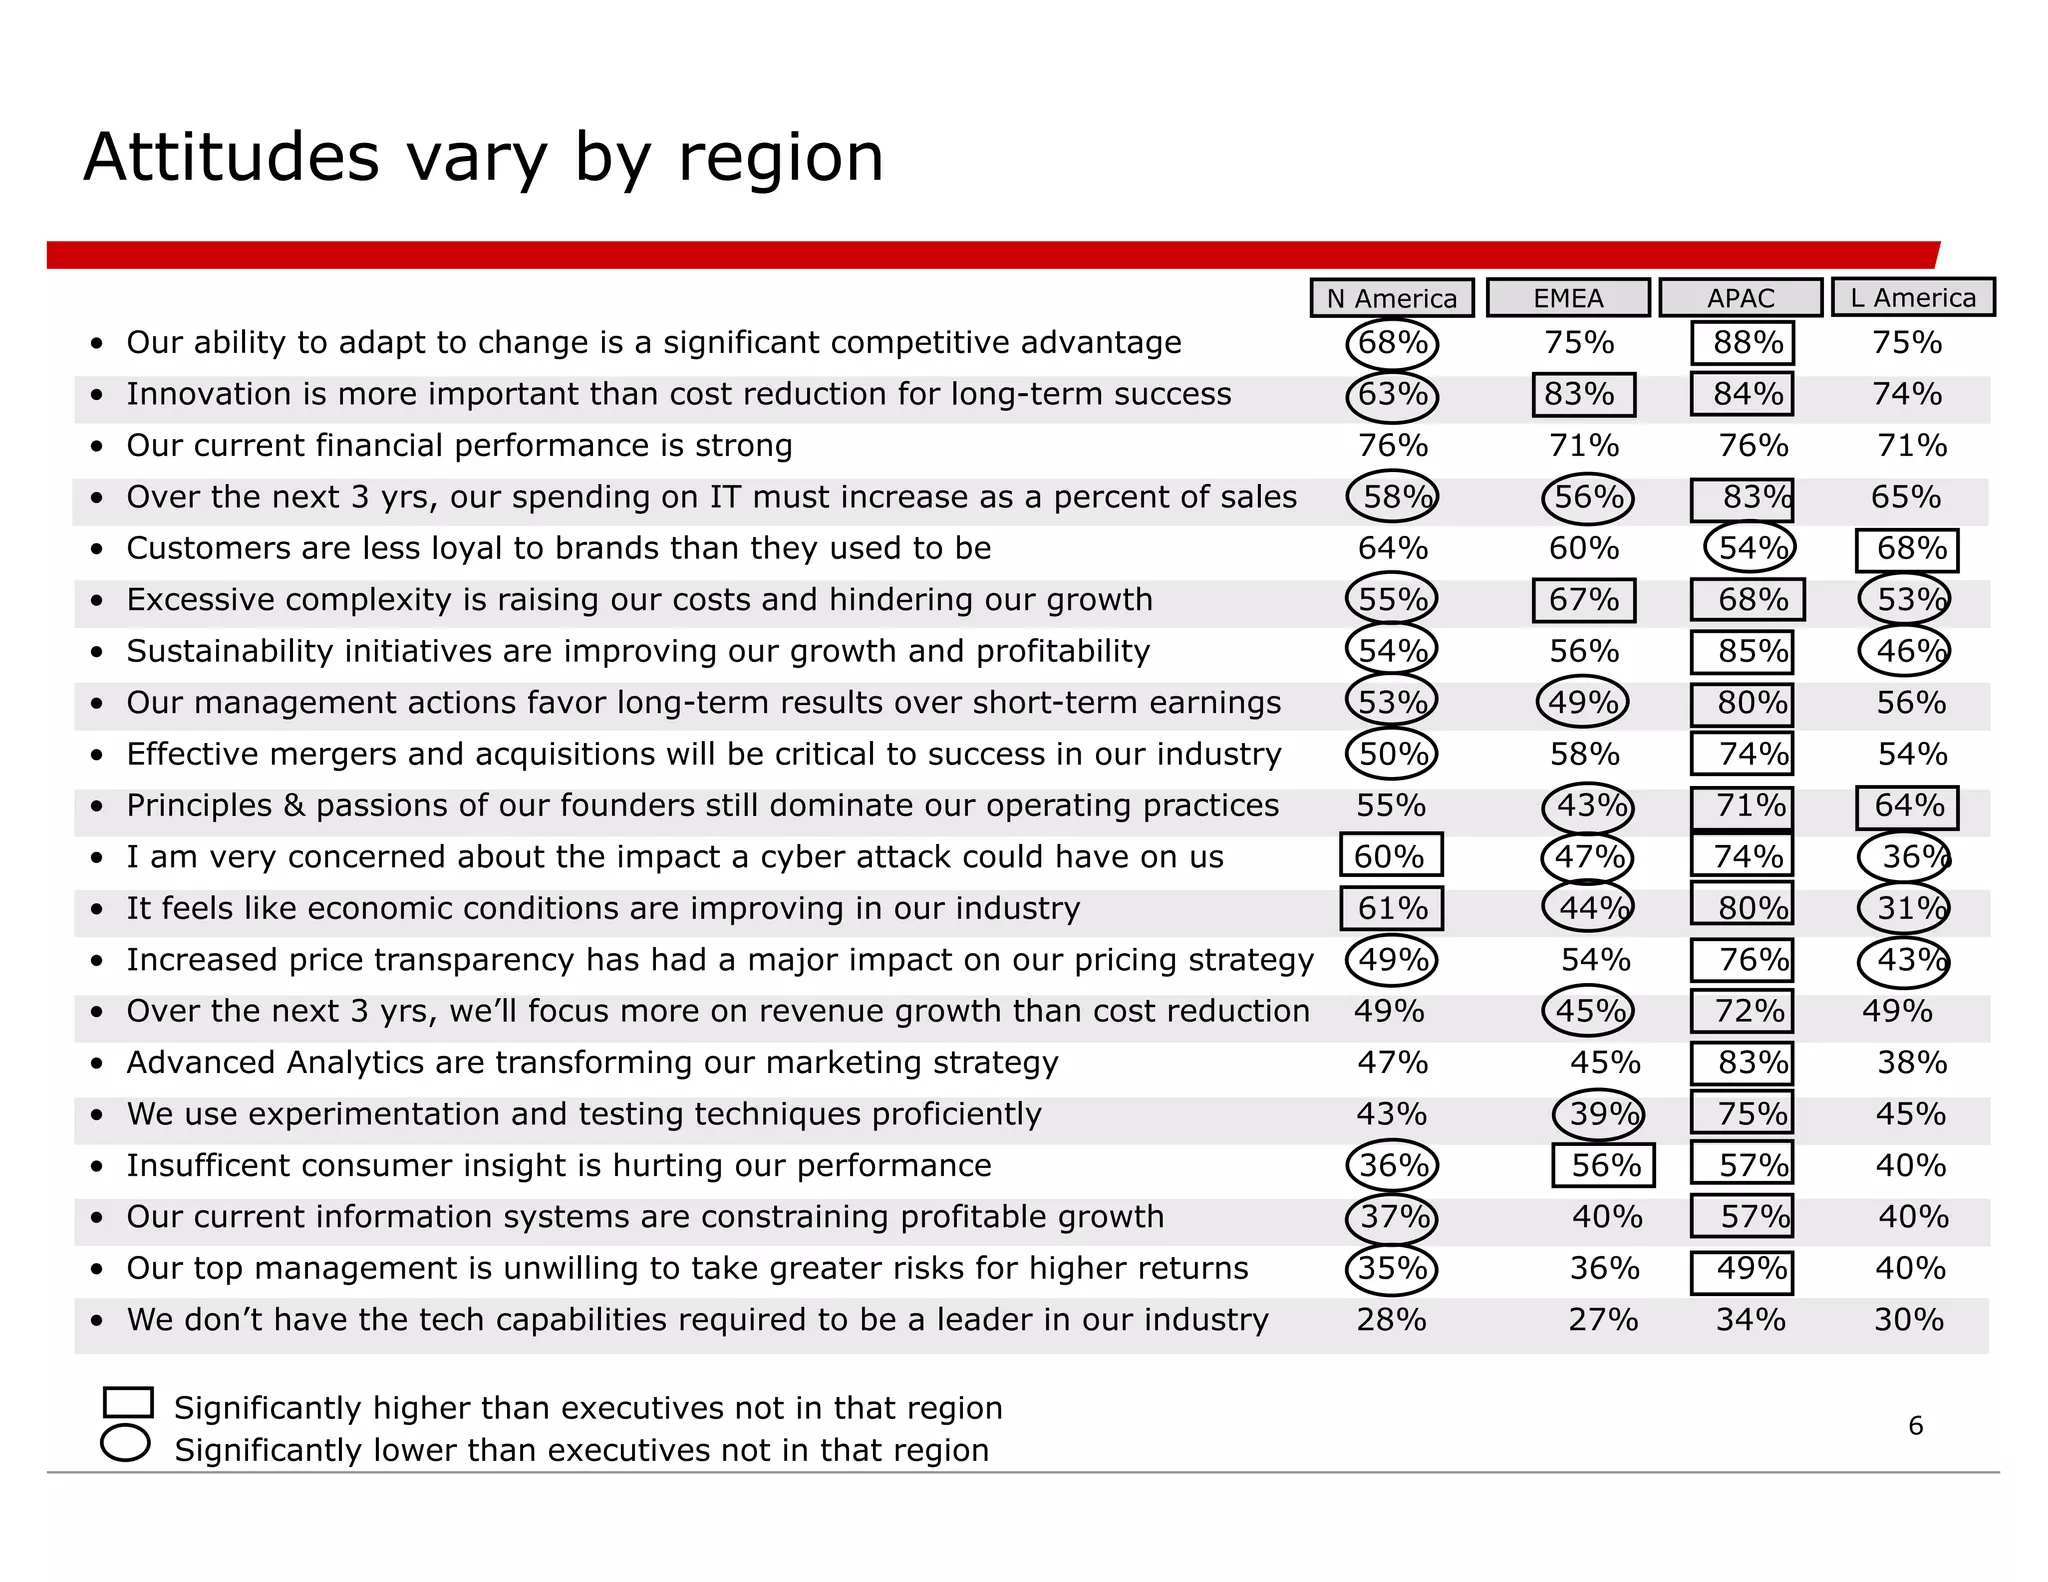
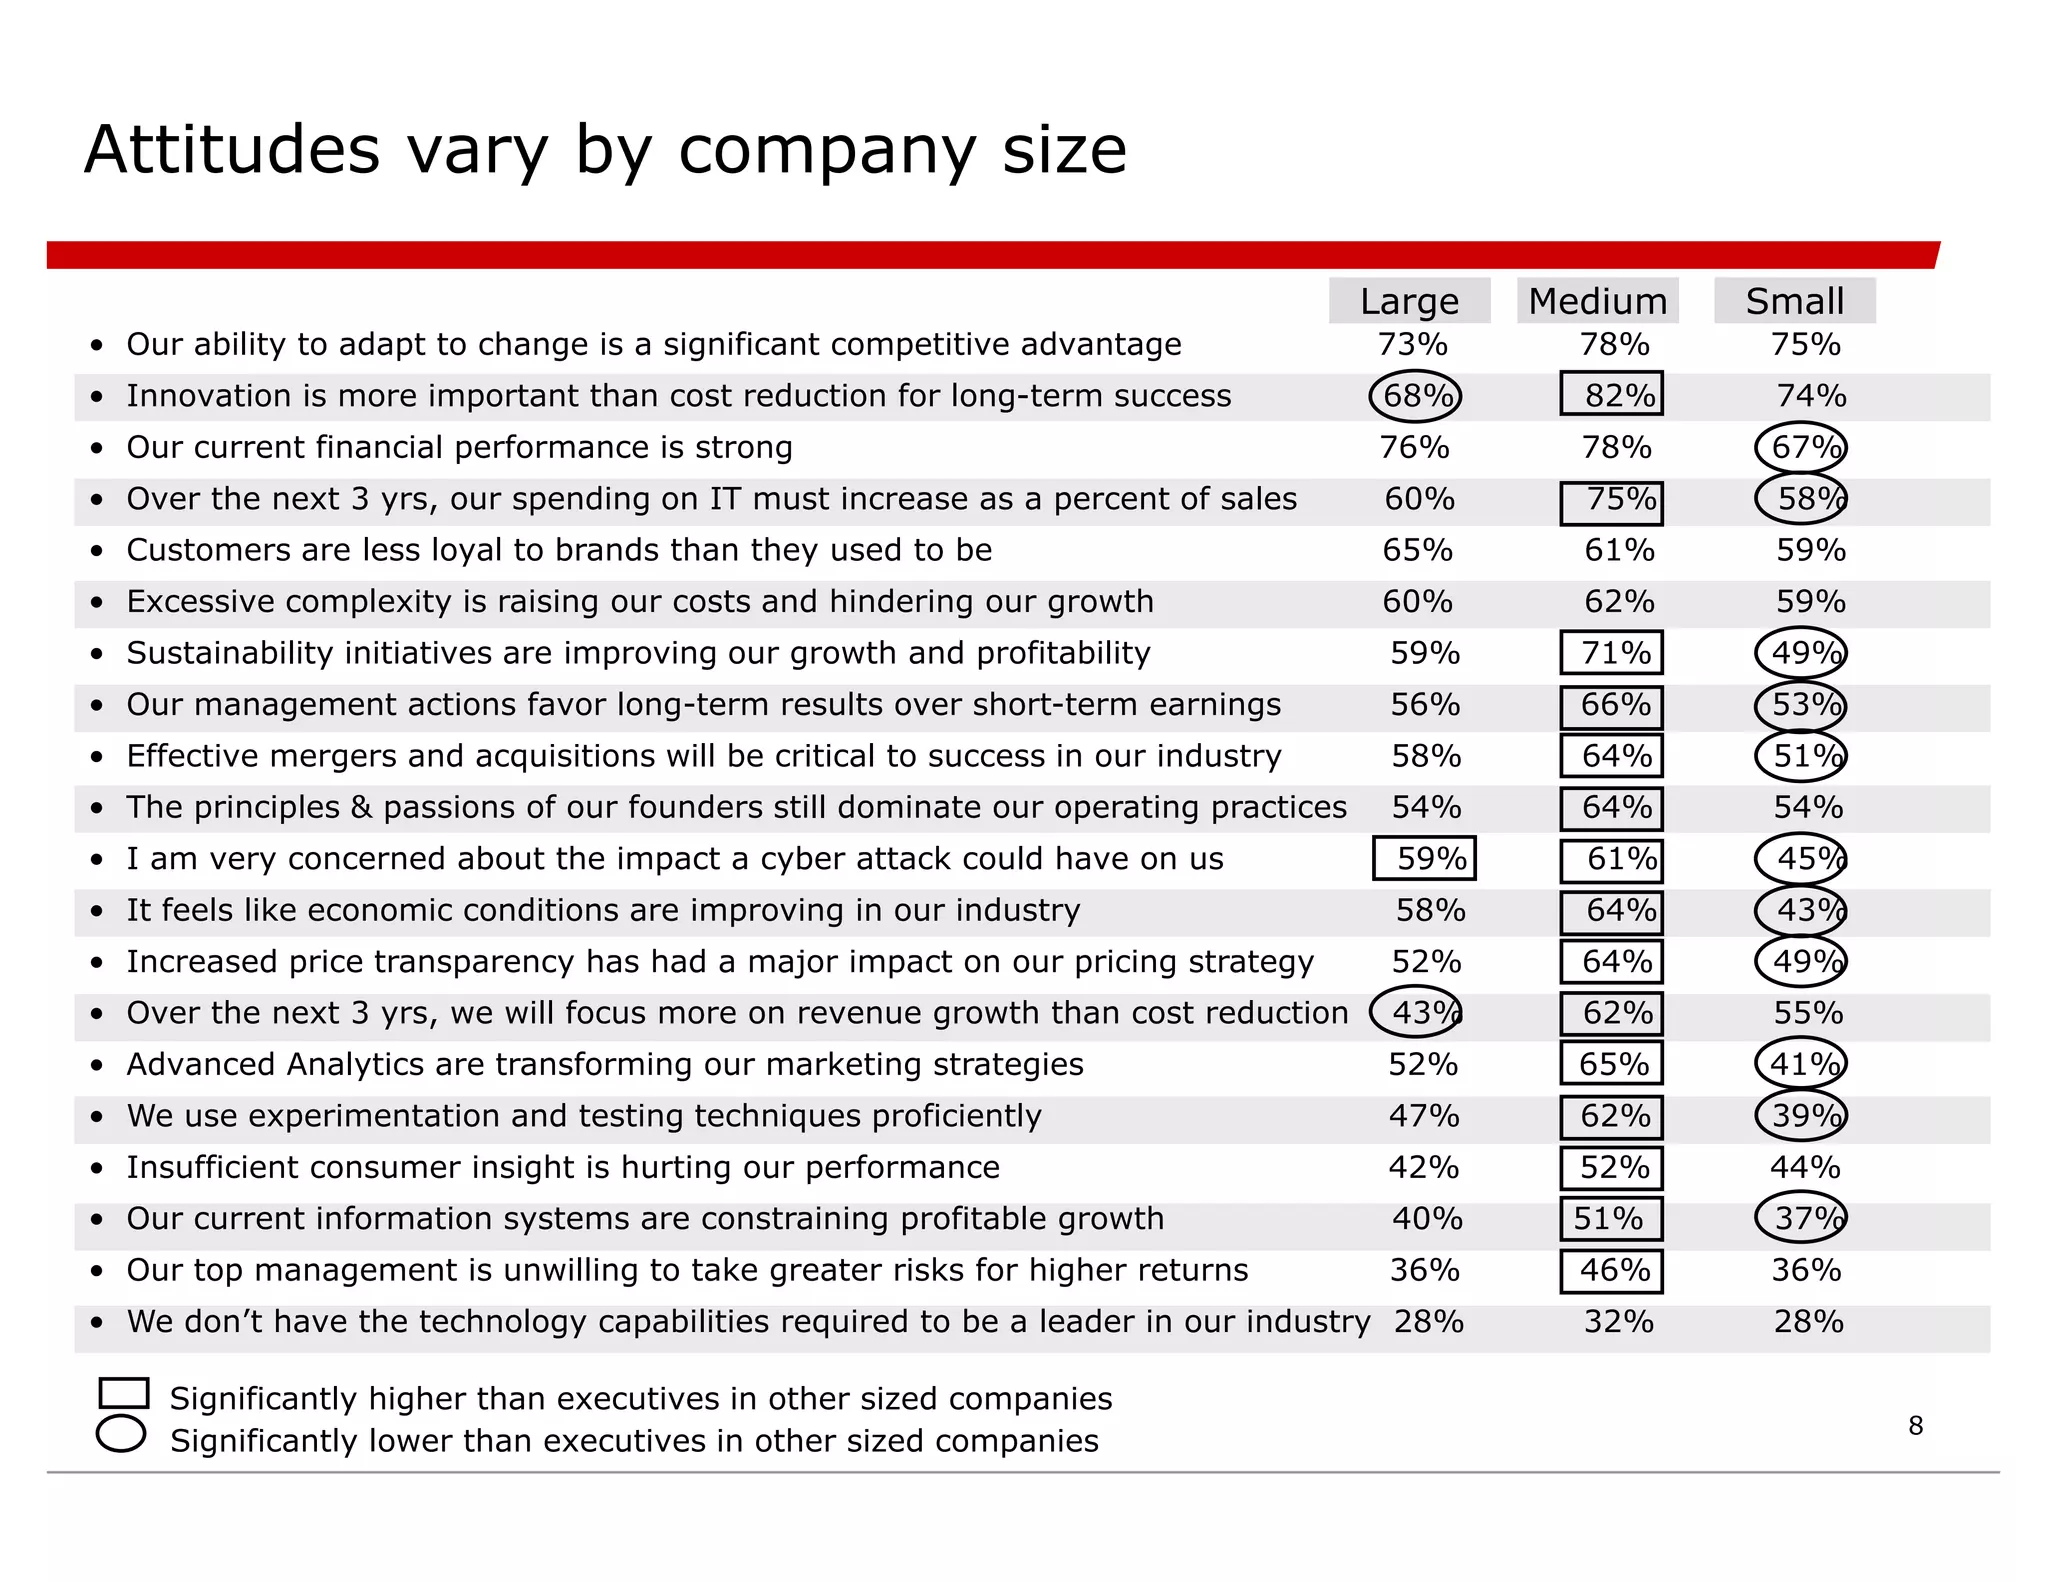
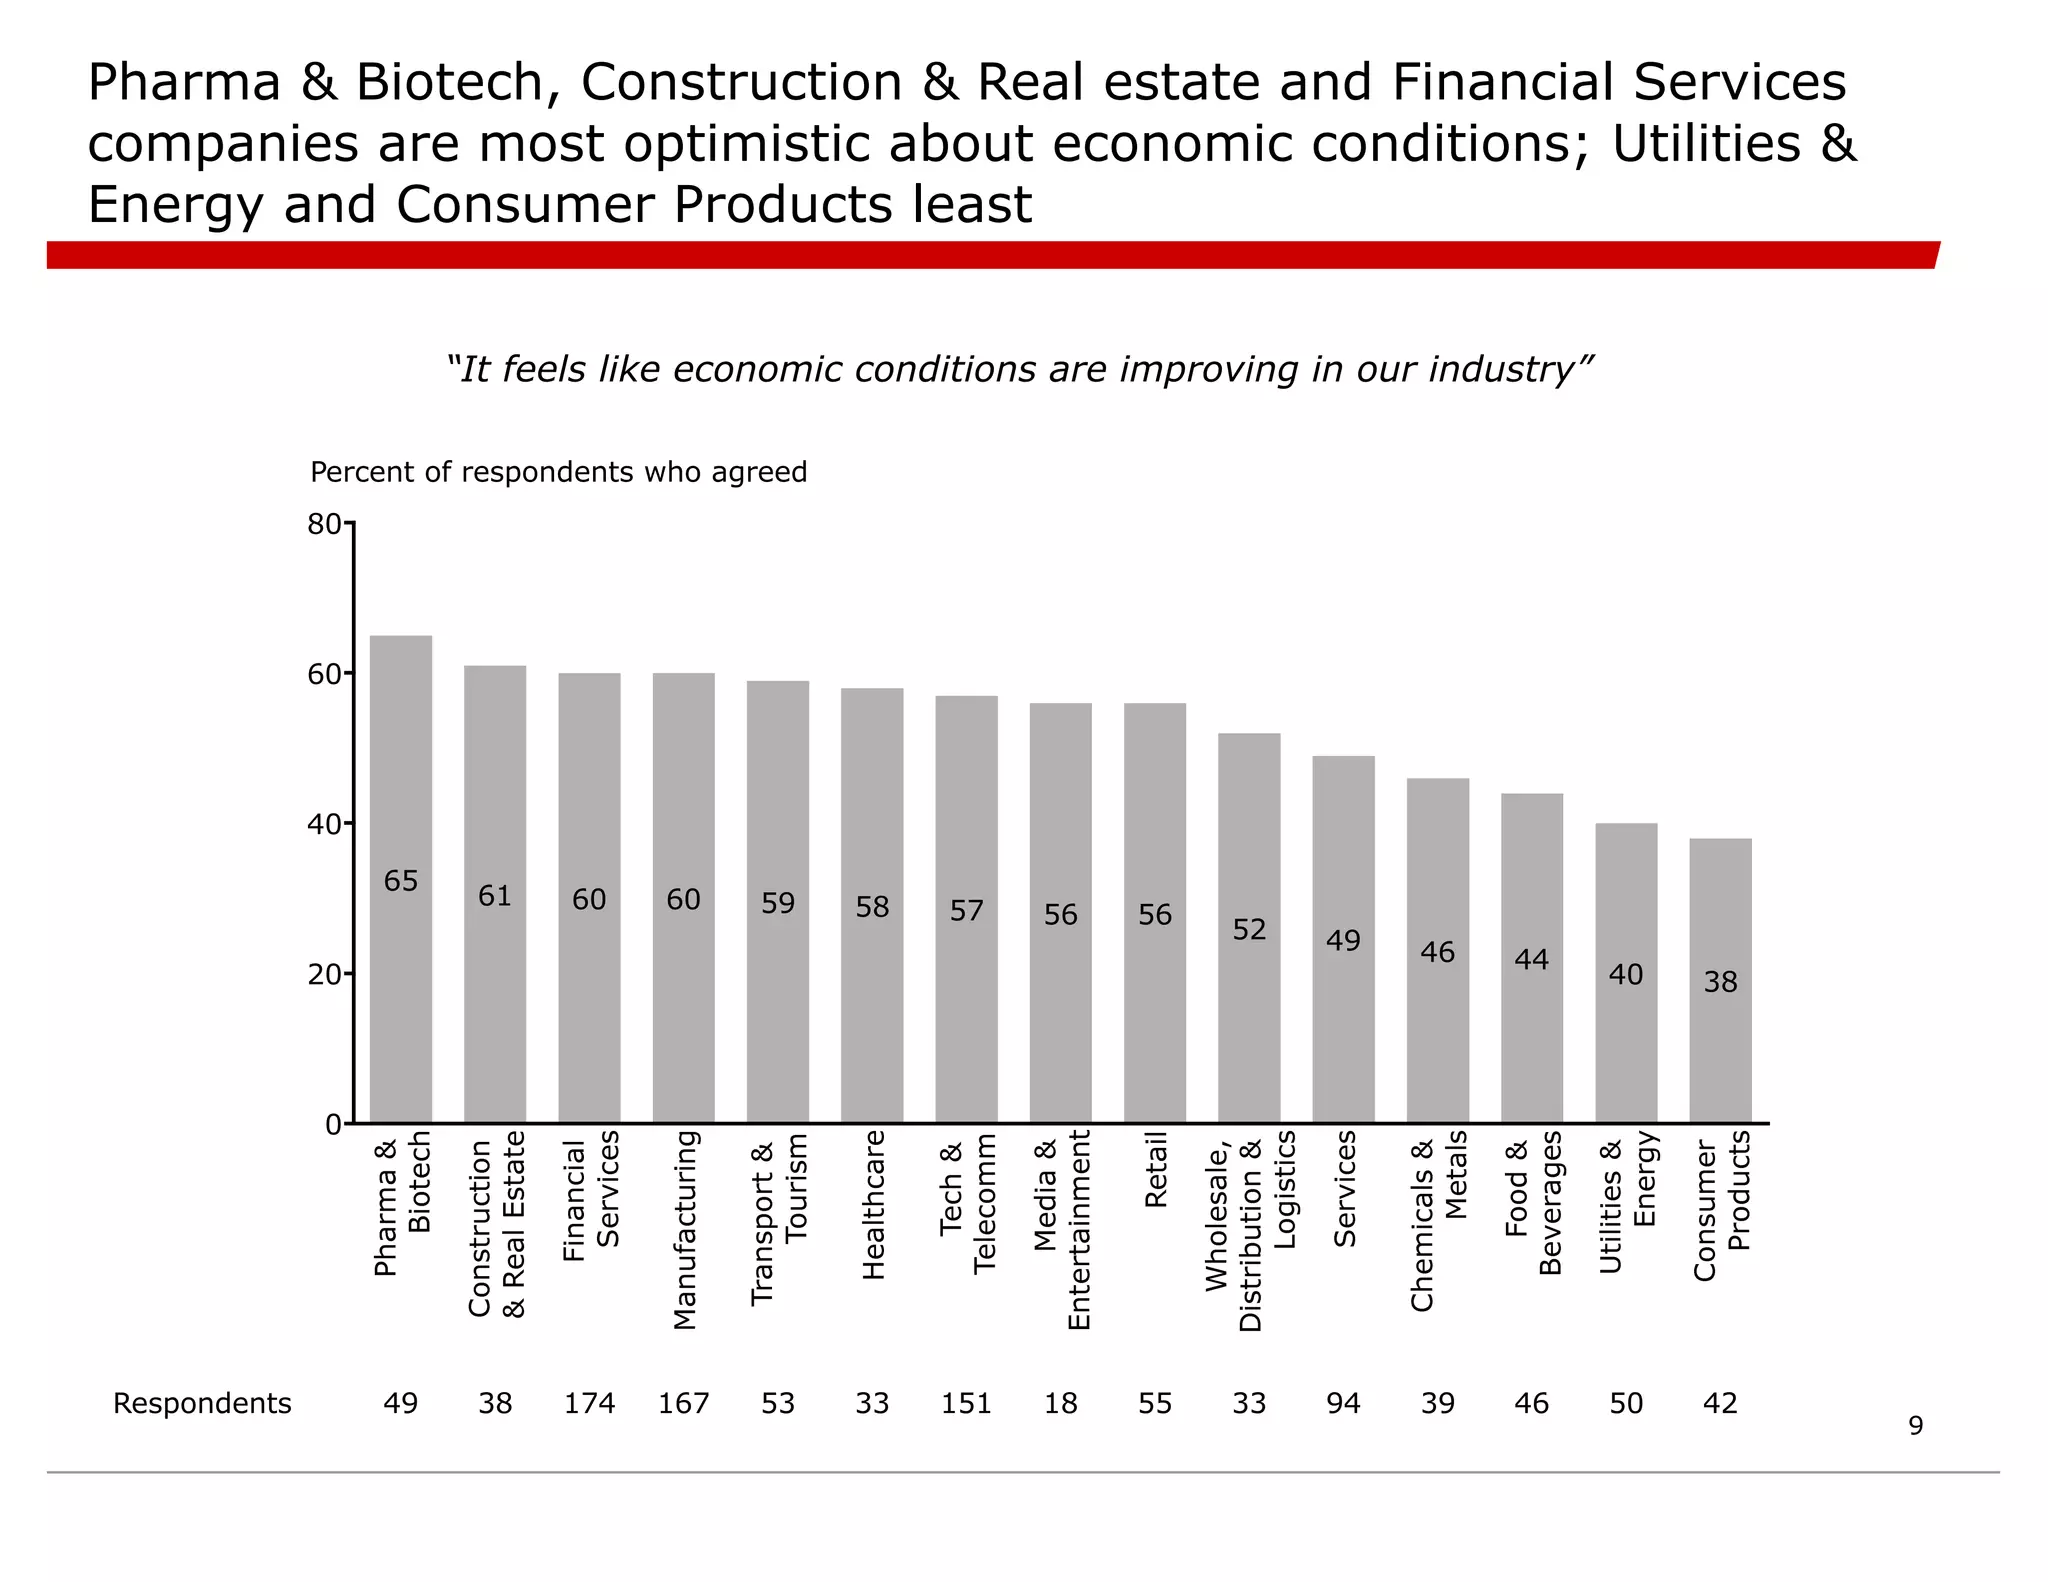
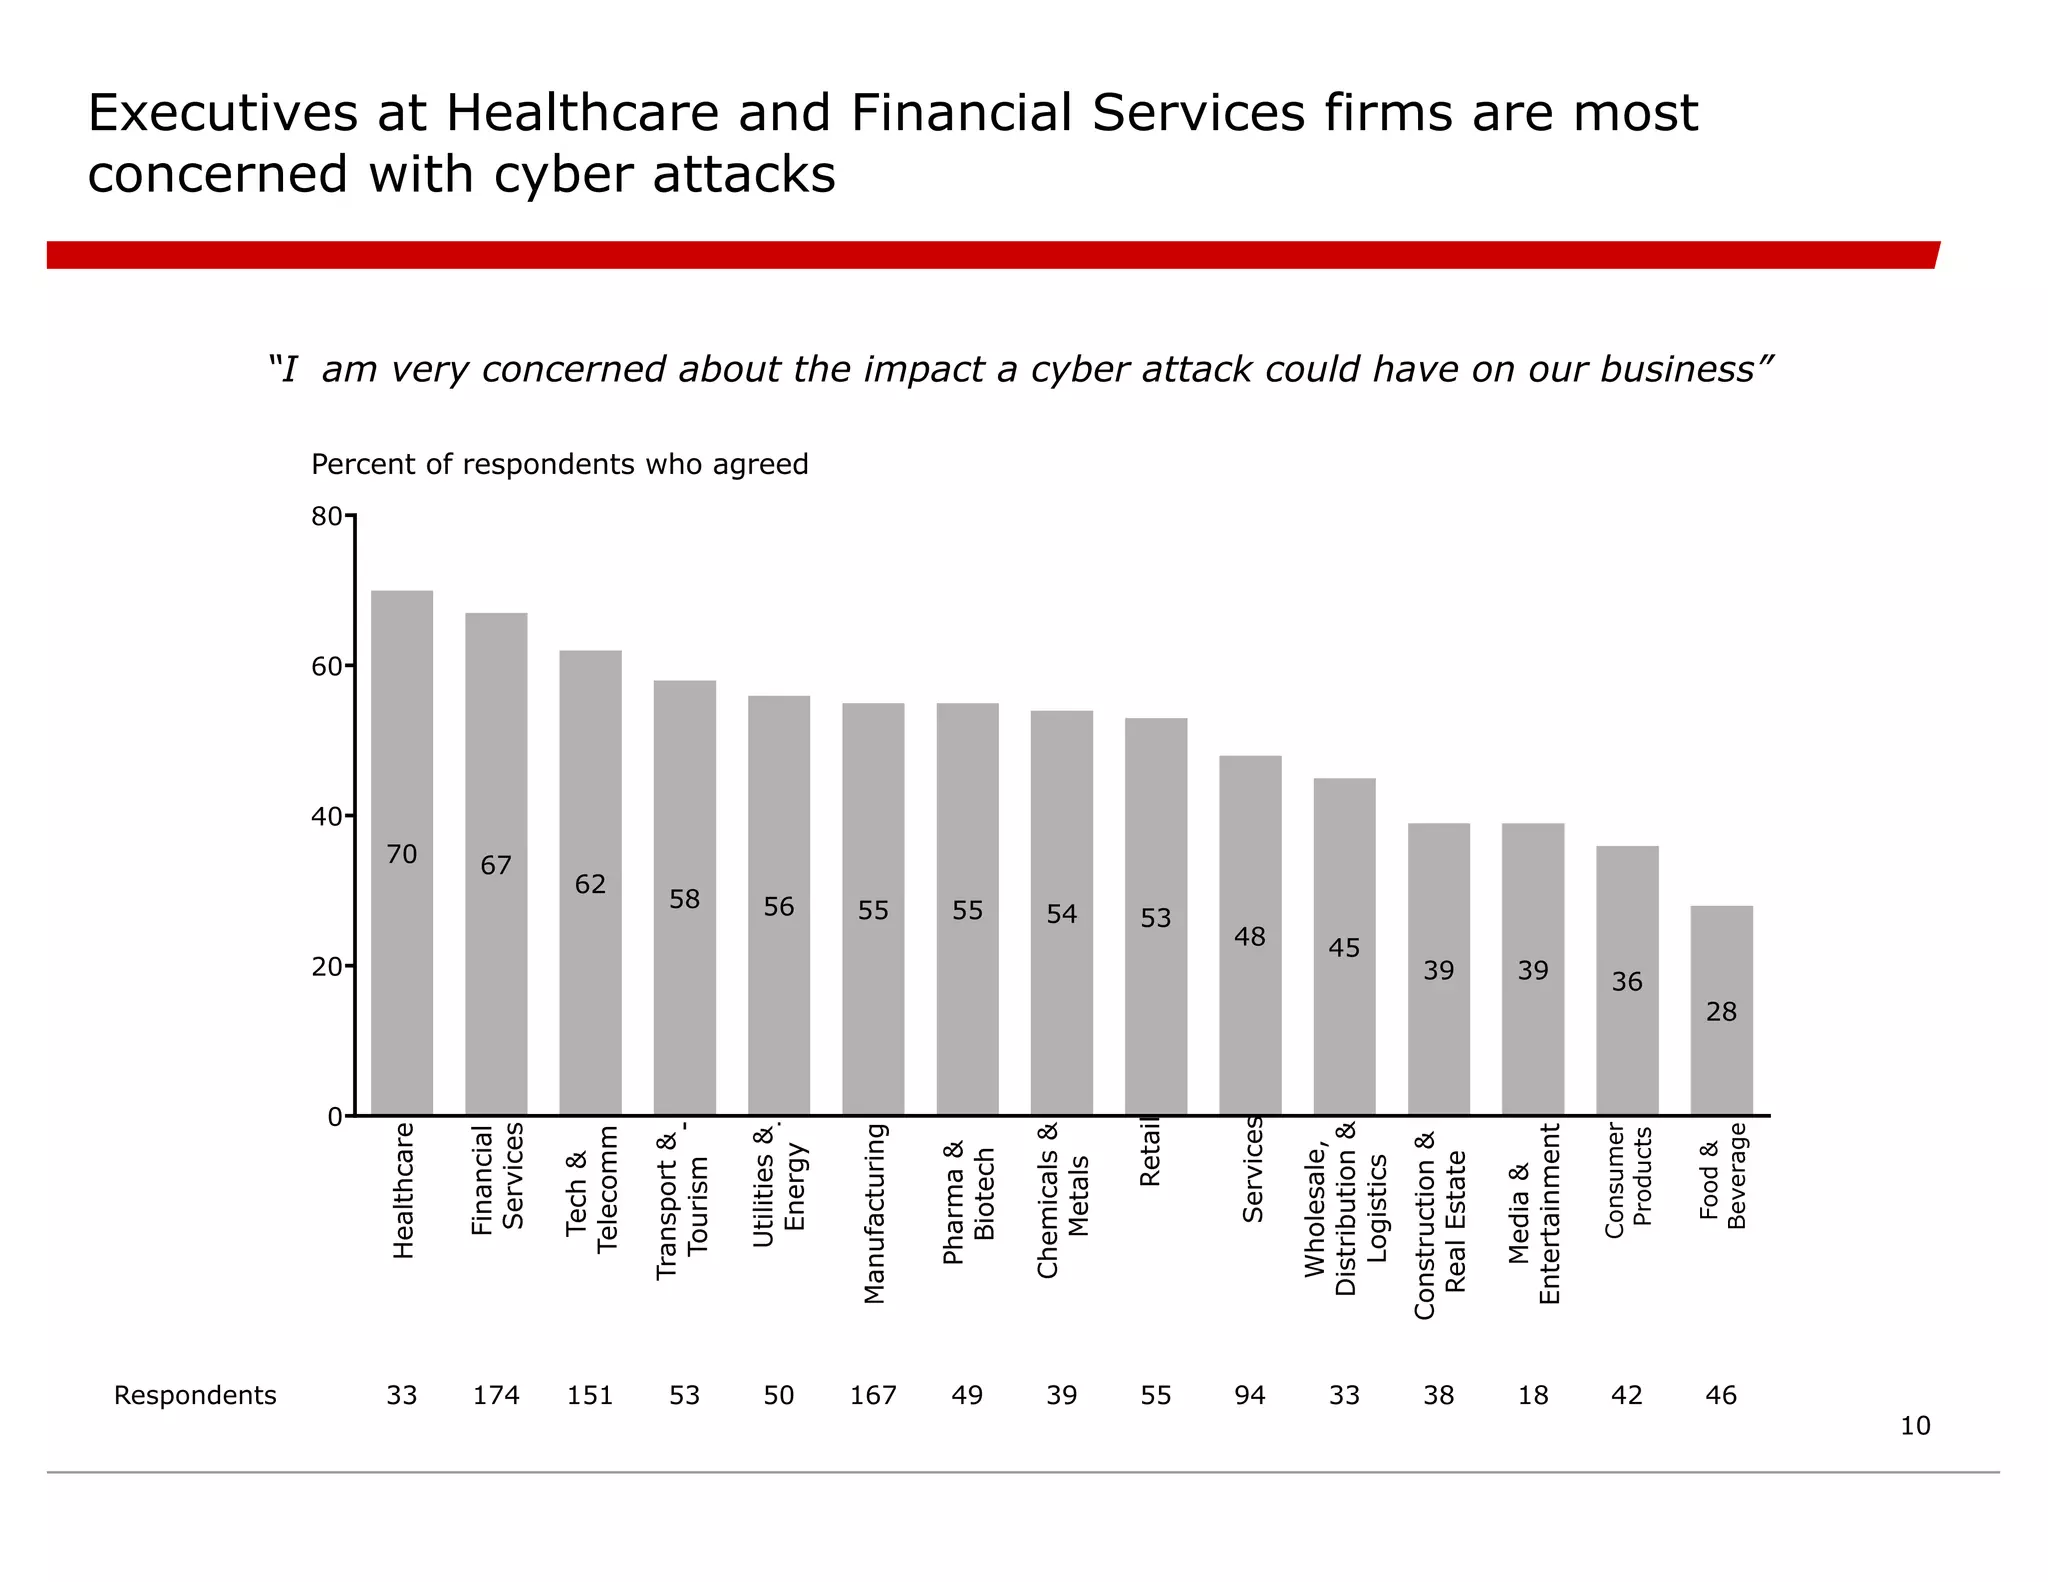
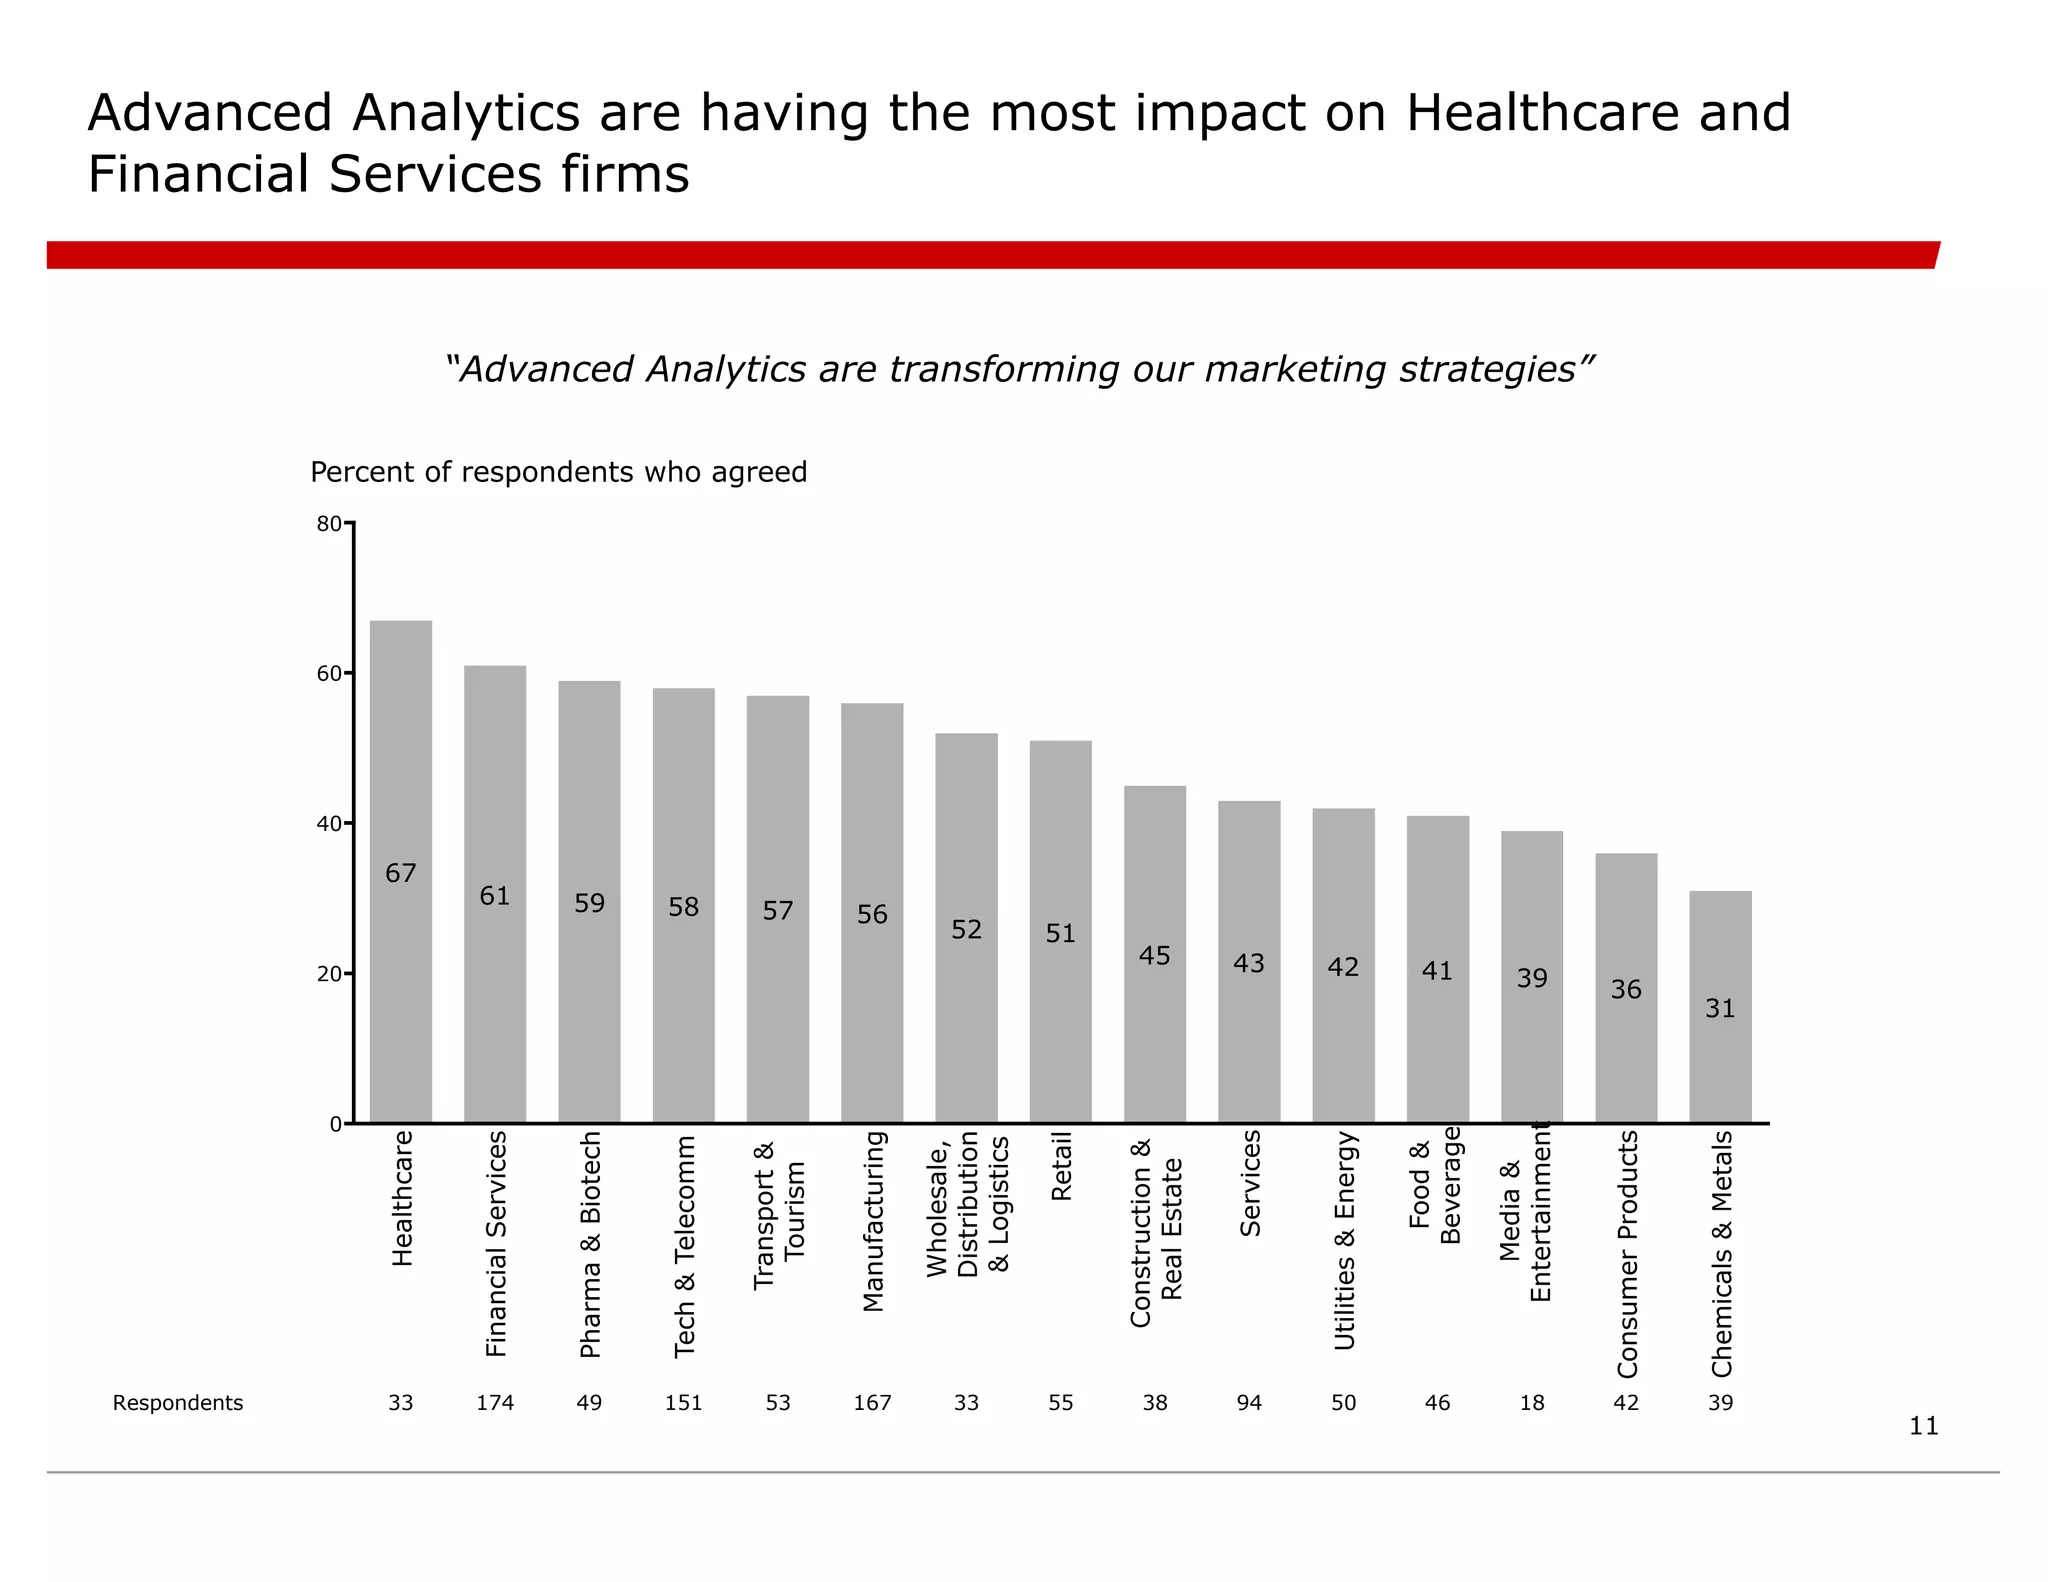
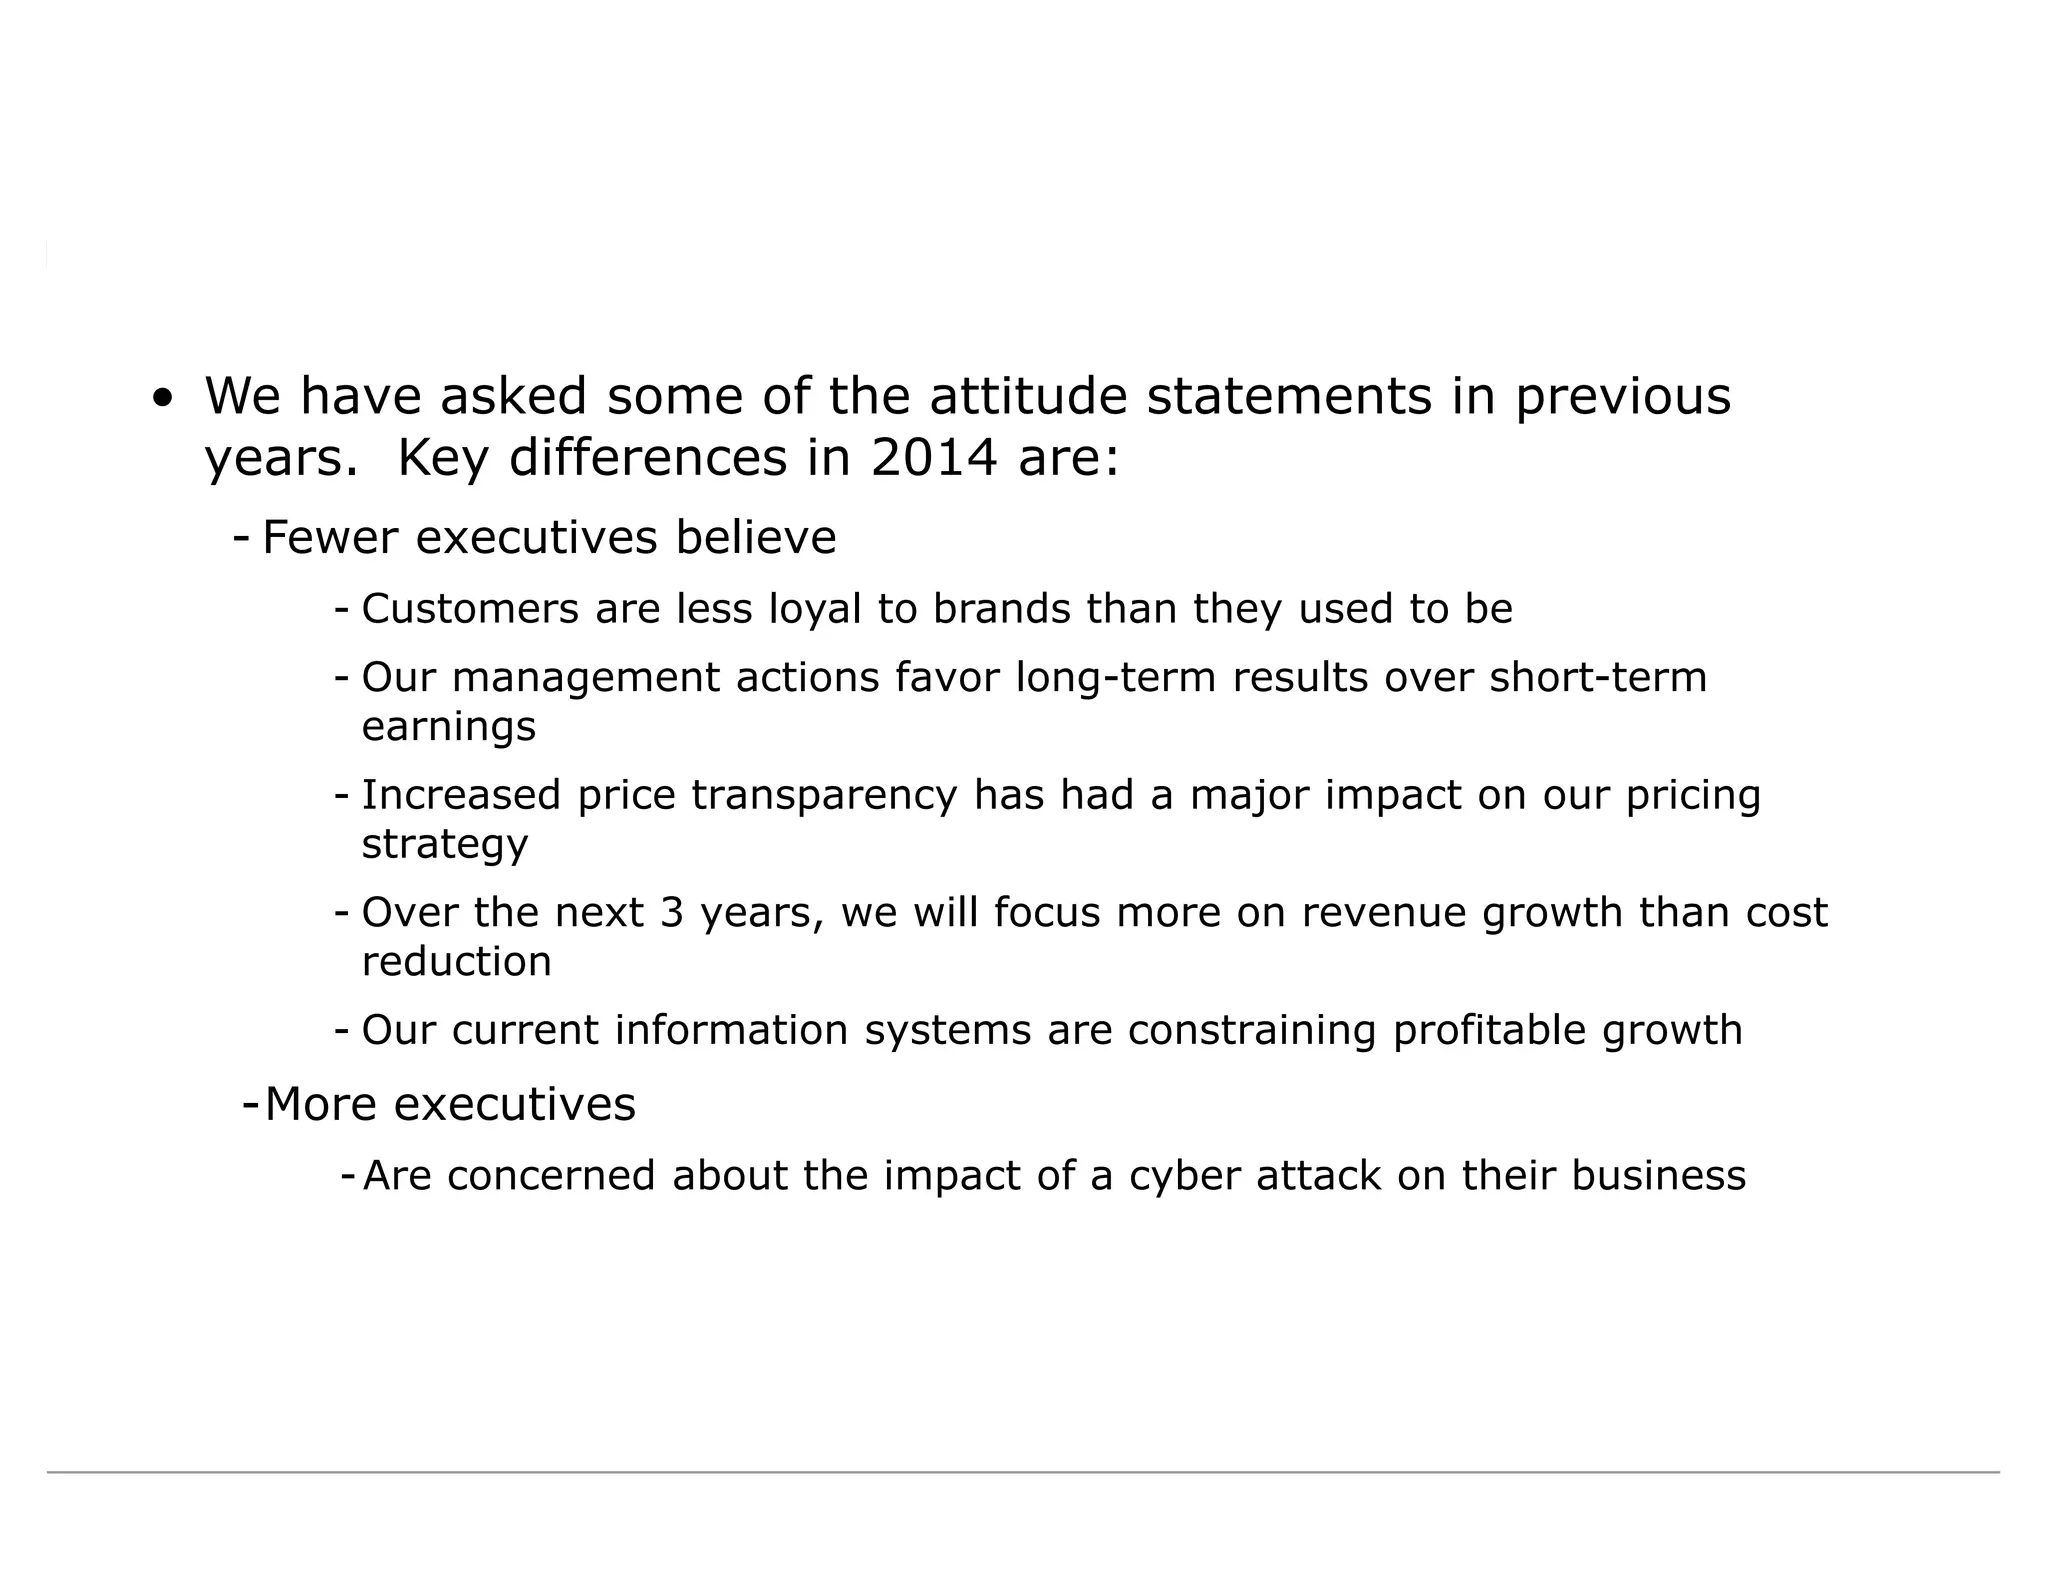
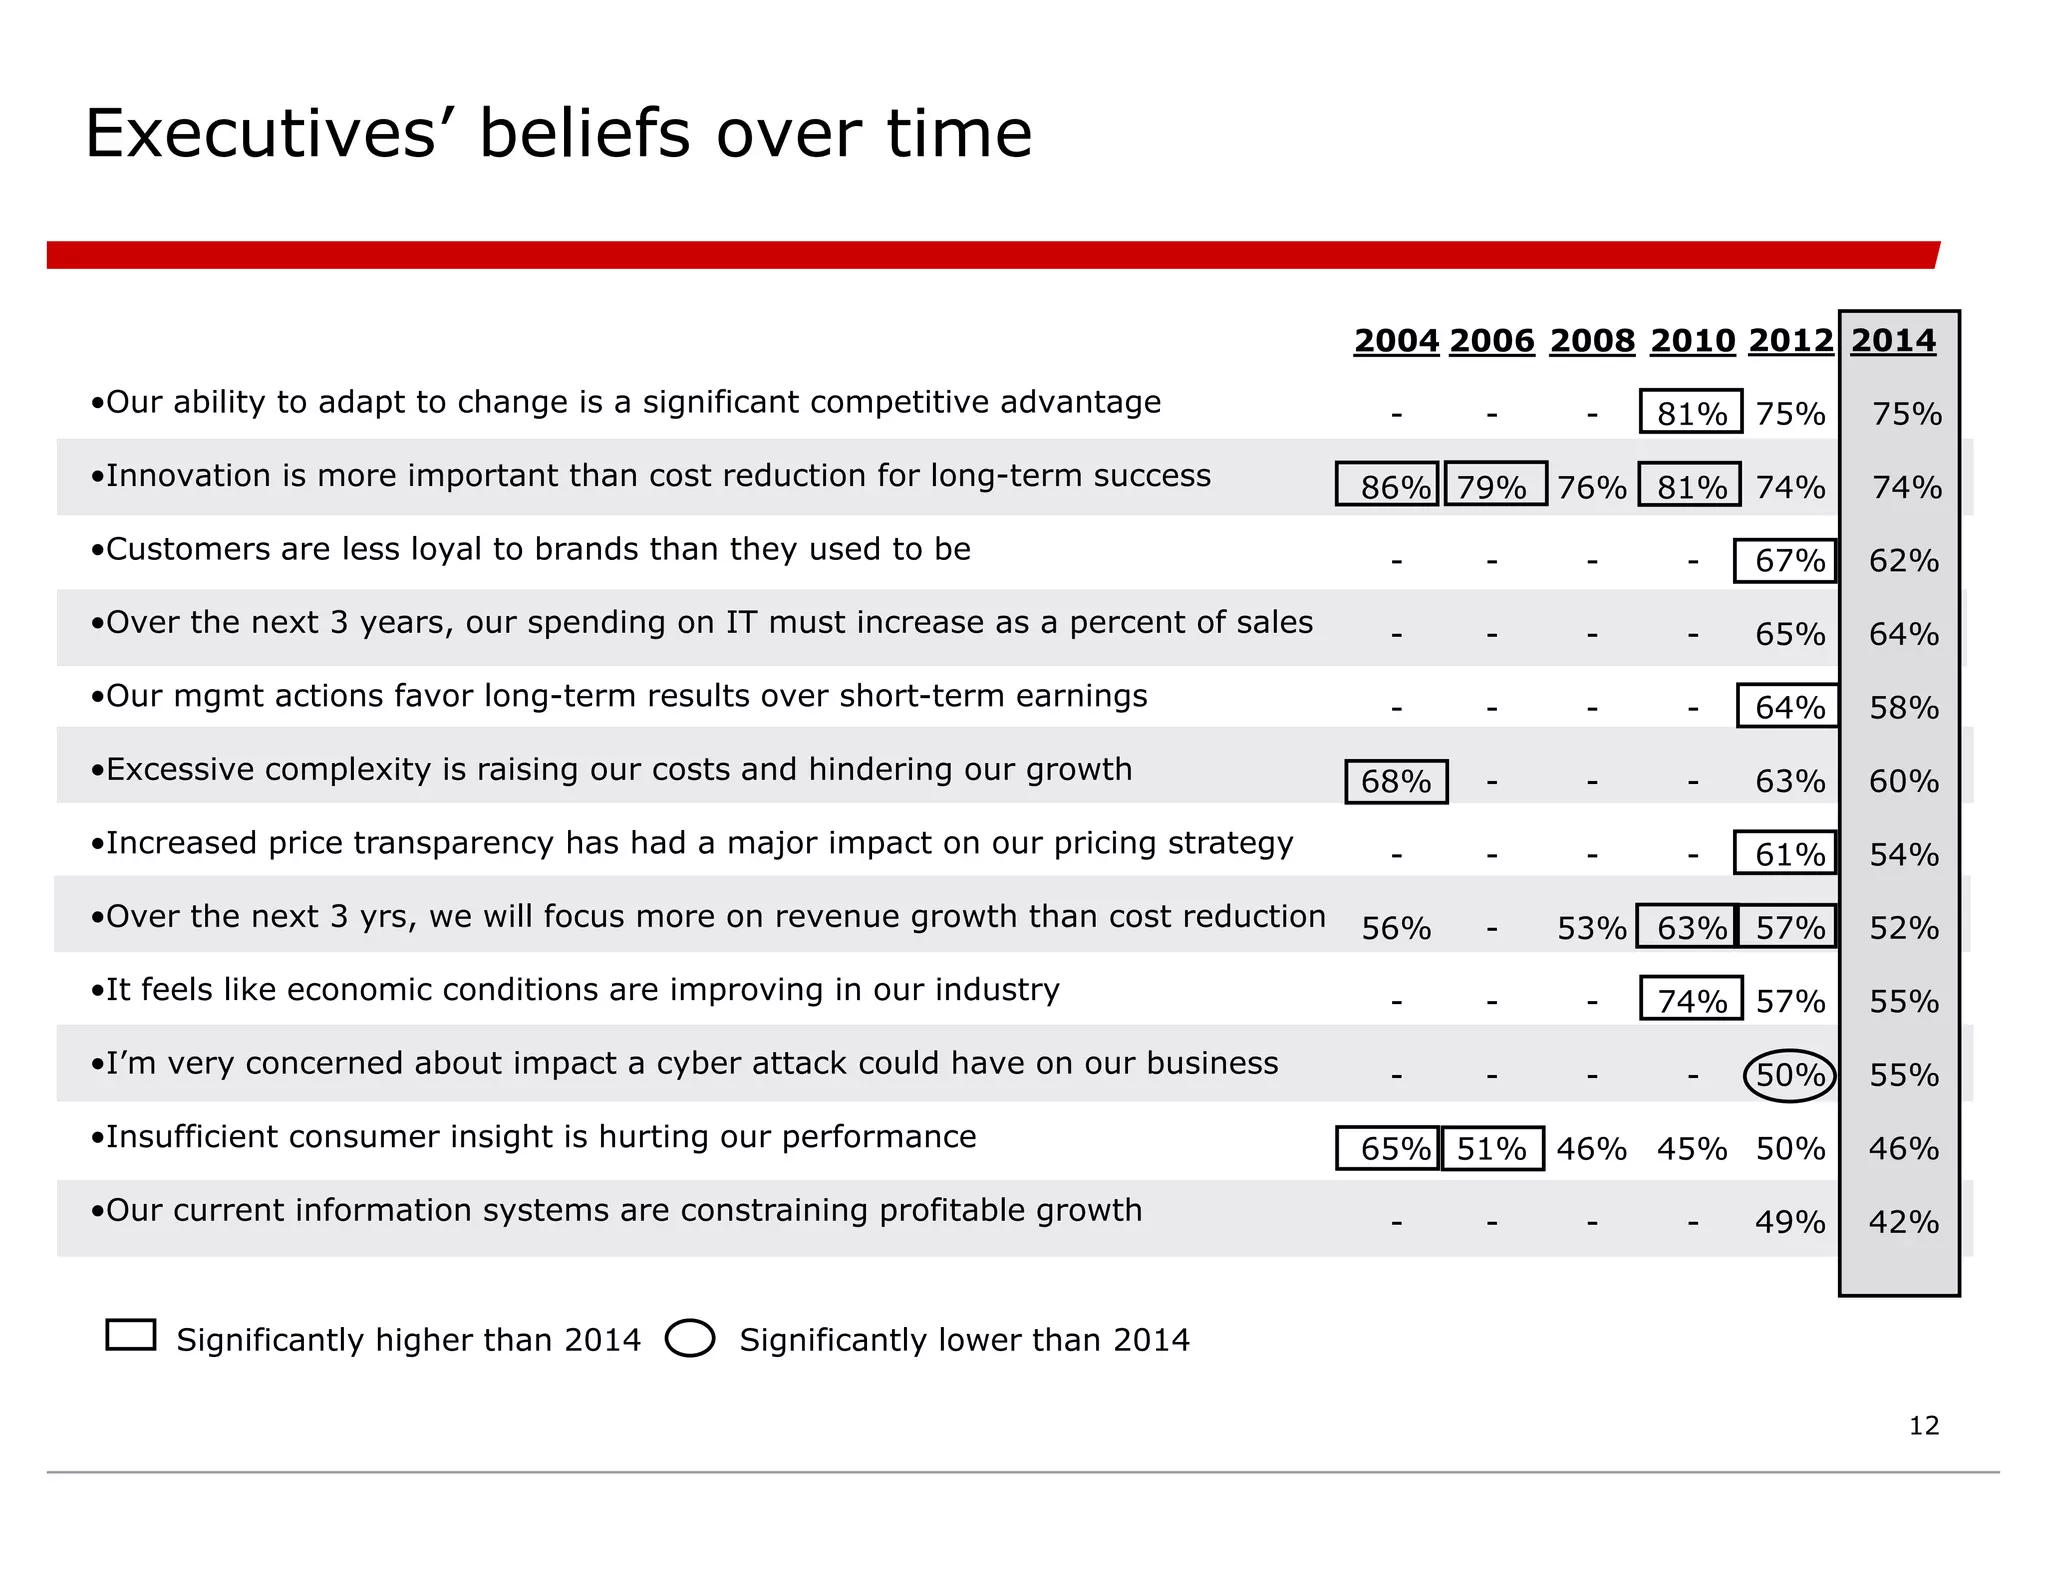
This document summarizes the findings of a survey of over 1,000 executives from 70 countries on the use of management tools and trends. Some key findings include:
- Executives feel positive about their ability to adapt but face challenges like customer loyalty, complexity, and cybersecurity threats.
- Opinions are split on whether to prioritize long-term results or short-term earnings and growth vs cost cutting.
- Half of firms are trying new techniques like advanced analytics and experimentation to address challenges.
- Attitudes vary regionally, with Asia-Pacific executives most optimistic and EMEA most concerned about issues like consumer insight.
Executives are pushing for revenue growth that was missed during the economic downturn and uneven recovery. The survey of over 1,200 global executives found that while a majority see improving economic conditions, confidence has slipped since 2010 due to a slower than expected recovery. As a result, over half of executives are concerned about meeting earnings targets in 2013. Executives are taking a more focused approach to management tools, using fewer tools more strategically to pursue revenue and profit growth. Revenue growth was cited twice as often as the second most important priority of increased profitability.
Executives surveyed indicated that revenue growth was their top priority for the next three years as they work to recover from the economic downturn. However, they face challenges to growth including price transparency online, concerns about meeting earnings targets, and rising healthcare costs constraining hiring. While executives see opportunities in customer relationships and innovation, many noted constraints including outdated IT systems and organizational complexity. The survey found variations by region and industry in outlook and priorities. Overall, executives expressed a need to focus investments in critical areas like customer management to enable renewed revenue growth.
This document summarizes the findings of Bain & Company's 15th annual Management Tools & Trends survey. It received responses from over 1,000 executives from over 70 countries. The survey tracks the use and effectiveness of 25 popular management tools. It found that customer relationship management remains the most widely used tool, while big data analytics was the most satisfying. It also identified trends in management priorities and tools, such as a focus on revenue growth, increased innovation, and a split between regions in their tool preferences.
This document summarizes the findings of Bain & Company's 15th annual Management Tools & Trends survey. It received responses from over 1,000 executives from over 70 countries. The survey tracks the use and effectiveness of 25 popular management tools. It found that customer relationship management remains the most widely used tool, while big data analytics was the most satisfying. It also revealed that executives are focused on revenue growth and innovation to capitalize on an improving economic outlook, though challenges around disruption and technology changes remain. Regional differences in tool preferences and economic optimism were also observed.
For today’s firm, change is constant. The ever-evolving realities of the profession inspired Wolters Kluwer to explore two major questions in our 2014 Accounting Firm Preparedness Survey. First, what trends will have the most significant impact on accounting firms and their clients over the next five years? Second, how well prepared are accountants to take advantage of these trends?
The document discusses marketing agility and how to achieve it through next wave marketing operations. It defines marketing agility as being able to quickly respond to market and customer opportunities. It identifies some key roadblocks to agility like siloed information and discusses how to remove them through business intelligence, customer profitability analysis, and marketing automation. The presentation provides strategies for leveraging marketing automation to improve alignment, accountability, and agility across the enterprise.
Consumer insights: Finding and Guarding the Treasure Trove InfographicCapgemini
Consumer Product (CP) companies operate in an industry where the fundamental rules of the game are changing. The growth of e-commerce, the ability to bypass retailers, the rise of private labels, and the advent of niche CP startups are just some of the trends that are reshaping the sector. Find out the latest findings from our Consumer Insights Infographic.
Executives are now focused on growth after the global economic downturn made them cautious. Revenue growth is the top priority for most executives over the next three years, as they believe economic conditions are improving. While some effects of the recession may persist, executives feel their companies are well positioned competitively for the future. Tools related to innovation, scenario planning, and price optimization are expected to see increased usage in 2011 as companies prepare for growth.
The document summarizes the findings of a survey on the state of digital healthcare marketing in 2017. Key findings include:
- Healthcare lags behind other industries in digital marketing efforts such as social media and mobile apps.
- CRM and marketing automation tools are being used more compared to 2015, but advanced technologies are still not widely deployed.
- Top challenges remain lack of budget, silos between departments, and resistance to change.
- Most organizations have not mapped customer journeys across digital and mobile channels.
The recommendations encourage healthcare marketers to improve measurement of ROI, transition to more technology-focused marketing, and continue educating leadership on the value of digital strategies.
The Deloitte Global Chief Procurement Officer Survey 2017Deloitte UK
The document summarizes key findings from the Deloitte Global CPO Survey 2017, which received responses from 480 procurement leaders from 36 countries representing $4.9 trillion in annual turnover. The survey found that cost reduction remains the top priority for CPOs as they look to support growth in an uncertain market. It also found that the main barriers to effective digital procurement are issues with data, people, and systems. Additionally, the survey showed that while executive support for procurement is high, most organizations have not improved their talent strategies or investment in training to close skills gaps for procurement teams.
Experian dv2020 - the new rules of customer engagement - emea research reportAltan Atabarut, MSc.
The document discusses how customer expectations are rising and how data and analytics can help organizations improve the customer experience. It finds that customer experience will be the ultimate differentiator by 2020. Organizations intend to use more internal data, negative data, and transactional data over the next five years to develop a holistic view of each customer. Big data is predicted to transform customer experience models, but organizations need better tools to capitalize on new data sources and reduce the "data to decision disconnect".
The document discusses the results of a survey on business priorities and the changing role of IT leadership. Key findings include:
- Over half of respondents said the role of IT leadership has become more strategic in the last 12 months.
- Nearly 70% see IT becoming more centralized in the coming year to manage global operations.
- Top business imperatives center on improving customer responsiveness, reducing costs, and improving business processes.
- Two-thirds rate IT-enabled transformation as important, with priorities including customer responsiveness, reducing costs, and improving business processes.
The document discusses the results of a survey on business priorities and the changing role of IT leadership. Key findings include:
- Over half of respondents said the role of IT leadership has become more strategic in the last 12 months.
- Nearly 70% see IT becoming more centralized in the coming year to manage global operations.
- Top business imperatives center on improving customer responsiveness, reducing costs, and improving business processes.
- Two-thirds rate IT-enabled transformation as important, with most citing improving processes, customer responsiveness, and reducing costs/TCO as the most important areas for IT to enable transformation.
The State of the Sales & Marketing FunnelDemand Metric
The classic B2B sales and marketing funnel is a model that has served marketers well for decades. An entire ecosystem of job titles, roles, responsibilities and technologies now exists around the funnel. Funnel management has evolved as a science with precise measurements that marketers use to manage and optimize a set of complimentary tools, processes and relationships that have to work in harmony to pull things through the funnel. But whether marketers realize it or not, they’re no longer working with their grandfather’s funnel.
A sustained period of barely perceptible change with the funnel has taken most marketers to an unfamiliar place. Top of funnel performance in the not too distant past was often the worst. It was predictably unreliable, with a chronic shortage of leads to feed the more efficient, demanding and hungry sales process at the bottom. An expansive collection of tools, technologies and solutions has been directed at the funnel’s traditionally weak point – the top – to increase the inflowing leads from a trickle, to a stream to now in many cases, a deluge. While marketers welcome the lead flow, for most it simply moves the problem to another funnel location.
The reality for many marketers is they now have more people interacting with their content. There are ever greater numbers of things to follow-up on, to route, to track and to push through the funnel. Demand Metric, in partnership with MRP, has completed a study about the current state of the funnel. The “funnel flow” survey measured how well leads flow through the sales and marketing funnel. This report shares the data and analysis from this research effort, providing insights on how to optimize the flow of leads through the funnel.
The document discusses the future of underwriting and how talent and technology will transform the role. It notes that underwriters will take on more transformative roles like sales executives, decision makers using predictive analytics, and customer advocates. Technology like sensors, telematics, and automation will change underwriting processes. Those who invest in analytical talent and tools like data management and pricing optimization will be better positioned for the future.
There is a shortage of great data analytics people available for hire today. But don't let that stop your organization, engage world class data experts when you need them.
Disruptive outsourcing leaps to the front. Our 2018 survey of more than 500 executives from leading organizations indicates that disruptive outsourcing solutions—led by cloud and automation—are fundamentally transforming traditional outsourcing. https://deloi.tt/2x7zxb8
5 major opportunities awaiting manufacturers and their CFOsGrant Thornton LLP
It’s an exciting time to be in manufacturing. Revenues are on the rise, employment is up, and with potential for increased profits, today’s manufacturing CFOs understand that their role goes beyond the bottom line. A fall 2014 Grant Thornton LLP survey of 350 CFOs explored some of these burgeoning possibilities. This infographic identifies C-level insights about how to make the most of them.
Find out more about our survey at grantthornton.com/valueaddCFO.
The document is a report summarizing the results of a survey of over 5,000 marketers about their budgets, priorities, and strategies for 2015 across digital channels. Some key findings include:
- 84% of marketers plan to increase or maintain their spending in 2015.
- Top challenges for marketers are new business development, quality of leads, and staying up to date with marketing technology/trends.
- Social media, mobile, and email are seen as core channels, with marketers focusing on metrics like traffic, click-through rates, and customer satisfaction.
The survey found that most marketers plan to increase or maintain their marketing budgets in 2015, with many shifting spending from traditional to digital channels. Social media marketing and mobile marketing were seen as most critical to businesses and were the top areas for increased spending. The biggest challenges identified were new business development, quality of leads, and staying up to date with marketing technologies. Marketers saw technologies like mobile apps, marketing automation, and CRM tools as most critical for creating a cohesive customer journey across channels.
SunTrust Bank uses Salesforce to streamline its sales process, improve relationship planning, and increase cross-LOB partnerships. This has led to increased fees, referrals, loans, and wallet share.
Wells Fargo's Consumer Credit Group implemented Salesforce to better leverage online leads, provide timely customer response, and improve sales agent productivity. It has helped scale processes and retain market share through integrated sales across channels.
The document discusses strategies for companies to achieve growth in challenging economic times through cost competitiveness. It outlines that companies need to focus on pricing, costs, cash, and capital to drive growth. Top performing companies strategically increase prices above inflation, take a holistic view of costs across the organization and supply chain, optimize working capital across the entire value chain including suppliers, and prioritize existing cash reserves to finance growth.
This document summarizes key insights from the 2018 Gartner CIO Agenda Report survey of over 3,000 CIOs. It finds that the role of the CIO is transforming from an IT delivery focus to a business-oriented role focused on growth, innovation, and digital transformation. CIOs now spend more time on executive leadership and differentiating technologies like analytics. While scaling digital initiatives remains challenging due to cultural barriers, most CIOs report their IT organizations are adapting well to changes brought by digital business. The document recommends CIOs take advantage of this adaptive environment to further their digital strategies and support business growth objectives.
The survey found that SaaS companies are increasingly focused on metrics related to existing customers, such as customer retention cost, health, and lifetime value. While over two-thirds of companies experienced annual churn rates of 5% or higher, spending on customer retention is growing. Fast growing companies tend to have lower churn rates and higher revenue from upsells/add-ons with existing customers. However, for most companies upsells contribute to less than 20% of new revenue, indicating it remains an opportunity area.
Ibm bis 2014 m. rolfe cfo insights from ibm global c suite studyIBM Switzerland
Performance Accelerators outperform other CFOs by perfecting financial efficiency, capitalizing on business insight, and creating profitable growth. They have mastered core finance duties and use analytics to develop deep insights from integrated internal and external data. This enables them to excel at scenario planning, risk management, and identifying growth opportunities. Performance Accelerators represent 7% of CFOs and are pushing the boundaries of the CFO role through their focus on analytics, profitable growth initiatives, and willingness to enter new areas beyond core finance.
The Global Chief Procurement Officer Survey 2018Deloitte UK
For the past seven years, the Global Chief Procurement Officer Survey has provided a global benchmark of the sentiment or procurement leaders and an insight into the key themes and challenges facing procurement, including market dynamics, value and collaboration, talent and leadership, and digital procurement.
Building Your Employer Brand with Social MediaLuanWise
Presented at The Global HR Summit, 6th June 2024
In this keynote, Luan Wise will provide invaluable insights to elevate your employer brand on social media platforms including LinkedIn, Facebook, Instagram, X (formerly Twitter) and TikTok. You'll learn how compelling content can authentically showcase your company culture, values, and employee experiences to support your talent acquisition and retention objectives. Additionally, you'll understand the power of employee advocacy to amplify reach and engagement – helping to position your organization as an employer of choice in today's competitive talent landscape.
[To download this presentation, visit:
https://www.oeconsulting.com.sg/training-presentations]
This PowerPoint compilation offers a comprehensive overview of 20 leading innovation management frameworks and methodologies, selected for their broad applicability across various industries and organizational contexts. These frameworks are valuable resources for a wide range of users, including business professionals, educators, and consultants.
Each framework is presented with visually engaging diagrams and templates, ensuring the content is both informative and appealing. While this compilation is thorough, please note that the slides are intended as supplementary resources and may not be sufficient for standalone instructional purposes.
This compilation is ideal for anyone looking to enhance their understanding of innovation management and drive meaningful change within their organization. Whether you aim to improve product development processes, enhance customer experiences, or drive digital transformation, these frameworks offer valuable insights and tools to help you achieve your goals.
INCLUDED FRAMEWORKS/MODELS:
1. Stanford’s Design Thinking
2. IDEO’s Human-Centered Design
3. Strategyzer’s Business Model Innovation
4. Lean Startup Methodology
5. Agile Innovation Framework
6. Doblin’s Ten Types of Innovation
7. McKinsey’s Three Horizons of Growth
8. Customer Journey Map
9. Christensen’s Disruptive Innovation Theory
10. Blue Ocean Strategy
11. Strategyn’s Jobs-To-Be-Done (JTBD) Framework with Job Map
12. Design Sprint Framework
13. The Double Diamond
14. Lean Six Sigma DMAIC
15. TRIZ Problem-Solving Framework
16. Edward de Bono’s Six Thinking Hats
17. Stage-Gate Model
18. Toyota’s Six Steps of Kaizen
19. Microsoft’s Digital Transformation Framework
20. Design for Six Sigma (DFSS)
To download this presentation, visit:
https://www.oeconsulting.com.sg/training-presentations
Unveiling the Dynamic Personalities, Key Dates, and Horoscope Insights: Gemin...my Pandit
Explore the fascinating world of the Gemini Zodiac Sign. Discover the unique personality traits, key dates, and horoscope insights of Gemini individuals. Learn how their sociable, communicative nature and boundless curiosity make them the dynamic explorers of the zodiac. Dive into the duality of the Gemini sign and understand their intellectual and adventurous spirit.
[To download this presentation, visit:
https://www.oeconsulting.com.sg/training-presentations]
This presentation is a curated compilation of PowerPoint diagrams and templates designed to illustrate 20 different digital transformation frameworks and models. These frameworks are based on recent industry trends and best practices, ensuring that the content remains relevant and up-to-date.
Key highlights include Microsoft's Digital Transformation Framework, which focuses on driving innovation and efficiency, and McKinsey's Ten Guiding Principles, which provide strategic insights for successful digital transformation. Additionally, Forrester's framework emphasizes enhancing customer experiences and modernizing IT infrastructure, while IDC's MaturityScape helps assess and develop organizational digital maturity. MIT's framework explores cutting-edge strategies for achieving digital success.
These materials are perfect for enhancing your business or classroom presentations, offering visual aids to supplement your insights. Please note that while comprehensive, these slides are intended as supplementary resources and may not be complete for standalone instructional purposes.
Frameworks/Models included:
Microsoft’s Digital Transformation Framework
McKinsey’s Ten Guiding Principles of Digital Transformation
Forrester’s Digital Transformation Framework
IDC’s Digital Transformation MaturityScape
MIT’s Digital Transformation Framework
Gartner’s Digital Transformation Framework
Accenture’s Digital Strategy & Enterprise Frameworks
Deloitte’s Digital Industrial Transformation Framework
Capgemini’s Digital Transformation Framework
PwC’s Digital Transformation Framework
Cisco’s Digital Transformation Framework
Cognizant’s Digital Transformation Framework
DXC Technology’s Digital Transformation Framework
The BCG Strategy Palette
McKinsey’s Digital Transformation Framework
Digital Transformation Compass
Four Levels of Digital Maturity
Design Thinking Framework
Business Model Canvas
Customer Journey Map
Call8328958814 satta matka Kalyan result satta guessing➑➌➋➑➒➎➑➑➊➍
Satta Matka Kalyan Main Mumbai Fastest Results
Satta Matka ❋ Sattamatka ❋ New Mumbai Ratan Satta Matka ❋ Fast Matka ❋ Milan Market ❋ Kalyan Matka Results ❋ Satta Game ❋ Matka Game ❋ Satta Matka ❋ Kalyan Satta Matka ❋ Mumbai Main ❋ Online Matka Results ❋ Satta Matka Tips ❋ Milan Chart ❋ Satta Matka Boss❋ New Star Day ❋ Satta King ❋ Live Satta Matka Results ❋ Satta Matka Company ❋ Indian Matka ❋ Satta Matka 143❋ Kalyan Night Matka..
Best Competitive Marble Pricing in Dubai - ☎ 9928909666Stone Art Hub
Stone Art Hub offers the best competitive Marble Pricing in Dubai, ensuring affordability without compromising quality. With a wide range of exquisite marble options to choose from, you can enhance your spaces with elegance and sophistication. For inquiries or orders, contact us at ☎ 9928909666. Experience luxury at unbeatable prices.
Industrial Tech SW: Category Renewal and CreationChristian Dahlen
Every industrial revolution has created a new set of categories and a new set of players.
Multiple new technologies have emerged, but Samsara and C3.ai are only two companies which have gone public so far.
Manufacturing startups constitute the largest pipeline share of unicorns and IPO candidates in the SF Bay Area, and software startups dominate in Germany.
Anny Serafina Love - Letter of Recommendation by Kellen Harkins, MS.AnnySerafinaLove
This letter, written by Kellen Harkins, Course Director at Full Sail University, commends Anny Love's exemplary performance in the Video Sharing Platforms class. It highlights her dedication, willingness to challenge herself, and exceptional skills in production, editing, and marketing across various video platforms like YouTube, TikTok, and Instagram.
IMPACT Silver is a pure silver zinc producer with over $260 million in revenue since 2008 and a large 100% owned 210km Mexico land package - 2024 catalysts includes new 14% grade zinc Plomosas mine and 20,000m of fully funded exploration drilling.
❼❷⓿❺❻❷❽❷❼❽ Dpboss Matka Result Satta Matka Guessing Satta Fix jodi Kalyan Final ank Satta Matka Dpbos Final ank Satta Matta Matka 143 Kalyan Matka Guessing Final Matka Final ank Today Matka 420 Satta Batta Satta 143 Kalyan Chart Main Bazar Chart vip Matka Guessing Dpboss 143 Guessing Kalyan night
Discover timeless style with the 2022 Vintage Roman Numerals Men's Ring. Crafted from premium stainless steel, this 6mm wide ring embodies elegance and durability. Perfect as a gift, it seamlessly blends classic Roman numeral detailing with modern sophistication, making it an ideal accessory for any occasion.
https://rb.gy/usj1a2
Top mailing list providers in the USA.pptxJeremyPeirce1
Discover the top mailing list providers in the USA, offering targeted lists, segmentation, and analytics to optimize your marketing campaigns and drive engagement.
1. This information is confidential and was prepared by Bain & Company solely for the use of our client; it is not to be relied on by any 3rd party without Bain's prior written consent
Management Tools and Trends 2015
Author: Darrell Rigby
Co-author: Barbara Bilodeau
2. • In 1993, Bain launched a multi-year research project to
get the facts about management tools and trends.
Our objective is two-fold:
- To provide managers with information they need to identify and
integrate tools that will improve bottom-line results
- To understand how global executives view their strategic challenges
and priorities
• Over the past 22 years, we have completed 14 surveys,
assembling a database that now includes 13,438 respondents
from more than 70 countries in North America, Europe, Asia,
Africa, the Middle East and Latin America
• This year, we received 1,067 completed surveys from a
broad range of international executives
3. 15 surveys and 13,438 respondents covering a
22-year span
0
20
40
60
80
100%
1993-2015
North America
EMEA
Asia-Pacific
Latin America
13,438
2015
North America
EMEA
Asia-Pacific
Latin America
1,067
Other
1
4. iThis year, we focused on 25 of the most popular tools and
techniques, listed on the slide below. To qualify for
inclusion, a tool had to be:
- Relevant to senior management
- Topical (as evidenced by coverage in the business press)
- Measurable
iWe defined these tools in a booklet titled Management Tools
2015, An Executive’s Guide
iSurveys were conducted online in partnership with
iThe survey is reprinted in the appendix at the back of this
report
5. We focused on 25 of the most popular tools
iBalanced Scorecard
iBenchmarking
iBig Data Analytics
iBusiness Process Reengineering
iChange Management Programs
iComplexity Reduction
iCore Competencies
iCustomer Relationship
Management
iCustomer Segmentation
iDecision Rights Tools
iDigital Transformation*
iDisruptive Innovation Labs*
iEmployee Engagement Surveys
iMergers and Acquisitions
iMission and Vision Statements
iOrganizational Time
Management*
iOutsourcing
iPrice Optimization Models
iSatisfaction and Loyalty
Management
iScenario & Contingency Planning
iStrategic Alliances
iStrategic Planning
iSupply Chain Management
iTotal Quality Management
iZero-based Budgeting
* Tool added to the survey in 2015
2
6. iGlobal respondents represent a full range of industries and
company sizes
iWith results of 13,438 surveys and more than 300 personal
interviews in our database, we have created the world’s
most comprehensive and definitive fact base on
management tools and trends
7. Global respondents represent the full range of
industries and company sizes
0
20
40
60
80
100%
Demographics of 2015 global respondents
Industry
Financial Services
Manufacturing
Tech & Telecomm
Services
Retail
Transport & Tourism
Utilities & Energy
Pharma & Biotech
Food & Beverage
Consumer Products
Chemicals & Metals
Construction & Real Estate
Healthcare
Wholesale, Distribution & Logistics
Media and Entertainment
Other
1,067
Corporate sales
<600MM
$600MM - <$2B
$2B+
1,067
3
8. iCompany size varied somewhat by region
- A larger percentage of North American respondents were from
large companies ($2 billion+ revenues)
- A larger percentage of Asia-Pacific respondents were from
medium-sized companies ($600 million to less than $2 billion
revenues)
- A larger percentage of EMEA and Latin American respondents
were from small companies (less than $600 million revenues)
9. Company size by region
0
20
40
60
80
100%
Percent of respondents
North
America
<$600M
$600m to
<$2B
$2B+
EMEA Asia-Pacific Latin
America
4
10. This year’s trends analysis highlights:
• Executives seem to be feeling more positive
- Three-fourths say their current financial performance is strong and that their ability to
adapt to change is a significant competitive advantage
- Over half feel that economic conditions are improving in their industry
• But also face many challenges
- Six of ten believe customers are less loyal to brands than they used to be
- Six of ten feel that excessive complexity is raising their costs and hindering growth
- Two-thirds say that over the next 3 years, spending on IT must increase as a percent of
sales
- Perhaps somewhat driven by concerns of a cyber attack as fifty-five percent say they
are concerned about the impact of a cyber attack on their business
- However, fewer feel that IT is holding them back from growth, with four of ten
saying that current information systems are constraining profitable growth and three
of ten saying they don’t have the technology capabilities required to be a leader in
their industry
• There is a split on what firms are focused on
- Six of ten say their management actions favor long-term results over short-term earnings
- Five of ten say that over the next 3 years, they will focus more on revenue growth than
cost reduction
• Half of firms are adapting to current challenges by trying newer techniques
- Fifty-two percent say Advanced Analytics are transforming their marketing strategy
- Forty-eight percent feel they use experimentation and testing techniques proficiently
• While six of ten feel that mergers and acquisitions will be critical to success in
their industry
11. The view on management trends
Disagree
Agree
Our ability to adapt to change is a significant competitive advantage
Innovation is more important than cost reduction for long-term success
Our current financial performance is strong
Over the next 3 years, our spending on IT must increase as a percent of our sales
Customers are less loyal to brands than they used to be
Excessive complexity is raising our costs and hindering our growth
Sustainability initiatives are improving our growth and profitability
Our management actions favor long-term results over short-term earnings
Effective mergers and acquisitions will be critical to success in our industry
The principles and passions of our founders still dominate our operating practices today
I am very concerned about the impact a cyber attack could have on our business
It feels like economic conditions are improving in our industry
Increased price transparency has had a major impact on our pricing strategy
Over the next 3 years, we will focus more on revenue growth than cost reduction
Advanced Analytics are transforming our marketing strategy
We use experimentation and testing techniques proficiently
Insufficient consumer insight is hurting our performance
Our current information systems are constraining profitable growth
Our top management is unwilling to take greater risks for higher returns
We don’t have the technology capabilities required to be a leader in our industry
75%
74%
74%
64%
62%
60%
59%
58%
57%
57%
55%
55%
54%
52%
52%
48%
46%
42%
39%
29%
13%
9%
10%
16%
19%
18%
13%
22%
22%
22%
23%
24%
14%
27%
14%
24%
29%
32%
39%
56% 5
12. iSome of these attitudes vary by region
- North American and Asia-Pacific executives are more concerned about cyber
attacks
- Asia-Pacific and North American executives are more likely to feel economic
conditions in their industry are improving
- EMEA and Asia-Pacific executives are more likely to feel innovation is more
important than cost reduction for long-term success
- EMEA and Asia-Pacific executives are more likely to feel insufficient consumer
insight is hurting their performance
- Latin American executives are more likely to feel their customers are not
loyal to brands
- Asia-Pacific and Latin American executives are more likely to feel that the
principles and passions of their founders still guide their business; while
EMEA executives less so
13. Attitudes vary by region
• Our ability to adapt to change is a significant competitive advantage 68% 75% 88% 75%
• Innovation is more important than cost reduction for long-term success 63% 83% 84% 74%
• Our current financial performance is strong 76% 71% 76% 71%
• Over the next 3 yrs, our spending on IT must increase as a percent of sales 58% 56% 83% 65%
• Customers are less loyal to brands than they used to be 64% 60% 54% 68%
• Excessive complexity is raising our costs and hindering our growth 55% 67% 68% 53%
• Sustainability initiatives are improving our growth and profitability 54% 56% 85% 46%
• Our management actions favor long-term results over short-term earnings 53% 49% 80% 56%
• Effective mergers and acquisitions will be critical to success in our industry 50% 58% 74% 54%
• Principles & passions of our founders still dominate our operating practices 55% 43% 71% 64%
• I am very concerned about the impact a cyber attack could have on us 60% 47% 74% 36%
• It feels like economic conditions are improving in our industry 61% 44% 80% 31%
• Increased price transparency has had a major impact on our pricing strategy 49% 54% 76% 43%
• Over the next 3 yrs, we’ll focus more on revenue growth than cost reduction 49% 45% 72% 49%
• Advanced Analytics are transforming our marketing strategy 47% 45% 83% 38%
• We use experimentation and testing techniques proficiently 43% 39% 75% 45%
• Insufficent consumer insight is hurting our performance 36% 56% 57% 40%
• Our current information systems are constraining profitable growth 37% 40% 57% 40%
• Our top management is unwilling to take greater risks for higher returns 35% 36% 49% 40%
• We don’t have the tech capabilities required to be a leader in our industry 28% 27% 34% 30%
Significantly higher than executives not in that region
Significantly lower than executives not in that region
N America EMEA APAC L America
6
14. Note: Emerging markets defined as those who are part of the MSCI Emerging Markets IndexSM.
As of June 2014 the index consisted of the following 23 emerging market country indices: Brazil,
Chile, Columbia, Mexico, Peru, Czech Republic, Egypt, Greece, Hungary, Poland, Qatar, Russia, South
Africa, Turkey, United Arab Emirates, China, India, Indonesia, Korea, Malaysia, Philippines, Taiwan,
Thailand
iWe divided the companies into emerging vs. established markets to
understand how their attitudes and behavior differ
-The attitudes with the biggest differentials between agreement by emerging
market and established market executives were
-We use experimentation and testing techniques proficiently (19%)
-The principles and passions of our founders still dominate our operating practices
(18%)
-Over the next 3 years, our spending on IT must increase as a percent of our sales
(17%)
-Our management actions favor long-term results over short-term earnings (17%)
15. • Our ability to adapt to change is a significant competitive advantage 71% 82%
• Innovation is more important than cost reduction for long-term success 71% 79%
• Our current financial performance is strong 74% 73%
• Over the next 3 years, our spending on IT must increase as a percent of our sales 57% 74%
• Customers are less loyal to brands than they used to be 63% 61%
• Excessive complexity is raising our costs and hindering our growth 60% 61%
• Sustainability initiatives are improving our growth and profitability 55% 66%
• Our management actions favor long-term results over short-term earnings 51% 68%
• Effective mergers and acquisitions will be critical to success in our industry 53% 64%
• The principles and passions of our founders still dominate our operating practices 50% 68%
• I am very concerned about the impact a cyber attack could have on our business 55% 55%
• It feels like economic conditions are improving in our industry 54% 56%
• Increased price transparency has had a major impact on our pricing strategy 51% 60%
• Over the next 3 years, we will focus more on revenue growth than cost reduction 47% 60%
• Advanced analaytics are transforming our marketing strategies 47% 61%
• We use experimentation and testing techniques proficiently 41% 60%
• Insufficient consumer insight is hurting our performance 44% 49%
• Our current information systems are constraining profitable growth 38% 49%
• Our top management is unwilling to take greater risks for higher returns 35% 44%
• We don’t have the technology capabilities required to be a leader in our industry 27% 32%
Agreement level varies by market type
Significantly higher than companies not in that market type
Established Emerging
7
16. • Attitudes also vary by company size. Executives at large companies
($2B+ revenue) are more likely to agree with
- I am very concerned about the impact a cyber attack could have on us
• Large company executives are less likely to feel
- Innovation is more important than cost reduction for long-term success
- Over the next 3 years, we will focus more on revenue growth than cost
reduction
17. • Our ability to adapt to change is a significant competitive advantage 73% 78% 75%
• Innovation is more important than cost reduction for long-term success 68% 82% 74%
• Our current financial performance is strong 76% 78% 67%
• Over the next 3 yrs, our spending on IT must increase as a percent of sales 60% 75% 58%
• Customers are less loyal to brands than they used to be 65% 61% 59%
• Excessive complexity is raising our costs and hindering our growth 60% 62% 59%
• Sustainability initiatives are improving our growth and profitability 59% 71% 49%
• Our management actions favor long-term results over short-term earnings 56% 66% 53%
• Effective mergers and acquisitions will be critical to success in our industry 58% 64% 51%
• The principles & passions of our founders still dominate our operating practices 54% 64% 54%
• I am very concerned about the impact a cyber attack could have on us 59% 61% 45%
• It feels like economic conditions are improving in our industry 58% 64% 43%
• Increased price transparency has had a major impact on our pricing strategy 52% 64% 49%
• Over the next 3 yrs, we will focus more on revenue growth than cost reduction 43% 62% 55%
• Advanced Analytics are transforming our marketing strategies 52% 65% 41%
• We use experimentation and testing techniques proficiently 47% 62% 39%
• Insufficient consumer insight is hurting our performance 42% 52% 44%
• Our current information systems are constraining profitable growth 40% 51% 37%
• Our top management is unwilling to take greater risks for higher returns 36% 46% 36%
• We don’t have the technology capabilities required to be a leader in our industry 28% 32% 28%
Attitudes vary by company size
Significantly higher than executives in other sized companies
Significantly lower than executives in other sized companies
Large Medium Small
8
18. iConfidence in economic conditions in their industry varies
- Pharma & Biotech, Construction & Real Estate, Financial Services,
and Manufacturing firms are most confident that things are
improving
- Consumer Products, Utilities & Energy and Food & Beverage firms
are least confident
Note: Small sample sizes
19. Pharma & Biotech, Construction & Real estate and Financial Services
companies are most optimistic about economic conditions; Utilities &
Energy and Consumer Products least
0
20
40
60
80
65
61 60 60 59 58 57 56 56
52 49 46 44
40 38
39
55 94
151
53 50
33
38 42
174 46
33
167 18
49
Respondents
Percent of respondents who agreed
“It feels like economic conditions are improving in our industry”
9
20. iExecutive’s concerns over a cyber attack vary by industry
- Those in Healthcare, Financial Services and Tech & Telecomm are
most concerned about the impact of a cyber attack
- Food & Beverage, Consumer Products and Media & Entertainment
executives are least concerned
Note: Small sample sizes
21. Executives at Healthcare and Financial Services firms are most
concerned with cyber attacks
0
20
40
60
80
70 67
62
58 56 55 55 54 53
48 45
39 39 36
28
33 94 33 38 18 42 46
174 151 53 50 167 49 39 55
Respondents
Percent of respondents who agreed
“I am very concerned about the impact a cyber attack could have on our business”
10
22. iAdvanced Analytics are having more of an impact on some
industries than others
- Healthcare, Financial Services, Pharma & Biotech and Tech &
Telecomm firms are most likely to say Advanced Analytics are
transforming their marketing strategy
- Executives in Chemicals & Metals, Consumer Products and Media &
Entertainment are least likely to say there is an impact
Note: Small sample sizes
23. Advanced Analytics are having the most impact on Healthcare and
Financial Services firms
0
20
40
60
80
67
61 59 58 57 56
52 51
45 43 42 41 39 36
31
33 94 50 46 18 42 39
174 49 151 53 167 33 55 38
Respondents
Percent of respondents who agreed
“Advanced Analytics are transforming our marketing strategies”
11
24. • We have asked some of the attitude statements in previous
years. Key differences in 2014 are:
- Fewer executives believe
- Customers are less loyal to brands than they used to be
- Our management actions favor long-term results over short-term
earnings
- Increased price transparency has had a major impact on our pricing
strategy
- Over the next 3 years, we will focus more on revenue growth than cost
reduction
- Our current information systems are constraining profitable growth
-More executives
-Are concerned about the impact of a cyber attack on their business
25. 2012
75%
74%
67%
65%
64%
63%
61%
57%
57%
50%
50%
49%
2014
75%
74%
62%
64%
58%
60%
54%
52%
55%
55%
46%
42%
Executives’ beliefs over time
Significantly higher than 2014 Significantly lower than 2014
12
•Our ability to adapt to change is a significant competitive advantage
•Innovation is more important than cost reduction for long-term success
•Customers are less loyal to brands than they used to be
•Over the next 3 years, our spending on IT must increase as a percent of sales
•Our mgmt actions favor long-term results over short-term earnings
•Excessive complexity is raising our costs and hindering our growth
•Increased price transparency has had a major impact on our pricing strategy
•Over the next 3 yrs, we will focus more on revenue growth than cost reduction
•It feels like economic conditions are improving in our industry
•I’m very concerned about impact a cyber attack could have on our business
•Insufficient consumer insight is hurting our performance
•Our current information systems are constraining profitable growth
2010
81%
81%
-
-
-
-
-
63%
74%
-
45%
-
2008
-
76%
-
-
-
-
-
53%
-
-
46%
-
2006
-
79%
-
-
-
-
-
-
-
-
51%
-
2004
-
86%
-
-
-
68%
-
56%
-
-
65%
-
26. • We asked executives what their company’s top priority was
over the next three years
• Growth was clearly the dominating theme in executive’s minds
• Other key topics were Innovation, Costs, Customers and
Profitability
28. • We classified the open-ended responses to “What is your
organization’s most important priority over the next 3 years”
into categories
- Revenue growth remained the priority mentioned most often
- Increased profitability and cost cutting were mentioned next most
often, though both were down slightly from 2012
29. Revenue growth is a key priority for executives,
followed by increased profitability and cost cutting
0
10
20
30
40
Percent of respondents who mentioned
31
11 11 10
8
6 5 5 5
3 3 3
2012 Percent Mentioned
“What is your organization’s most important priority over the next 3 years?”
14
30. • Tool usage was similar to 2012
-An average of 7 tools were used in 2014, down slightly from 7.4 in
2012
32. iWhile large companies continue to use more tools, their usage
declined, while usage by medium-sized companies increased
33. Larger firms use more management tools, but usage
increased in medium-sized companies
Large companies
($2b+)*
Medium companies
($600M - <$2B)*
Small companies
(<$600M)*
*Based on annual revenues
16
34. iNumber of tools used was highest in Asia-Pacific and
North America
- Though usage declined slightly in both regions, while it
increased in Latin America
35. Latin America saw an increase in number of tools used, while
North America and Asia saw slight declines
0
5
10
0
5
10
Asia
8.0
North
America
7.2
Europe
6.6
Latin
America
6.2
396 263
206 202
Respondents:
Average number of tools used in 2014
2014
Average
2012
Average
17
36. iThe number of tools used is consistently higher for large
companies across regions
37. Tool usage in all regions declines with company size
0
5
10
15
0
5
10
15
N
Amer
Large
7.9
7.9
N
Amer
Med
8.0
8.0
N
Amer
Small
5.2
5.2
Euro
Large
7.5
7.5
Euro
Med
7.0
7.0
Euro
Small
5.6
5.6
Asia
Large
9.9
9.9
Asia
Med
8.5
8.5
Asia
Small
5.6
5.6
LatAm
Large
8.5
8.5
LatAm
Med
6.6
6.6
LatAm
Small
4.8
4.8
Average number of tools used in 2014
18
38. •The number of tools used varies by industry
-Heaviest users are:
-Transport & Tourism
-Manufacturing
-Tech & Telecomm
- Lightest users are:
-Media & Entertainment
-Construction & Real Estate
-Utilities & Energy
-Healthcare
39. Tool usage varies by industry
0
5
10
0
5
10
8.3 8.2
7.6 7.5 7.5 7.5 7.2 7.1 6.9
6.0 6.0 5.8 5.8 5.7
3.6
39 55 94
151
53 50
33 38
42 174
46 33
167 18
49
Average number of tools used in 2014
Respondents
19
40. • The six tools that were used by the most firms in 2012 remained
the top six in 2014, with Customer Relationship Management
once again being the most used tool
• Some tools stand out as winners and losers
-While no tool is right for everyone, Customer Relationship
Management and Strategic Planning were once again above average
in both usage and satisfaction
-On the flip side, Complexity Reduction was below average in both
usage and satisfaction
-As it was in 2010 and 2012, Outsourcing was above average in
usage, but below average in satisfaction
-Change Management Programs were also above average in usage,
but below average in satisfaction
41. Usage and satisfaction rates in 2014
CRM
Benchmarking
Employee Engagement Surveys
Strategic Planning
Outsourcing
Balanced Scorecard
Mission and Vision Statements
Supply Chain Management
Change Management Programs
Customer Segmentation
Big Data Analytics
Core Competencies
Total Quality Management
Mergers and Acquisitions
Business Process Reengineering
Satisfaction and Loyalty Management
Strategic Alliances
Organizational Time Management
Digital Transformation
Scenario and Contingency Planning
Complexity Reduction
Price Optimization Models
Decision Rights Tools
Zero-based Budgeting
Disruptive Innovation Labs
46%* 3.93*
44%* 3.80
44%* 3.75
44%* 3.93*
41%* 3.61**
38%* 3.90
38%* 3.82
36%* 3.85
34%* 3.69**
30% 3.96*
29% 4.01*
29% 3.78
29% 3.97*
28% 3.87
26% 3.78
24%** 3.86
22%** 3.90
21%** 3.76
18%** 3.94
18%** 3.80
17%** 3.67**
17%** 3.87
10%** 3.92
10%** 3.72
8%** 3.95
*Significantly above the overall mean **Significantly below the overall mean (usage = 28%, satisfaction = 3.84)
Usage Satisfaction
20
42. • We identified the top 10 tools globally and by region
- The tool used most often in North America was once again
Employee Engagement Surveys, followed by Benchmarking and
Strategic Planning
- Customer Relationship Management and Benchmarking were the
tools used most often in EMEA
- Asia-Pacific firms use a different set of tools than their
counterparts elsewhere
- The tool used most often was Big Data Analytics, and Total
Quality Management was also in their top
- Change Management Programs and Mission & Vision
Statements were ranked much lower than elsewhere
- Business Process Reengineering and Strategic Alliances were in
the top ten for Latin American firms
44. iComparing the top 10 tools over time shows several key
points about tool usage
-Some tools such as Strategic Planning, Benchmarking and
Mission and Vision Statements consistently remain in the top
10
-Others such as Total Quality Management, which were once
widely used, are now much less universally used
-Core Competencies was the only tool to drop out of the top
10 from 2012
46. • North American firms are heavier users of many tools
- Benchmarking, Employee Engagement Surveys, Strategic
Planning, Mission and Vision Statements, Core Competencies and
Mergers & Acquisitions
• EMEA firms are heavier users of
- Benchmarking, Balanced Scorecard, Change Management
Programs, and Customer Segmentation
• Asia-Pacific firms are heavier users of many tools, but lighter
users of the more traditional tools mentioned above
• Latin American firms are heavier users of Strategic Planning,
Business Process Reengineering and Strategic Alliances
47. Usage rates vary by region
• Customer Relationship Management 48% 50% 48% 38%
• Benchmarking 50% 50% 29% 42%
• Employee Engagement Surveys 55% 41% 38% 31%
• Strategic Planning 50% 31% 42% 52%
• Outsourcing 42% 44% 42% 31%
• Balanced Scorecard 39% 44% 28% 39%
• Mission and Vision Statements 45% 37% 27% 36%
• Supply Chain Management 39% 30% 48% 24%
• Change Management Programs 37% 39% 24% 31%
• Customer Segmentation 22% 39% 31% 34%
• Big Data Analytics 27% 24% 52% 17%
• Core Competencies 36% 23% 39% 15%
• Total Quality Management 22% 25% 47% 28%
• Mergers and Acquisitions 34% 24% 28% 24%
• Business Process Reengineering 22% 21% 32% 35%
• Satisfaction and Loyalty Management 23% 19% 34% 19%
• Strategic Alliances 19% 19% 26% 32%
• Organizational Time Management 22% 17% 31% 14%
• Digital Transformation 14% 14% 33% 15%
• Scenario and Contingency Planning 20% 15% 16% 17%
• Complexity Reduction 15% 17% 26% 14%
• Price Optimization Models 15% 14% 28% 15%
• Decision Rights Tools 7% 9% 22% 4%
• Zero-based Budgeting 10% 6% 13% 9%
• Disruptive Innovation Labs 7% 6% 17% 3%
Use tool significantly more than those not in region
Use tool significantly less than those not in region
N America EMEA APAC L America
23
48. •Tool usage differs between Established and Emerging Market firms
•Established Market Firms are heavier users of the more traditional
tools such as Benchmarking, Employee Engagement Surveys,
Balanced Scorecard and Mission and Vision Statements
•Emerging Market Firms use some of the newer tools such as Big
Data analytics, Digital Transformation and Disruptive Innovation
Labs more often
49. Tool usage varies by market type
• Customer Relationship Management 49% 43%
• Benchmarking 50% 35%
• Employee Engagement Surveys 49% 35%
• Strategic Planning 42% 47%
• Outsourcing 43% 37%
• Balanced Scorecard 41% 34%
• Mission and Vision Statements 42% 31%
• Supply Chain Management 35% 36%
• Change Management Programs 38% 27%
• Customer Segmentation 29% 32%
• Big Data Analytics 26% 35%
• Core Competencies 31% 27%
• Total Quality Management 23% 38%
• Mergers and Acquisitions 30% 26%
• Business Process Reengineering 22% 34%
• Satisfaction and Loyalty Management 22% 27%
• Strategic Alliances 19% 29%
• Organizational Time Management 20% 22%
• Digital Transformation 14% 24%
• Scenario and Contingency Planning 18% 16%
• Complexity Reduction 16% 20%
• Price Optimization Models 15% 22%
• Decision Rights Tools 8% 13%
• Zero-based Budgeting 9% 11%
• Disruptive Innovation Labs 7% 10%
Use tool significantly more than those not in market type 24
50. iThe larger the firm, the more likely they are to use the vast
majority of tools
51. 25
More large firms use most management tools
Customer Relationship Management
Benchmarking
Employee Engagement Surveys
Strategic Planning
Outsourcing
Balanced Scorecard
Mission and Vision Statements
Supply Chain Management
Change Management Programs
Customer Segmentation
Big Data Analytics
Core Competencies
Total Quality Management
Mergers and Acquisitions
Business Process Reengineering
Satisfaction and Loyalty Management
Strategic Alliances
Organizational Time Management
Digital Transformation
Scenario and Contingency Planning
Complexity Reduction
Price Optimization Models
Decision Rights Tools
Zero-based Budgeting
Disruptive Innovation Labs
40%
35%
35%
33%
37%
30%
33%
23%
28%
26%
17%
21%
21%
18%
20%
15%
17%
15%
10%
14%
11%
13%
5%
6%
4%
50%
42%
41%
49%
39%
38%
33%
44%
30%
34%
38%
33%
36%
28%
31%
29%
27%
24%
24%
15%
19%
21%
14%
12%
12%
50%
53%
53%
50%
45%
45%
46%
40%
42%
31%
33%
34%
30%
38%
29%
27%
24%
24%
20%
22%
22%
18%
10%
11%
9%
Significantly higher usage rate than other sized companies
Significantly lower usage rate than other sized companies
Large Medium Small
52. • The average overall satisfaction rating is 3.84, almost exactly the
same of the average of 3.83 in 2011
• North American executives were generally less satisfied with tools
while Asia-Pacific executives were generally more satisfied
• Big Data Analytics remained the satisfaction leader
• Total Quality Management, Customer Segmentation, Customer
Relationship Management and Strategic Planning all had above
average satisfaction scores
• Tools with below average satisfaction ratings were
-Outsourcing (was also below average in 2010 and 2012)
-Change Management Programs
-Complexity Reduction
53. 26
North American executives were much less satisfied with
the majority of tools, Asia executives much more satisfied
Big Data Analytics
Total Quality Management
Customer Segmentation
Disruptive Innovation Labs
Digital Transformation
Customer Relationship Management
Strategic Planning
Decision Rights Tools
Balanced Scorecard
Strategic Alliances
Mergers and Acquisitions
Price Optimization Models
Satisfaction and Loyalty Management
Supply Chain Management
Mission and Vision Statements
Benchmarking
Scenario and Contingency Planning
Business Process Reengineering
Core Competencies
Organizational Time Management
Employee Engagement Surveys
Zero-based Budgeting
Change Management Programs
Complexity Reduction
Outsourcing
4.01* 3.69 3.87 4.43 3.94
3.97* 3.81 3.83 4.18 4.05
3.96* 3.91 3.94 4.17 3.87
3.95 3.63 4.00 4.19 3.83
3.94 3.73 3.81 4.28 3.73
3.93* 3.86 3.82 4.24 3.87
3.93* 3.83 3.89 4.20 3.92
3.92 3.62 3.79 4.24 3.56
3.90 3.78 3.86 4.28 3.91
3.90 3.92 3.80 4.11 3.80
3.87 3.81 3.83 3.95 3.98
3.87 3.67 3.64 4.29 3.73
3.86 3.76 3.76 4.13 3.71
3.85 3.70 3.77 4.09 4.00
3.82 3.72 3.71 4.07 4.05
3.80 3.74 3.86 4.15 3.61
3.80 3.69 3.60 4.27 3.82
3.78 3.58 3.66 4.21 3.72
3.78 3.75 3.62 3.95 3.81
3.76 3.55 3.66 4.08 3.89
3.75 3.64 3.89 3.84 3.79
3.72 3.56 3.71 4.00 3.67
3.69** 3.59 3.67 3.96 3.76
3.67** 3.34 3.45 4.09 3.89
3.61** 3.60 3.39 3.98 3.51
Global Avg
= 3.84
*Significantly above/**below the global mean Significantly higher than other regions Significantly lower
N America EMEA APAC L America
Global
54. • Respondents in emerging markets are more satisfied with
almost all tools
55. 27
Executives in emerging markets were more satisfied
with several tools
Big Data Analytics
Total Quality Management
Customer Segmentation
Disruptive Innovation Labs
Digital Transformation
Customer Relationship Management
Strategic Planning
Decision Rights Tools
Balanced Scorecard
Strategic Alliances
Mergers and Acquisitions
Price Optimization Models
Satisfaction and Loyalty Management
Supply Chain Management
Mission and Vision Statements
Benchmarking
Scenario and Contingency Planning
Business Process Reengineering
Core Competencies
Organizational Time Management
Employee Engagement Surveys
Zero-based Budgeting
Change Management Programs
Complexity Reduction
Outsourcing
4.31
4.13
4.02
4.14
4.11
4.08
4.04
4.13
4.07
3.94
3.96
4.10
3.98
4.06
4.06
3.83
4.04
3.96
3.91
4.02
3.82
3.87
3.85
4.02
3.78
3.76
3.82
3.93
3.77
3.76
3.85
3.85
3.70
3.82
3.87
3.81
3.66
3.76
3.72
3.71
3.79
3.66
3.61
3.71
3.58
3.72
3.60
3.62
3.39
3.51
Significantly higher than those not in market type
Established Emerging
56. iLarge companies were less satisfied with Organizational Time
Management
• Medium-sized companies were more satisfied with many of the tools
• Small companies were less satisfied with several of the tools
- Big Data Analytics
- Digital Transformation
- Strategic Alliances
- Benchmarking
57. 28
Large companies were less satisfied with several tools
Big Data Analytics
Total Quality Management
Customer Segmentation
Disruptive Innovation Labs
Digital Transformation
Customer Relationship Management
Strategic Planning
Decision Rights Tools
Balanced Scorecard
Strategic Alliances
Mergers and Acquisitions
Price Optimization Models
Satisfaction and Loyalty Management
Supply Chain Management
Mission and Vision Statements
Benchmarking
Scenario and Contingency Planning
Business Process Reengineering
Core Competencies
Organizational Time Management
Employee Engagement Surveys
Zero-based Budgeting
Change Management Programs
Complexity Reduction
Outsourcing
3.77
3.88
3.91
3.86
3.57
3.89
3.86
3.95
3.91
3.64
3.87
3.67
3.76
3.80
3.85
3.66
3.69
3.66
3.72
3.85
3.66
3.50
3.55
3.53
3.47
4.23
4.02
3.99
4.17
4.21
4.03
3.95
3.98
3.99
4.05
3.88
4.08
3.96
3.88
3.84
3.93
3.89
3.95
3.86
3.97
3.93
4.00
3.91
3.88
3.81
3.93
3.99
3.98
3.77
3.88
3.88
3.94
3.85
3.84
3.95
3.85
3.81
3.82
3.85
3.80
3.81
3.80
3.72
3.75
3.56
3.70
3.58
3.66
3.59
3.57
Significantly higher satisfaction rate than other sized companies Significantly lower satisfaction rate
Large Medium Small
58. • The odds of success vary widely for different tools.
For example, 32% of those who use Total Quality Management
report that they are extremely satisfied with the tool, while only
6% say they are dissatisfied, creating a positive “satisfaction
spread” of 26 points (32–6)
• At the bottom of the page are tools, Outsourcing and Change
Management programs, that dissatisfied almost as many users as
they pleased
60. iMajor efforts achieve better satisfaction scores than limited
efforts do for all tools. Perhaps some tools should not be used
on a limited basis at all
iFor some tools, the differences are enormous. Balanced
Scorecard is tied as the 3rd highest rated tool when used as
part of a major effort, but tied for 18th when used on a limited
basis
iIt is important to understand incremental benefits of pursuing a
major versus minor effort with each of these tools before
deciding which tools to use and how much effort will be devoted
to implementing them
61. 30
Major efforts achieve higher satisfaction
Big Data Analytics
Disruptive Innovation Labs
Balanced Scorecard
Total Quality Management
Customer Segmentation
Digital Transformation
Strategic Alliances
Decision Rights Tools
Customer Relationship Management
Price Optimization Models
Mergers and Acquisitions
Benchmarking
Strategic Planning
Satisfaction and Loyalty Management
Supply Chain Management
Organizational Time Management
Business Process Reengineering
Mission and Vision Statements
Scenario and Contingency Planning
Zero-based Budgeting
Core Competencies
Employee Engagement Surveys
Change Management Programs
Complexity Reduction
Outsourcing
3.65
3.70
3.53
3.57
3.69
3.52
3.64
3.70
3.63
3.62
3.64
3.55
3.63
3.59
3.52
3.51
3.53
3.58
3.54
3.43
3.59
3.59
3.53
3.49
3.50
4.22
4.22
4.19
4.19
4.17
4.17
4.12
4.11
4.09
4.09
4.08
4.07
4.07
4.03
4.02
4.01
4.00
4.00
4.00
3.93
3.91
3.87
3.82
3.82
3.72
Limited effort score
Major effort score
62. • The tools in the upper right quadrant are both more widely used
and have satisfaction scores above the mean
- CRM, Balanced Scorecard, Customer Segmentation, TQM and Big Data
Analytics
• Loyalty Management, Strategic Alliances, Digital Transformation,
Price Optimization Models, Decision Rights Tools and Disruptive
Innovation Labs are all above average satisfaction, but below
average usage
• The tools that performed the worst are in the bottom left quadrant
• Employee Engagement Surveys and Outsourcing have above
average usage, but below average satisfaction
63. 5
20
35
50%
3.50 4.10
Disruptive Innovation Labs
Zero-based Budgeting Decision Rights Tools
Price Optimization Models
Complexity Reduction
Scenario Planning Digital Transformation
Org Time Mgmt
Strategic Alliances
Loyalty Mgmt
Reengineering
Core Competencies
Change Management
Supply Chain Management
Mission and Vision Statements
Balanced Scorecard
Outsourcing
Strategic Planning
CRM
Satisfaction
Usage
Benchmarking
Mergers & Acquisitions
TQM
Big Data Analytics
Customer Segmentation
Employee Surveys
2014 usage and satisfaction
31
64. • All tools are projected to have higher usage levels in 2015.
Those with the biggest projected gain are:
- Scenario and Contingency Planning
- Complexity Reduction
- Organizational Time Management
66. • Less than a quarter of executives are extremely satisfied
with their organization’s performance on any of the firm
metrics
• Satisfaction on all performance metrics are similar to 2012
• Satisfaction with Financial Results is once again the highest
and Organizational Integration the lowest
Will look at correlations
between this question and
usage in final version
67. Satisfaction with firm performance
0
20
40
60
80
100
Percent of respondents
(n = 1067)
Financial
Results
Extremely
satisfied
Somewhat
satisfied
76
Competitive
Positioning
71
Customer
Equity
69
Long-Term
Performance
Capabilities
69
Organizational
Integration
60
13% 6% 9%
10% 14%
Percent not
satisfied (1/2)
Extremely satisfied
Somewhat satisfied
2013 Percent Satisfied
“How satisfied are executives with your organization’s 2014 results on each performance dimension”
33
68. 1. Get the facts: Every tool carries a set of strengths and weaknesses. Success requires
understanding the full effects—and side effects—of each tool and then creatively
combining the right ones in the right ways at the right times. Use the research.
Talk to other tool users. Don’t naively accept hyperbole and simplistic solutions
2. Champion enduring strategies, not fleeting fads: Line managers and tool gurus
don’t always have perfectly aligned agendas. Tool gurus may provoke stimulating
discussions, but managers must manage. Managers who promote fleeting fads
undermine employees’ confidence that they can create needed change; such managers’
programs are greeted with increasing skepticism. Executives would be better served by
championing realistic, strategic directions and regarding the specific tools for getting
there as ancillary
3. Choose the best tools for the job: Managers need a rational system for selecting,
implementing and integrating the tools appropriate for their companies. A management
tool will improve results only to the extent that it:
a. Discovers unmet customer needs;
b. Builds distinctive capabilities;
c. Exploits competitor vulnerabilities;
d. Develops breakthrough strategies by effectively integrating these accomplishments.
4. Adapt tools to your business system (not vice versa)
On the basis of our research to date, we offer four suggestions for the usage of tools:
69. Tool tips
iGet the facts
iChampion enduring strategies, not fleeting fads
iChoose the best tool for the job
iAdapt tools to your business system
34
91. Decision Rights Tools
“Decision Rights Tools: Helps companies to organize their decision making and execution by setting clear roles and
accountabilities and by giving all those involved a sense of ownership of decisions: when to provide input, who should
follow through and what is beyond their scope. Related topics: Governance Roles, Job Descriptions, Organization
Design”
-
-
1994:
-
-
1995:
-
-
1996:
-
-
1997:
-
-
1998:
-
-
1999:
-
-
2000: -
-
2002:
-
-
2004:
-
-
2006:
3.68 (22nd)
10% (25th)
2008:
Satisfaction
Usage
2015 Expected
32%
3.95
5%
Small companies
(<$600M):
55%
3.98
14%
Medium companies
($600M-2B):
47%
3.85
10%
Large companies
($2B+):
35%
3.56
4%
Latin America:
75%
4.24
22%
Asia-Pacific:
37%
3.79
9%
Europe:
38%
3.62
7%
N. America:
44%
3.92
10%
Global:
2014 Satisfaction
2014 Usage
Significantly higher rate than other regions/company size Significantly lower rate
3.86 (13th)
17% (24th)
2010:
-
-
1993:
3.85 (13th)
13% (24th)
2012:
3.92 (8th)
10% (23rd)
2014:
103. Organizational Time Management
“Organizational Time Management: Views time as a scarce resource that must be invested as effectively as
financial resources. By bringing the same discipline to time budgets that they apply to capital budgets,
companies can curb time pressure on executives, lower costs and boost productivity. Related Topics:
Productivity Benchmarking, Time Discipline, Personal Time-Management Dashboards, Talent Management”
-
-
1995:
-
-
1996:
-
-
1997:
-
-
1998:
-
-
1999:
-
-
2000:
-
-
2002:
-
-
2004:
-
-
2006:
-
-
2008:
-
-
2010:
Satisfaction
Usage
2015 Expected
52%
3.85
15%
Small companies
(<$600M):
70%
3.97
24%
Medium companies
($600M-2B):
61%
3.56
24%
Large companies
($2B+):
51%
3.89
14%
Latin America:
84%
4.08
31%
Asia-Pacific:
55%
3.66
17%
Europe:
57%
3.55
22%
N. America:
61%
3.76
21%
Global:
2014 Satisfaction
2014 Usage
Significantly higher rate than other regions/company size Significantly lower rate
-
-
2012:
-
-
1994:
3.76 (20th)
21% (18th)
2014:
-
-
1993: