This document describes a study that uses discrete event simulation (DES) and multi-criteria decision analysis (MCDA) to model and evaluate configurations for a closed-loop maritime transportation system that supplies raw materials to a steel plant. The system transports iron ore from mines to the plant via a fleet of vessels. Ten simulation scenarios that vary fleet size, storage capacities, and iron ore sourcing were evaluated. Key criteria like plant stoppages, costs, and inventory levels were used to score the scenarios. The results aim to help decision makers identify the best configuration for the transportation system.
![Modeling of a Closed-Loop Maritime
Transportation System with Discrete Event
Simulation and Multi-Criteria Decision Analysis
Rodolfo Celestino dos Santos Silva, Thiago Barros Brito, Rui Carlos Botter, Newton Narciso Pereira,
1
Abstract - The present paper approaches the development and
application of a Discrete Event Simulation (DES) model with a
Multiple Criteria Decision Analysis (MCDA) tool for the
simulation and sizing of a closed-loop maritime transportation
system. This system is responsible for the supply of raw
materials, especially iron ore, to a steel plant, and its sizing
involves the analysis of the transportation fleet and of the
storage area for the inputs to the steel making process. This
work characterizes the problem, shows the methodology
employed and highlights the main results achieved by the
simulation. Concomitantly, the choice of the best solution
between the simulation results is made based in the application
of the MCDA methodology. The main conclusion of the study is
that the use of DES combined with MCDA is an efficient way
to help decision-making on complex logistics transportations
systems.
Index Terms: Modeling, Discrete-Event Simulation, Multi-
Criteria, Decision Analysis, Closed-Loop Transportation.
I. INTRODUCTION
Iron ore is an abundant recourse in the Brazilian
economy. A multinational company, owner of iron ore
mines, intends to implement, in the country’s northeast
region - an important strategic location for the company’s
business, a steel making plant, fed by the company’s mines
outputs.
The company has exclusive concession of a maritime
terminal, located very close to the steel plant, through which
it will receive the main inputs (coal and iron ore) and
dispatch the finished goods (steel plates destined to
exportation).
A particularity of this system refers to the fact that the
company’s mines – one located in the Northeast Region
(NE) and the other in the Southeast Region (SE) of Brazil –
produce ores with distinct and complementary physic-
chemical characteristics. It implies in the necessity of the
Manuscript received July 22, 2010.
Rodolfo Celestino Silva is with Department of Naval Engineering of the
University of Sao Paulo (USP) and the CILIP (Innovation Center for
Logistics and Ports Infrastructure); email: rodolfocs.silva@gmail.com
Thiago Barros Brito is with Department of Logistic Systems of the USP
and the CILIP; email: tbbrito@gmail.com
Rui Carlos Botter is with Department of Naval Engineering of the USP and
the CILIP; email: rcbotter@usp.br
Newton Narciso Pereira is with Department of Naval Engineering of the
USP and the CILIP; newtonnaval@gmail.com
Department of Naval Engineering of USP - Av. Professor Mello Moraes,
2231 - Cidade Universitária São Paulo - SP - Brasil - CEP 05508-030;
CILIP - belonging to the Department of Naval and Oceanic Engineering at
USP, objective’s is to create an excellent center for research and education
in port logistics and infra-structure, on a collaborative environment with the
industry and the public sector. It is composed of several teachers and
researchers in the logistics, transportation and port infra-structure areas.
plant supply being done with both types of iron ore.
According to technical considerations, the proportion of the
iron ore originated from the SE Region is supposed to vary
between 30% and 40%.
The company will manage only one fleet of vessels to
transport both types of iron ore, operating in closed-loop
circuits. Also, a single storage area is supposed to be shared
between the different types of iron ore materials. Both
resources (fleet and storage area) should be able to provide
an uninterrupted and constant operation of the plant.
Thus, this paper presents a DES model built to simulate
several possible configurations in the fleet and stocks sizing
process. It also introduces a MCDA model developed for the
analysis and choice of the best simulated alternative, which
embodies the selected decision criteria,
The methodology employed in the development of the
study and the built models, along with their applications are
described below.
II. METHODOLOGY
The aim of the present work is to develop a hybrid
methodology, combining the techniques of DES Modeling
and MCDA, able to help decision-makers taking decisions
that best fit their needs based on their general understanding
of complex logistics problems.
The problem proposed in this work – a closed-loop
transportation system - is naturally complex, composed of
several elements interacting among themselves
simultaneously, influencing each other in a complex
relationship network, often under conditions that involve
randomness, and requires the observation and evaluation of
numerous decision criteria, being leaded by multiple goals
(often intangible and even antagonistic) and commonly
running in long time horizons, where the risks and
uncertainties are salient elements, the technique of MCDA is
a strong ally in the decision making process.
The MCDA is a structured technique for dealing with
problems with multiple and complex criteria influencing
decision making, since it allows the visualization of the
rational-logical structure of the problem by representing and
quantifying the importance of its elements, relating them to
an overall goal [1].
Under the same circumstances, DES has been efficiently
applied for evaluation of complex systems. Capable of
replicating the behavior of any real system very closely,
DES provides the decision maker with valuable information
about the system behavior and how it can be modified [2].
In the development of the simulation model, the
methodology applied was based on the steps proposed by [3]
and later modified by [4] and [5]:
Proceedings of the World Congress on Engineering and Computer Science 2011 Vol II
WCECS 2011, October 19-21, 2011, San Francisco, USA
ISBN: 978-988-19251-7-6
ISSN: 2078-0958 (Print); ISSN: 2078-0966 (Online)
WCECS 2011](https://image.slidesharecdn.com/13d2f7ff-0ef7-45a0-afe5-d560e93c6315-161103003451/85/2011-WCECS2011-1-320.jpg)
![Modeling of a Closed-Loop Maritime
Transportation System with Discrete Event
Simulation and Multi-Criteria Decision Analysis
Rodolfo Celestino dos Santos Silva, Thiago Barros Brito, Rui Carlos Botter, Newton Narciso Pereira,
1
Abstract - The present paper approaches the development and
application of a Discrete Event Simulation (DES) model with a
Multiple Criteria Decision Analysis (MCDA) tool for the
simulation and sizing of a closed-loop maritime transportation
system. This system is responsible for the supply of raw
materials, especially iron ore, to a steel plant, and its sizing
involves the analysis of the transportation fleet and of the
storage area for the inputs to the steel making process. This
work characterizes the problem, shows the methodology
employed and highlights the main results achieved by the
simulation. Concomitantly, the choice of the best solution
between the simulation results is made based in the application
of the MCDA methodology. The main conclusion of the study is
that the use of DES combined with MCDA is an efficient way
to help decision-making on complex logistics transportations
systems.
Index Terms: Modeling, Discrete-Event Simulation, Multi-
Criteria, Decision Analysis, Closed-Loop Transportation.
I. INTRODUCTION
Iron ore is an abundant recourse in the Brazilian
economy. A multinational company, owner of iron ore
mines, intends to implement, in the country’s northeast
region - an important strategic location for the company’s
business, a steel making plant, fed by the company’s mines
outputs.
The company has exclusive concession of a maritime
terminal, located very close to the steel plant, through which
it will receive the main inputs (coal and iron ore) and
dispatch the finished goods (steel plates destined to
exportation).
A particularity of this system refers to the fact that the
company’s mines – one located in the Northeast Region
(NE) and the other in the Southeast Region (SE) of Brazil –
produce ores with distinct and complementary physic-
chemical characteristics. It implies in the necessity of the
Manuscript received July 22, 2010.
Rodolfo Celestino Silva is with Department of Naval Engineering of the
University of Sao Paulo (USP) and the CILIP (Innovation Center for
Logistics and Ports Infrastructure); email: rodolfocs.silva@gmail.com
Thiago Barros Brito is with Department of Logistic Systems of the USP
and the CILIP; email: tbbrito@gmail.com
Rui Carlos Botter is with Department of Naval Engineering of the USP and
the CILIP; email: rcbotter@usp.br
Newton Narciso Pereira is with Department of Naval Engineering of the
USP and the CILIP; newtonnaval@gmail.com
Department of Naval Engineering of USP - Av. Professor Mello Moraes,
2231 - Cidade Universitária São Paulo - SP - Brasil - CEP 05508-030;
CILIP - belonging to the Department of Naval and Oceanic Engineering at
USP, objective’s is to create an excellent center for research and education
in port logistics and infra-structure, on a collaborative environment with the
industry and the public sector. It is composed of several teachers and
researchers in the logistics, transportation and port infra-structure areas.
plant supply being done with both types of iron ore.
According to technical considerations, the proportion of the
iron ore originated from the SE Region is supposed to vary
between 30% and 40%.
The company will manage only one fleet of vessels to
transport both types of iron ore, operating in closed-loop
circuits. Also, a single storage area is supposed to be shared
between the different types of iron ore materials. Both
resources (fleet and storage area) should be able to provide
an uninterrupted and constant operation of the plant.
Thus, this paper presents a DES model built to simulate
several possible configurations in the fleet and stocks sizing
process. It also introduces a MCDA model developed for the
analysis and choice of the best simulated alternative, which
embodies the selected decision criteria,
The methodology employed in the development of the
study and the built models, along with their applications are
described below.
II. METHODOLOGY
The aim of the present work is to develop a hybrid
methodology, combining the techniques of DES Modeling
and MCDA, able to help decision-makers taking decisions
that best fit their needs based on their general understanding
of complex logistics problems.
The problem proposed in this work – a closed-loop
transportation system - is naturally complex, composed of
several elements interacting among themselves
simultaneously, influencing each other in a complex
relationship network, often under conditions that involve
randomness, and requires the observation and evaluation of
numerous decision criteria, being leaded by multiple goals
(often intangible and even antagonistic) and commonly
running in long time horizons, where the risks and
uncertainties are salient elements, the technique of MCDA is
a strong ally in the decision making process.
The MCDA is a structured technique for dealing with
problems with multiple and complex criteria influencing
decision making, since it allows the visualization of the
rational-logical structure of the problem by representing and
quantifying the importance of its elements, relating them to
an overall goal [1].
Under the same circumstances, DES has been efficiently
applied for evaluation of complex systems. Capable of
replicating the behavior of any real system very closely,
DES provides the decision maker with valuable information
about the system behavior and how it can be modified [2].
In the development of the simulation model, the
methodology applied was based on the steps proposed by [3]
and later modified by [4] and [5]:
Proceedings of the World Congress on Engineering and Computer Science 2011 Vol II
WCECS 2011, October 19-21, 2011, San Francisco, USA
ISBN: 978-988-19251-7-6
ISSN: 2078-0958 (Print); ISSN: 2078-0966 (Online)
WCECS 2011](https://image.slidesharecdn.com/13d2f7ff-0ef7-45a0-afe5-d560e93c6315-161103003451/75/2011-WCECS2011-1-2048.jpg)
![a) Problem definition;
b) Project planning;
c) Definition of the system;
d) Formulation of the conceptual model;
e) Preliminary design of the experiment;
f) Input data preparation;
g) Model coding;
h) Verification and validation of the model;
i) Final design of the experiment;
j) Experimentation and sensitivity analysis;
k) Analysis and interpretation of results;
l) Implementation and documentation.
The state of art of MCDA methodology application is
presented by [6]. The work explores the MCDA technical
and practical aspects, and confirms it as an excellent
supporting tool to decision makers in situations of high
complexity decisions. Other factor constantly mentioned is
the long-time horizon analysis and the MCDA capability to
deal with it. Also, the MCDA methodology, when properly
applied, is considered robust, allowing several benchmarks
and sensitivities analysis to be done.
Functionally, the methodology organizes and synthesizes
information, includes measures objectively and considers
value judgments of decision makers ([7], [8]), in an
interactive and iterative process. The value judgments of
decision makers are captured as preference compensation,
creating a common and robust evaluation instrument. In
order to satisfy all chosen criteria, the arguments of all
decision markers will be taken into account when
structuring the decision model, no matter how diverse this
group is.
The 10 major advantages of MCDA, summarized by [1]
are: maintenance of the unity of the problem, complexity
understanding, criteria interdependence relationship
representation, capability of measuring criteria preference,
maintenance of the consistency, synthesis, trade-offs
evaluation, consideration of decision makers value
judgments and consensus reaching.
To model the proposed transportation system, a
methodological basis was sought in literature works dealing
with maritime closed-loop transportation. In the Brazilian
literature, some publications in this context were addressed,
such as [9], which presents a simulation model for the
design of fuel transportation through the Tiete-Paraná
Waterway in a closed-loop system –the work executes a
brief description of the simulation model and performs the
economic analysis of various generated scenarios. [10] also
employs the DES methodology in the development of a
techno-economic model for the design of cargo intermodal
transportation through the Tiete-Paraná Waterway in closed-
loop system. The author also addresses the DES support
capability in the decision making process.
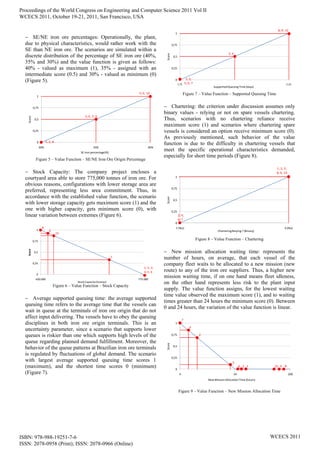
III. INPUT PARAMETERS AND ANALYSIS CRITERIA
All the common input parameters to the DES model are
listed in Table 1 bellow:
Table 1 – Input data common to all scenarios
Parameter Value Unit
Planned Demand 5 mtpy
Vessels Capacity 120,000 tonnes
Travel Time (Plant-NE) 2.7 days
Berthing Time (SE Port) 1.5 days
Travel Time (Plant-NE) 7.9 days
Berthing Time (SE Port) 1.4 days
Berthing Time (Private Port) 3.25 days
However, a number of variables were considered in the
simulation run process:
Company Fleet: number of vessels in the company’s
private fleet;
SE/NE iron ore percentage: the iron ore employed in the
steel making process is originally from either the southeast
(SE) or northeast (NE) regions of Brazil. Due to the
specifics physical and technical characteristics of each iron
ore type, the percentage of SE iron ore may vary from 30 to
40% of the final composition of the steel process output.
Whereas the production department prefers working with
the maximum percentage of SE iron ore, due to its enhanced
physical properties, the procurement and transportation
departments prefer working with the minimum percentage
of SE iron ore (given the largest distance from company
private port to the SE port compared to the NE port);
Stocks Capacities: storage capacities (in tonnes) for each
type of iron ore (SE and NE).
Chartering: this variable determines whether or not
vessels will be chartered during the periods when the vessels
of the company fleet are docked due to maintenance. The
dockage is done every 2 and ½ years, and ships may be
unavailable from 7 to 40 days. Chartering vessels with the
same fleet operational characteristics is particularly difficult,
especially for short time periods.
Thus, with the variation of the proposed variables, it was
possible to create a hall of simulation scenarios, which will
be later evaluated.
IV.SCENARIOS DESCRIPTIONS
Initially, 50 scenarios were built and run with the DES
model, with the variation of the above mentioned
components. From the initial simulated scenarios, 10 viable
scenarios were selected for further evaluation with the
multi-criteria methodology support. These scenarios cover
all the variation range of the input parameters and variables
of the DES model described and their descriptions are listed
in Table 2 .
Proceedings of the World Congress on Engineering and Computer Science 2011 Vol II
WCECS 2011, October 19-21, 2011, San Francisco, USA
ISBN: 978-988-19251-7-6
ISSN: 2078-0958 (Print); ISSN: 2078-0966 (Online)
WCECS 2011](https://image.slidesharecdn.com/13d2f7ff-0ef7-45a0-afe5-d560e93c6315-161103003451/85/2011-WCECS2011-2-320.jpg)
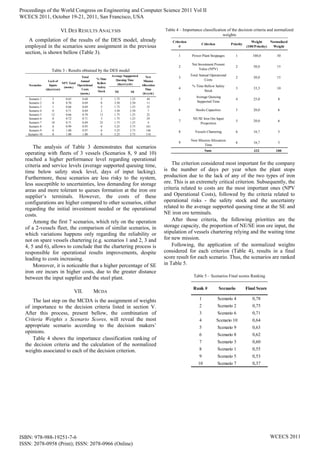
![Analyzing Table 5, one can verify that the scenario with
the highest final score is Scenario 4. Scenarios 2 and 6 final
scores are, however, close to Scenario 4 final score.
Scenario 2 differs from scenario 4 only by a smaller
proportion of SE iron ore, while scenario 6 employs a higher
proportion of SE iron ore than scenario 4. However,
scenario 6 supports less queuing time than scenarios 4 and 2.
Scenario 10 is ranked fourth, virtually tied with
Scenarios 9, 8 and 3. Scenario 3 is very similar to Scenario
4, but with no vessels chartering and lower average
supported queuing time. The difference between Scenarios
10, 9 and 8, which are scenarios with a dedicated 3-vessels
fleet operation, is the proportion of SE iron ore employed in
the steel making process: 40, 35 and 30% respectively.
Given the proximity of the final scores of the 3 best
ranked scenarios (Scenarios 4, 2 and 6), a reasonable
configuration is supposed to be chosen between them. The 3
scenarios are composed by fleets of 2 vessels – what
comprehends to a very close NPV value and annual total
operational costs, have the same total storage capacity
(775,000 tonnes), rely on chartering of vessels during the
fleet docking periods and their steel making process is
subject to no interruption. Therefore, the final pick between
these 3 scenarios will be based on the average supported
queuing time in the supplier’s terminal and the SE iron ore
percentage.
Scenario 2, second final score overall place, is the
scenario with lowest SE iron ore percentage (30%) while
scenario 6, third final score overall place is the scenario with
highest SE proportion (40%). However, scenario 6 supports
only 50% of the average queuing time of scenarios 2 and 4
(1.75 days versus 3.5 days).
The final recommendation is for the pick of the first final
score overall place, Scenario 4, basically because its high
average queuing time supported compared to Scenarios 2
and 6, and its intermediate percentage of SE iron ore
employment in the steel process.
VIII. CONCLUSIONS AND RECOMMENDATIONS
During the present study, the developed tool, employing
the DES and MCDA combined methodology, was proved to
be effective as a complex logistic problem decision-making
support. Besides, the analysis developed tool (DES +
MCDA), with some minor modifications, can be applied to
other similar logistics systems evaluations. Furthermore, it
was possible to base the selection of alternatives in a set of
quantitative criteria, process usually neglected in a
conventional DES analysis - the DES analysis usually
classifies the evaluated scenarios as viable or unviable, and
the choice is usually based on a single and “obvious”
decision criteria (i.e.: lower total cost, higher profit margin,
etc.). Thus, the use of a multi-criteria model emerges as an
effective option for the complementation of a DES model.
Based on the methodology applied in this study, it can be
concluded that, given the model assumptions, the decision
criteria analysis and weights evaluations, the system will
perform “more adequately” according to scenario 4
configuration (2-vessels company fleet, 65% of NE and 35%
of SE iron ore supply origin and storage capacity of
500,000 tons (NE iron ore) and 275,000 (SE iron ore)),
guaranteeing no interruption on the steel making process
and only 2% of the plant operational time bellow the input
safety stock level. Furthermore, the system is supposed to
rely on the chartering for temporary replacement of the
company fleet vessels during the docking periods. The
expected average queuing supported time in this scenario is
about 3.5 and 2.5 days in the NE and SE iron ore origin
terminals, respectively.
The analysis of storage capacities were based on the
availability of the company areas and the existing equipment
in the site. The possibility of studying other areas and
storage equipment acquisition (increasing the storage
capacity or reducing the store area demanded) is a possible
recommendation for further works.
Other additional recommendation is the possibility of a
sensitivity analysis of the decision criteria weights
realization, in order to test the MCDA model robustness or
just test the model response subjected to others decision-
makers evaluation.
REFERENCES
[1] Saaty. T.L.2001. Decision making for leaders. RWS Publications.
Pittsburgh, 2001.
[2] Sweetser, A. 1999. A comparison of System Dynamics (SD) and
Discrete Event Simulation (DES). 17th International Conference of the
System Dynamics Society, July 20 - 23, 1999, Wellington, New
Zealand.
[3] Pedgen, C.D.; Shannon, R.E. & Sadowski, R.P.1995. Introduction to
simulation using SIMAN, McGraw-Hill. 2ª Edition. New York,.
[4] Botter, R.C.2002. Treatment of data in a discrete events simulation,
Thesis (Associated Professor) – POLI - USP, Department of Naval
and Oceanic Eng., São Paulo.
[5] Brito, T.B. 2008. Modeling and simulation of a conteiner’s regulator
terminal. Graduation Thesis – Escola Politécnica of São Paulo
University, São Paulo
[6] Montibeller, G. e Franco L.A. 2007. Decision and Risk Analysis for the
evaluation of strategic options. In: O’Brien, F.A., Dyson, R.G. (Eds.),
Supporting Strategy: Frameworks, Methods and Models. Wiley,
Chichester, p. 251-284.
[7] Prado, A.A.A., Souza, K. Yoshizaki, H. 2009. Transportation Suppliers
Selection using Multi-Criteria Decision Analysis Methodology.
Proceeding of the XXIII Congress of the National Association on
Research and Education on Transport p. 194. November 9-13, 2009,
Vitória,
[8] Montibeller, G. e Franco L.A. 2008. – Multi-criteria Decision Analysis
for Strategic Decision Making.
[9] Botter, R. C. Brinati, M. A. Roque, J. R. R. 1988. Sizing of a integrated
system of transportation of alcohol and diesel oil in the region of
influence of the Tiete-Parana waterway. In: XII National Congress of
Maritime Transports and Naval Construction, Rio de Janeiro. p. 13-44.
[10] Mendes, A.B. 1999. Economic-Operational Model for the sizing of
intermodal transportation of load by the Tiete-Parana waterway ,
Dissertation (Master’s Degree) – POLI - USP, Department. of Naval
and Oceanic Eng., São Paulo, 212p.
Proceedings of the World Congress on Engineering and Computer Science 2011 Vol II
WCECS 2011, October 19-21, 2011, San Francisco, USA
ISBN: 978-988-19251-7-6
ISSN: 2078-0958 (Print); ISSN: 2078-0966 (Online)
WCECS 2011](https://image.slidesharecdn.com/13d2f7ff-0ef7-45a0-afe5-d560e93c6315-161103003451/85/2011-WCECS2011-6-320.jpg)