Osservatorio introduzione all'investimento immobiliare in ungheria 2016Economia.hu
Una panoramica aggiornata e redatta dall'"Osservatorio Immobiliare Ungheria" di ITL Real Estate. Completa di dati macroeconomici e fiscali, la presentazione valuta la situazione del mercato degli investimenti del mercato residenziale e Commerciale con riferimento all'Ungheria. Il rapporto fornisce inoltre informazioni generali sull'investimento per i cittadini europei e prende in esame gli aspetti fiscali dell'investimento sul territorio ungherese.
Presentation of Hexoskin Validation for KHealth's Dementia Project
The paper is available at: http://www.knoesis.org/library/resource.php?id=2155
Citation for the paper: T. Banerjee, P. Anantharam, W. L. Romine, L. Lawhorne, A. Sheth, 'Evaluating a Potential Commercial Tool for Healthcare Application for People with Dementia' in Proc. of the Intl Conf on Health Informatics and Medical Systems (HIMS), Las Vegas, July 27-30, 2015.
SIRIKT Keynote: Learning Analytics: The good, the bad, or perhaps ugly?
The presentation will be the introduction of learning analytics, setting it in the context of big data and the increasing role of technology in learning, emphasising the role of analytics for supporting learning. Some examples will be given, and the points will be highlighted where we have the best evidence for learning analytics being helpful. The presentation will end with some suggestions – some practical, some conceptual – for how researchers and practitioners could move forward.
Dr. Bart Carlo Rienties is Reader in Learning Analytics at the Institute of Educational Technology at the Open University UK. He is programme director Learning Analytics within IET and Chair of Student Experience Project Intervention and Evaluation group, which focusses on evidence-based research on intervention of 15 modules to enhance student experience. As educational psychologist, he conducts multi-disciplinary research on work-based and collaborative learning environments and focuses on the role of social interaction in learning, which is published in leading academic journals and books. His primary research interests are focussed on Learning Analytics, Computer-Supported Collaborative Learning, and the role of motivation in learning. Furthermore, Bart is interested in broader internationalisation aspects of higher education. He successfully led a range of institutional/national/European projects and received several awards for his educational innovation projects.
The current US population of those 65 years and older is over 40 million today, and the federal Census Bureau predicts that will more than double, to nearly 87 million, by midcentury. There are many individuals who are concerned about and/or are trying to remain in their homes, a class that is being called Aging in Place.
This product idea grew out of discussions with many people about the concern of their parents or relatives growing older and insisting on living alone in the family home – the Aging in Place population. One of the major concerns in this situation is that an individual has a medical episode, a fall or some other physical problem that will not be discovered for some period of time, which would turn the episode from a minor incident into a major problem.
This is where the idea for ‘eCompanion’ was born. With the currently available technology in sensors for movement / position recognition, wireless interconnectivity and mobile devices, a solution is possible where an individual can be monitored and anomalies detected that can trigger contacting a monitoring service without the need of either a 24 visitation service or pushing a button.
With 3axis accelerators monitored in a worn band, a database of the individual's typical movements will be used to provide input for lapses in movement or movements out of normal pattern. A database with adaptive learning capability will be used to input and to determine the typical movement patterns of the monitored individual and convert this into useful information about their daily activities. When the system detects a break in the normal pattern it can automatically trigger an alert sequence.
In this webinar, Sageaworks presents some of the methodologies that institutions are most likely to use with CRE or commercial real estate pools under the CECL model. The recording is accessible here: http://web.sageworks.com/cecl-methodology-webinar-series/
A case study utilizing the Six Sigma data analysis toolkit to examine a 15.5-mile daily morning commute completed on bicycle. The case first explores the usage of control charts to examine the total completion time in addition to various waypoints along the route. It then utilizes hypothesis testing to attempt to prove if a statistically significant improvement has occurred. It then demonstrates a multifactor regression model to predict the time needed to traverse the route. Finally it does a cost comparison between cycling, taking the metro and driving to work.
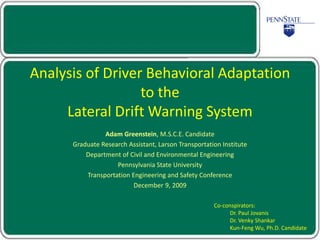
1. Analysis of Driver Behavioral Adaptation
to the
Lateral Drift Warning System
Adam Greenstein, M.S.C.E. Candidate
Graduate Research Assistant, Larson Transportation Institute
Department of Civil and Environmental Engineering
Pennsylvania State University
Transportation Engineering and Safety Conference
December 9, 2009
Co-conspirators:
Dr. Paul Jovanis
Dr. Venky Shankar
Kun-Feng Wu, Ph.D. Candidate
2. Definitions and
Preliminary Discussion
• Lateral Drift Warning (LDW)
– Exceed threshold of distance b/w vehicle and lane
centerlines
• Adaptation
– Changes in alert frequency over time
• Important Findings
– Drivers adapt to LDW alerts by decreasing alert
frequency over time
– Males have more substantial decreases than females
– Drivers who need more excitement while driving have
more overall alerts and cannot maintain a decrease in
frequency over time
3. Outline
• Introduction
• Data Description
• Hypotheses
• Analyses
• Major Findings, Conclusions
• General ITS and Safety Implications
• Data Limitations, Future Research
4. Introduction
• Technology – make tasks easier
– Adapt behavior
• Implement ITS technology in vehicles – improve
driving experience
– Often for safety
• Limited research with in-vehicle ITS devices
• Continued need to understand adaptation to
technology
• New device → must be tested
5. Data Description
• UMTRI RDCW-FOT (2004)
• 87 drivers
• 4 weeks each
– 1st week – system disabled (pseudo-alerts)
– Weeks 2-4 – LDW alerts provided
• Visual, auditory, haptic
• Looking for changes in alert freq. between weeks
• DAS – roadway and environment information,
vehicle kinematics and status (10Hz)
6. Driver Information and
Test-Related Questionnaires
• Gender
• Smoking Habits
• Questions related to crash predisposition
– Sensation-seeking desires
– Risk perception
7. Modeling Approach - Hypotheses
• 3 possible responses
– 1 - Rely on system – more risky behavior
– 2 – Learn from dangerous situations – drive more carefully
– 3 - Annoyed by alerts – try to reduce alert likelihood
– (2) and (3) should have same outcome – reduce freq.
• Hypotheses
– Alert frequency increases with distance traveled
– Alert frequency decreases by week in study
– Driver descriptors influence adaptation
8. Count Models
(Count Model)
(Negative Binomial Distribution)
(Washington et al., 2003)
• Aggregate count models
– Counts of alerts per week as a function of distance
traveled per week, week in the study, driver attributes
• Segmented count models
– By attributes and/or predispositions
– Examine trend differences between driver groups
9. Count of Alerts Based on
Distance Traveled (by week) – All Drivers
10. Aggregate Model – All Drivers
Variable Coef. SE z P>z
Weekly distance in miles 0.0026 0.0002 14.6 <0.001
Week 2 -0.2703 0.0833 -3.24 0.001
Week 3 -0.3561 0.0872 -4.08 <0.001
Week 4 -0.3869 0.1014 -3.82 <0.001
Constant 0.6963 0.1419 4.91 <0.001
Number of drivers = 71
11. Count of Alerts Based on
Distance Traveled (by week) - Gender
12. Segmented Model Pair – Gender
Males Females
Variable Coef. SE z P>z Coef. SE z P>z
Weekly dist. in mi. 0.0023 0.0003 8.92 <0.001 0.0030 0.0003 11.39 <0.001
Week 2 -0.3569 0.1239 -2.88 0.004 -0.1087 0.1129 -0.96 0.336
Week 3 -0.4551 0.1323 -3.44 0.001 -0.2143 0.1130 -1.9 0.058
Week 4 -0.5655 0.1605 -3.52 <0.001 -0.1955 0.1274 -1.53 0.125
Constant 0.6392 0.1944 3.29 0.001 0.7736 0.2120 3.65 <0.001
Number of males = 34 Number of females = 37
13. Count of Alerts Based on Distance Traveled
(by week) - Sensation-Seeking Desires
14. Segmented Model Pair –
Sensation-Seeking Desires
Low Sensation-Seeking Desires High Sensation-Seeking Desires
Variable Coef. SE z P>z Coef. SE z P>z
Weekly dist.
in mi.
0.0026 0.0002 11.77 <0.001 0.0025 0.0003 8.72 <0.001
Week 2 -0.2036 0.1167 -1.74 0.081 -0.3563 0.1183 -3.01 0.003
Week 3 -0.2857 0.1240 -2.3 0.021 -0.4403 0.1204 -3.66 <0.001
Week 4 -0.3485 0.1429 -2.44 0.015 -0.4317 0.1429 -3.02 0.003
Constant 0.5022 0.1878 2.67 0.007 0.9701 0.2204 4.4 <0.001
Drivers in “low” group = 40 Divers in “high” group = 31
15. Major Findings and Conclusions
• General result: decrease alert freq. over time
when controlling for distance traveled
– Supports 1st hypothesis
• Trends vary between driver groups (attributes
and predispositions)
– Supports 2nd hypothesis
• System does improve safety related to ROR crash
risk
16. ITS and Safety Implications
• In-vehicle vs. infrastructure-based ITS technologies
– Both can improve safety but in different ways
• Implement based on driver differences
– Distributions within population
• Issues with Data
– Accounting for technological skill
– Sample size issues
– Random sampling of drivers
17. Acknowledgements
• Strategic Highway Research Program
– SHRP2 S-01: Development of Analysis Methods Using
Recent Data
• UMTRI staff supplied data
www.trb.org/SHRP2 www.umtri.umich.edu