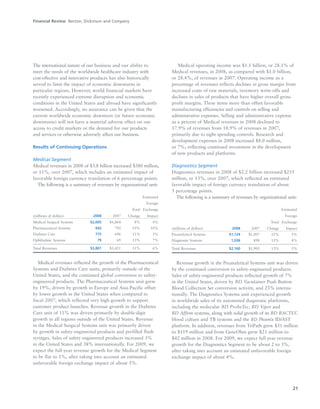
BD is a leading global medical technology company that reported strong financial and operational results in its 2008 Annual Report. Revenues increased 12.5% to $7.15 billion and income from continuing operations increased 31.7% to $1.12 billion. BD invested in innovation and growth initiatives while returning over $700 million to shareholders in share repurchases and dividends. The company aims to improve global health through initiatives that reduce infection, advance therapy and disease management. In 2008, BD associates volunteered in Ghana and Uganda to strengthen healthcare systems and laboratory services.