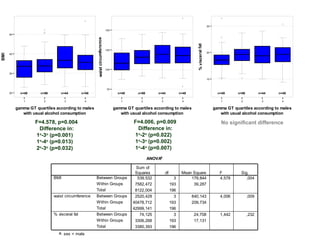
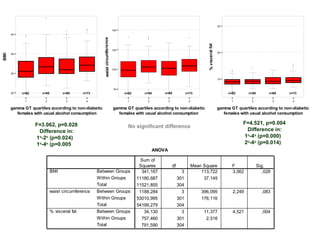
RELATIONSHIP OF
 BODY WEIGHT & ITS DISTRIBUTION
     WITH gamma-GT LEVELS,
   IN OVERWEIGHT AND OBESE
            PERSONS

          Kapantais E, Chala E.
Department of Diabetes-Obesity-Metabolism
          Metropolitan Hospital
           Neo Faliro, Athens
                 Greece.
INTRODUCTION

         Body fat and its distribution
    have been linked to insulin resistance.
  Epidemiological studies have also related
gamma-GT levels to insulin resistance and body
                  weight.
AIM

Of the study was to reveal any trend between
    gamma-GT levels and body weight
   among the overweight-obese persons .
SUBJECTS-METHODS

220 males and 384 females attending
the Diabetes - Obesity - Metabolism Department
in order to lose weight, were studied retrospectively.

Fasting glucose, HbA1c, Insulin, SGOT, SGPT, ALP, gamma-GT
and ferritin levels were measured.

Subjects with overt liver dysfunction were excluded.

Anthropometric measurements were performed,
including weight & height for calculation of Body Mass Index,
Waist Circumference, % Total Body Fat (BIA method),
Sagittal Abdominal Diameter for calculation of Visceral Fat
(% Visceral Fat= Visceral Fat x 100 / Total Fat).
SUBJECTS-METHODS
Alcohol consumption (g/week) was estimated
and subjects were classified as having “Usual”
and “More than Usual” Alcohol Consumption
(UAC and MUAC respectively) with the cutoff
point of 150g/week for males and 100g/week
for females.

All subjects were reported as moderate coffee
consumers (up to 1-3 cups of coffee daily).

Subjects were also classified as “non-diabetic”
and “diabetic” considering HbA1c (cutoff point:
6.4) and fasting glucose levels (cutoff point: 125).
SUBJECTS
                                 Males      Females
                                 (220)        (384)
Age (years)                45.9±13.8     42.2 ±13.6

BMI (Kg/m2)                 35.1 ±6.3    34.25 ±6.24

Waist Circumference (cm)   115.6 ±14.6   104.0 ±13.6

% Visceral Fat              18.8 ±4.2     9.4 ±1.7
RESULTS                                                                                 
                                                

                                                                                                                                                          30
                                                                             150                                                                                               
                                               
      50
                                                                                                                                                                       


                                                        waist circumference


                                                                                                                                         % visceral fat
                                                                              125
      40                                                                                                                                                  20
BMI


                                                                              100
      30

                                                                                                                                                                               
                                                                                                                                                          10

                                                                                                                           
                                                                               75
                                                
      20     n=61     n=52         n=53       n=54                                    n=61        n=52      n=53         n=54                                     n=61        n=52   n=53     n=54

              1         2           3          4                                       1            2            3        4                                            1        2      3        4

           gamma GT quartiles according to males                                    gamma GT quartiles according to males                                       gamma GT quartiles according to males

                    F=4.501, p=0.004                                                           F=3.341, p=0.020                                                            F=2.689, p=0.047
                     Difference in:                                                             Difference in:                                                              Difference in:
                    1o-3o (p=0.000)                                                            1o-3o (p=0.003)                                                             1o-2o (p=0.012)
                    1o-4o (p=0.027)                                                            1o-4o (p=0.028)                                                             1o-3o (p=0.041)
                                                                                                                                                                           1o-4o (p=0.033)
                    2o-3o (p=0.049)
                                                                                                   ANOVAa

                                                                                               Sum of
                                                                                              Squares       df         Mean Square                             F           Sig.
                             BMI                     Between Groups                            516,105             3       172,035                             4,501          ,004
                                                     Within Groups                            8256,364           216        38,224
                                                     Total                                    8772,469           219
                             waist circumference     Between Groups                           2081,563             3           693,854                         3,341         ,020
                                                     Within Groups                           44861,115           216           207,690
                                                     Total                                   46942,678           219
                             % visceral fat          Between Groups                            140,156             3            46,719                         2,689         ,047
                                                     Within Groups                            3753,268           216            17,376
                                                     Total                                    3893,423           219
                               a. sex = male
                               
                                                
                                                                                                                                                                                        
                                                                                                                                                 30
                                                                          150
                        
      50
                                                                                                                                                         


                                                     waist circumference


                                                                                                                                % visceral fat
                                                                           125
                                                                                                                                                 20
      40
BMI


                                                                           100
      30

                                                                                                                                                                  
                                                                                                                                                 10

                                                                                                                         
                                                                           75
                                                
      20     n=49     n=56       n=44         n=48                                 n=49     n=56       n=44            n=48                             n=49     n=56          n=44   n=48

              1         2          3           4                                    1         2         3               4                                1         2            3      4

           gamma GT quartiles according to males                                 gamma GT quartiles according to males                                gamma GT quartiles according to males
              with usual alcohol consumption                                        with usual alcohol consumption                                       with usual alcohol consumption

                    F=4.578, p=0.004                                                      F=4.006, p=0.009                                               No significant difference
                     Difference in:                                                        Difference in:
                    1o-3o (p=0.001)                                                       1o-2o (p=0.022)
                    1o-4o (p=0.013)                                                       1o-3o (p=0.002)
                    2o-3o (p=0.032)                                                       1o-4o (p=0.007)
                                                                                                   ANOVAa

                                                                                            Sum of
                                                                                           Squares          df          Mean Square                      F         Sig.
                             BMI                     Between Groups                         539,532                3        179,844                      4,578        ,004
                                                     Within Groups                         7582,472              193         39,287
                                                     Total                                 8122,004              196
                             waist circumference     Between Groups                        2520,429                3          840,143                    4,006          ,009
                                                     Within Groups                        40478,712              193          209,734
                                                     Total                                42999,141              196
                             % visceral fat          Between Groups                          74,125                3           24,708                    1,442          ,232
                                                     Within Groups                         3306,268              193           17,131
                                                     Total                                 3380,393              196
                               a. sex = male
30
                                                                             150
                                                                                               
      50


                                                       waist circumference
                                              
                                                                                                                                                                   
                                                                                                                                                         
                                                                                                                                                         


                                                                                                                                 % visceral fat
                                                                             125
                                                                                                                                                  20
      40
BMI


                                                                             100                                                                                     
                                                                                                                                                                     
      30                                                                                                                                                             
                                                                                                                                                         
                                                                                                                                                  10

                                                                                                                       
                                                                             75
                                              
      20   n=29      n=33         n=26      n=29                                   n=29       n=33      n=26         n=29                              n=29        n=33          n=26   n=29

             1        2            3         4                                      1           2        3            4                                  1          2             3      4

      gamma GT quartiles according to non-diabetic                           gamma GT quartiles according to non-diabetic                         gamma GT quartiles according to non-diabetic
         males with usual alcohol consumption                                   males with usual alcohol consumption                                 males with usual alcohol consumption

                  F=3.410, p=0.020                                                         F=3.890, p=0.010                                                  No significant difference
                   Difference in:                                                           Difference in:
                  1o-3o (p=0.002)                                                          1o-2o (p=0.011)
                                                                                           1o-3o (p=0.002)
                                                                                           1o-4o (p=0.049)
                                                                                                ANOVA

                                                                                           Sum of
                                                                                           Squares        df         Mean Square                       F            Sig.
                           BMI                     Between Groups                           293,791              3        97,930                       3,410           ,020
                                                   Within Groups                           3245,313            113        28,720
                                                   Total                                   3539,104            116
                           waist circumference     Between Groups                          1872,826              3          624,275                    3,890              ,011
                                                   Within Groups                          18135,623            113          160,492
                                                   Total                                  20008,449            116
                           % visceral fat          Between Groups                            51,678              3           17,226                    1,224              ,304
                                                   Within Groups                           1590,493            113           14,075
                                                   Total                                   1642,171            116


                                                  
                                                                                                                                                            30
                                                                                                                            
                                     
                                                                               150
      50                           
                                     
                                                                                                       


                                                          waist circumference
                                                                                                       
                                                                                                       


                                                                                                                                           % visceral fat
                                                                                125
      40                                                                                                                                                    20
BMI


                                                                                                                                                                                                   
                                                                                                                                                                                                  
                                                                                                                                                                                                   
                                                                                                                                                                                 
                                                                                100                                                                                  
      30

                                                                                                                                                            10


                                                                                 75                    
                                                                                                                                                                     
      20     n=115      n=77     n=98           n=94                                    n=115        n=77      n=98        n=94                                    n=115
                                                                                                                                                                     
                                                                                                                                                                              n=77    n=98      n=94

               1         2           3           4                                        1            2            3        4                                       1           2       3        4

           gamma GT quartiles according to females                                    gamma GT quartiles according to females                                    gamma GT quartiles according to females

                     F=3.653, p=0.013                                                            F=3.834, p=0.010                                                          F=7.337, p=0.000
                      Difference in:                                                              Difference in:                                                            Difference in:
                     1o-3o (p=0.042)                                                             1o-4o (p=0.001)                                                           1o-3o (p=0.038)
                     1o-4o (p=0.001)                                                                                                                                       1o-4o (p=0.000)
                                                                                                                                                                           2o-4o (p=0.001)
                                                                                                                                                                           3o-4o (p=0.017)

                                                                                                      ANOVAa

                                                                                                 Sum of
                                                                                                 Squares       df         Mean Square                       F              Sig.
                               BMI                     Between Groups                             417,400             3       139,133                       3,653             ,013
                                                       Within Groups                            14473,653           380        38,089
                                                       Total                                    14891,053           383
                               waist circumference     Between Groups                            2101,279             3          700,426                     3,834           ,010
                                                       Within Groups                            69425,919           380          182,700
                                                       Total                                    71527,198           383
                               % visceral fat          Between Groups                              57,651             3           19,217                     7,337           ,000
                                                       Within Groups                              995,291           380            2,619
                                                       Total                                     1052,941           383
                                 a. sex = female


                                                 
                                                                                                                                                    30
                                                                                                                           
                                   
                                                                            150
      50                          
                                   
                                                                                                  


                                                       waist circumference
                                                                                                  
                                                                                                  


                                                                                                                                   % visceral fat
                                                                             125
                                                                                                                                                    20
      40
BMI


                                                                                                                                                                                             
                                                                                                                                                                                             
                                                                                                                                                                                            
                                                                                                                                                                        
                                                                             100                                                                             
      30

                                                                                                                                                    10


                                                                             75
                                                                                                                                                             
      20     n=109      n=76     n=93        n=91                                    n=109      n=76       n=93           n=91                             n=109
                                                                                                                                                             
                                                                                                                                                                     n=76          n=93   n=91

               1         2         3             4                                     1          2            3           4                                 1         2             3      4

           gamma GT quartiles according to females                                 gamma GT quartiles according to females                               gamma GT quartiles according to females
              with usual alcohol consumption                                          with usual alcohol consumption                                        with usual alcohol consumption

                                                                                                                                                                   F=7.033, p=0.000
                     F=2.742, p=0.043                                                        F=2.705, p=0.045
                                                                                                                                                                    Difference in:
                      Difference in:                                                          Difference in:
                                                                                                                                                                   1o-4o (p=0.000)
                     1o-4o (p=0.005)                                                         1o-4o (p=0.005)
                                                                                                                                                                   2o-4o (p=0.001)
                                                                                                                                                                   3o-4o (p=0.007)
                                                                                                      ANOVAa

                                                                                               Sum of
                                                                                              Squares          df         Mean Square                        F          Sig.
                                BMI                   Between Groups                           316,126                3       105,375                        2,742         ,043
                                                      Within Groups                          14025,080              365        38,425
                                                      Total                                  14341,205              368
                                waist circumference   Between Groups                          1495,658                3          498,553                     2,705           ,045
                                                      Within Groups                          67281,221              365          184,332
                                                      Total                                  68776,880              368
                                % visceral fat        Between Groups                            54,569                3           18,190                     7,033           ,000
                                                      Within Groups                            944,061              365            2,586
                                                      Total                                    998,631              368
                                  a. sex = female



                                                                                                                                                        30
                                               
                                                                            150
                                    
                                               
      50                           
                                    
             
                                                                                                                          


                                                       waist circumference
                                                                                               
                                                                                               


                                                                                                                                       % visceral fat
                                                                             125
                                                                                                                                                        20
      40
BMI


                                                                                                                                                                                              
                                                                                                                                                                                              
                                                                                                                                                                                             
                                                                             100                                                                               
                                                                                                                                                               
      30

                                                                                                                                                        10


                                                                             75                
                                                                                                                                                               
      20   n=82      n=85         n=65       n=73                                  n=82      n=85      n=65               n=73                               n=82
                                                                                                                                                               
                                                                                                                                                                      n=85         n=65    n=73

             1        2             3         4                                     1         2            3               4                                   1        2               3    4

      gamma GT quartiles according to non-diabetic                           gamma GT quartiles according to non-diabetic                               gamma GT quartiles according to non-diabetic
         females with usual alcohol consumption                                females with usual alcohol consumption                                      females with usual alcohol consumption

                  F=3.062, p=0.028                                                                                                                                  F=4.521, p=0.004
                                                                                     No significant difference
                   Difference in:                                                                                                                                    Difference in:
                  1o-2o (p=0.024)                                                                                                                                   1o-4o (p=0.000)
                  1o-4o (p=0.005                                                                                                                                    2o-4o (p=0.014)
                                                                                                   ANOVA

                                                                                           Sum of
                                                                                           Squares             df               Mean Square                    F              Sig.
                            BMI                     Between Groups                          341,167                   3             113,722                    3,062             ,028
                                                    Within Groups                         11180,687                 301              37,145
                                                    Total                                 11521,855                 304
                            waist circumference     Between Groups                         1188,284                   3             396,095                    2,249            ,083
                                                    Within Groups                         53010,995                 301             176,116
                                                    Total                                 54199,279                 304
                            % visceral fat          Between Groups                           34,130                   3              11,377                    4,521            ,004
                                                    Within Groups                           757,460                 301               2,516
                                                    Total                                   791,590                 304
CONCLUSIONS

             Gamma-GT levels are related to
             body weight and fat distribution,
            not only in the general population,
   but also among the overweight and obese persons,
                       in both sexes,
              even when excluding persons
with alcohol overconsumption and persons with diabetes.
DISCUSSION
   Although the primary role of hepatic gamma-GT is to
    metabolize extracellular reduced glutathione, recent
studies have indicated that gamma-GT enzyme induction
   may also be closely associated with the generation of
  reactive oxygen species. Enhanced oxidant stress has
  been recently linked with obesity-associated metabolic
syndrome, insulin resistance and generation of fatty liver.
 It is possible that enhanced serum gamma-GT activities
   could be regarded as a sign of generalized metabolic
       induction and activation of the body’s defense
         mechanism against the metabolic burden.
SUGGESTED BIBLIOGRAPHY

Katri Puukka et al. Additive effects of moderate drinking and obesity
on serum gamma-glutamyl transferase activity. Am J Clin Nutr 2006;
83:1351-4


Colicchio P et al. Non-alcoholic fatty liver disease in young adult
severely obese non-diabetic patients in South Italy. Ann Nutr Metab
2005; 49: 289-95


Daeppen JB et al. Influence of age and body mass index on gamma-
glutamyltransferase activity: a 15-year follow up evaluation in a
community sample. Alcohol Clin Exp Res 1998; 22: 941-4

2006 14th ico 2

  • 1.
    RELATIONSHIP OF BODYWEIGHT & ITS DISTRIBUTION WITH gamma-GT LEVELS, IN OVERWEIGHT AND OBESE PERSONS Kapantais E, Chala E. Department of Diabetes-Obesity-Metabolism Metropolitan Hospital Neo Faliro, Athens Greece.
  • 2.
    INTRODUCTION Body fat and its distribution have been linked to insulin resistance. Epidemiological studies have also related gamma-GT levels to insulin resistance and body weight.
  • 3.
    AIM Of the studywas to reveal any trend between gamma-GT levels and body weight among the overweight-obese persons .
  • 4.
    SUBJECTS-METHODS 220 males and384 females attending the Diabetes - Obesity - Metabolism Department in order to lose weight, were studied retrospectively. Fasting glucose, HbA1c, Insulin, SGOT, SGPT, ALP, gamma-GT and ferritin levels were measured. Subjects with overt liver dysfunction were excluded. Anthropometric measurements were performed, including weight & height for calculation of Body Mass Index, Waist Circumference, % Total Body Fat (BIA method), Sagittal Abdominal Diameter for calculation of Visceral Fat (% Visceral Fat= Visceral Fat x 100 / Total Fat).
  • 5.
    SUBJECTS-METHODS Alcohol consumption (g/week)was estimated and subjects were classified as having “Usual” and “More than Usual” Alcohol Consumption (UAC and MUAC respectively) with the cutoff point of 150g/week for males and 100g/week for females. All subjects were reported as moderate coffee consumers (up to 1-3 cups of coffee daily). Subjects were also classified as “non-diabetic” and “diabetic” considering HbA1c (cutoff point: 6.4) and fasting glucose levels (cutoff point: 125).
  • 6.
    SUBJECTS Males Females (220) (384) Age (years) 45.9±13.8 42.2 ±13.6 BMI (Kg/m2) 35.1 ±6.3 34.25 ±6.24 Waist Circumference (cm) 115.6 ±14.6 104.0 ±13.6 % Visceral Fat 18.8 ±4.2 9.4 ±1.7
  • 7.
    RESULTS    30  150    50  waist circumference % visceral fat 125 40 20 BMI 100 30   10  75  20 n=61 n=52 n=53 n=54 n=61 n=52 n=53 n=54 n=61 n=52 n=53 n=54 1 2 3 4 1 2 3 4 1 2 3 4 gamma GT quartiles according to males gamma GT quartiles according to males gamma GT quartiles according to males F=4.501, p=0.004 F=3.341, p=0.020 F=2.689, p=0.047 Difference in: Difference in: Difference in: 1o-3o (p=0.000) 1o-3o (p=0.003) 1o-2o (p=0.012) 1o-4o (p=0.027) 1o-4o (p=0.028) 1o-3o (p=0.041) 1o-4o (p=0.033) 2o-3o (p=0.049) ANOVAa Sum of Squares df Mean Square F Sig. BMI Between Groups 516,105 3 172,035 4,501 ,004 Within Groups 8256,364 216 38,224 Total 8772,469 219 waist circumference Between Groups 2081,563 3 693,854 3,341 ,020 Within Groups 44861,115 216 207,690 Total 46942,678 219 % visceral fat Between Groups 140,156 3 46,719 2,689 ,047 Within Groups 3753,268 216 17,376 Total 3893,423 219 a. sex = male
  • 8.
       30  150  50  waist circumference % visceral fat 125 20 40 BMI 100 30   10  75  20 n=49 n=56 n=44 n=48 n=49 n=56 n=44 n=48 n=49 n=56 n=44 n=48 1 2 3 4 1 2 3 4 1 2 3 4 gamma GT quartiles according to males gamma GT quartiles according to males gamma GT quartiles according to males with usual alcohol consumption with usual alcohol consumption with usual alcohol consumption F=4.578, p=0.004 F=4.006, p=0.009 No significant difference Difference in: Difference in: 1o-3o (p=0.001) 1o-2o (p=0.022) 1o-4o (p=0.013) 1o-3o (p=0.002) 2o-3o (p=0.032) 1o-4o (p=0.007) ANOVAa Sum of Squares df Mean Square F Sig. BMI Between Groups 539,532 3 179,844 4,578 ,004 Within Groups 7582,472 193 39,287 Total 8122,004 196 waist circumference Between Groups 2520,429 3 840,143 4,006 ,009 Within Groups 40478,712 193 209,734 Total 42999,141 196 % visceral fat Between Groups 74,125 3 24,708 1,442 ,232 Within Groups 3306,268 193 17,131 Total 3380,393 196 a. sex = male
  • 9.
    30 150   50 waist circumference       % visceral fat 125 20 40 BMI 100   30   10  75  20 n=29 n=33 n=26 n=29 n=29 n=33 n=26 n=29 n=29 n=33 n=26 n=29 1 2 3 4 1 2 3 4 1 2 3 4 gamma GT quartiles according to non-diabetic gamma GT quartiles according to non-diabetic gamma GT quartiles according to non-diabetic males with usual alcohol consumption males with usual alcohol consumption males with usual alcohol consumption F=3.410, p=0.020 F=3.890, p=0.010 No significant difference Difference in: Difference in: 1o-3o (p=0.002) 1o-2o (p=0.011) 1o-3o (p=0.002) 1o-4o (p=0.049) ANOVA Sum of Squares df Mean Square F Sig. BMI Between Groups 293,791 3 97,930 3,410 ,020 Within Groups 3245,313 113 28,720 Total 3539,104 116 waist circumference Between Groups 1872,826 3 624,275 3,890 ,011 Within Groups 18135,623 113 160,492 Total 20008,449 116 % visceral fat Between Groups 51,678 3 17,226 1,224 ,304 Within Groups 1590,493 113 14,075 Total 1642,171 116
  • 10.
     30     150 50      waist circumference   % visceral fat 125 40 20 BMI      100  30 10 75   20 n=115 n=77 n=98 n=94 n=115 n=77 n=98 n=94 n=115   n=77 n=98 n=94 1 2 3 4 1 2 3 4 1 2 3 4 gamma GT quartiles according to females gamma GT quartiles according to females gamma GT quartiles according to females F=3.653, p=0.013 F=3.834, p=0.010 F=7.337, p=0.000 Difference in: Difference in: Difference in: 1o-3o (p=0.042) 1o-4o (p=0.001) 1o-3o (p=0.038) 1o-4o (p=0.001) 1o-4o (p=0.000) 2o-4o (p=0.001) 3o-4o (p=0.017) ANOVAa Sum of Squares df Mean Square F Sig. BMI Between Groups 417,400 3 139,133 3,653 ,013 Within Groups 14473,653 380 38,089 Total 14891,053 383 waist circumference Between Groups 2101,279 3 700,426 3,834 ,010 Within Groups 69425,919 380 182,700 Total 71527,198 383 % visceral fat Between Groups 57,651 3 19,217 7,337 ,000 Within Groups 995,291 380 2,619 Total 1052,941 383 a. sex = female
  • 11.
     30     150 50     waist circumference   % visceral fat 125 20 40 BMI      100  30 10 75  20 n=109 n=76 n=93 n=91 n=109 n=76 n=93 n=91 n=109   n=76 n=93 n=91 1 2 3 4 1 2 3 4 1 2 3 4 gamma GT quartiles according to females gamma GT quartiles according to females gamma GT quartiles according to females with usual alcohol consumption with usual alcohol consumption with usual alcohol consumption F=7.033, p=0.000 F=2.742, p=0.043 F=2.705, p=0.045 Difference in: Difference in: Difference in: 1o-4o (p=0.000) 1o-4o (p=0.005) 1o-4o (p=0.005) 2o-4o (p=0.001) 3o-4o (p=0.007) ANOVAa Sum of Squares df Mean Square F Sig. BMI Between Groups 316,126 3 105,375 2,742 ,043 Within Groups 14025,080 365 38,425 Total 14341,205 368 waist circumference Between Groups 1495,658 3 498,553 2,705 ,045 Within Groups 67281,221 365 184,332 Total 68776,880 368 % visceral fat Between Groups 54,569 3 18,190 7,033 ,000 Within Groups 944,061 365 2,586 Total 998,631 368 a. sex = female
  • 12.
    30   150   50        waist circumference   % visceral fat 125 20 40 BMI     100   30 10 75   20 n=82 n=85 n=65 n=73 n=82 n=85 n=65 n=73 n=82   n=85 n=65 n=73 1 2 3 4 1 2 3 4 1 2 3 4 gamma GT quartiles according to non-diabetic gamma GT quartiles according to non-diabetic gamma GT quartiles according to non-diabetic females with usual alcohol consumption females with usual alcohol consumption females with usual alcohol consumption F=3.062, p=0.028 F=4.521, p=0.004 No significant difference Difference in: Difference in: 1o-2o (p=0.024) 1o-4o (p=0.000) 1o-4o (p=0.005 2o-4o (p=0.014) ANOVA Sum of Squares df Mean Square F Sig. BMI Between Groups 341,167 3 113,722 3,062 ,028 Within Groups 11180,687 301 37,145 Total 11521,855 304 waist circumference Between Groups 1188,284 3 396,095 2,249 ,083 Within Groups 53010,995 301 176,116 Total 54199,279 304 % visceral fat Between Groups 34,130 3 11,377 4,521 ,004 Within Groups 757,460 301 2,516 Total 791,590 304
  • 13.
    CONCLUSIONS Gamma-GT levels are related to body weight and fat distribution, not only in the general population, but also among the overweight and obese persons, in both sexes, even when excluding persons with alcohol overconsumption and persons with diabetes.
  • 14.
    DISCUSSION Although the primary role of hepatic gamma-GT is to metabolize extracellular reduced glutathione, recent studies have indicated that gamma-GT enzyme induction may also be closely associated with the generation of reactive oxygen species. Enhanced oxidant stress has been recently linked with obesity-associated metabolic syndrome, insulin resistance and generation of fatty liver. It is possible that enhanced serum gamma-GT activities could be regarded as a sign of generalized metabolic induction and activation of the body’s defense mechanism against the metabolic burden.
  • 15.
    SUGGESTED BIBLIOGRAPHY Katri Puukkaet al. Additive effects of moderate drinking and obesity on serum gamma-glutamyl transferase activity. Am J Clin Nutr 2006; 83:1351-4 Colicchio P et al. Non-alcoholic fatty liver disease in young adult severely obese non-diabetic patients in South Italy. Ann Nutr Metab 2005; 49: 289-95 Daeppen JB et al. Influence of age and body mass index on gamma- glutamyltransferase activity: a 15-year follow up evaluation in a community sample. Alcohol Clin Exp Res 1998; 22: 941-4