200 problemas cuadraticos
•Download as DOCX, PDF•
0 likes•114 views
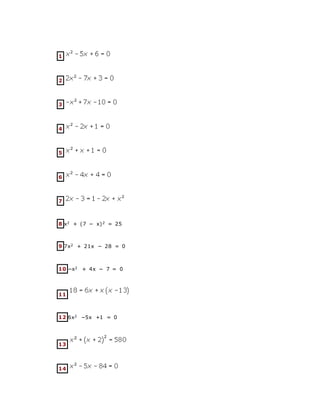
The document contains 4 equations: (1) 8x^2 + (7-x)^2 = 25, (2) 7x^2 + 21x - 28 = 0, (3) -x^2 + 4x - 7 = 0, (4) 6x^2 - 5x + 1 = 0. These appear to be quadratic equations that were being worked on or solved.
Report
Share
Report
Share

Recommended
Rational Inequality Apr 20 09
The document discusses solving rational inequalities by:
1) Placing critical numbers on a number line
2) Solving the inequalities algebraically
3) Graphing the solutions on the number line between the critical numbers
Քառակուսային հավասարումներ
The document contains 144 examples of quadratic equations arranged in 12 sections with 12 examples each. The examples include single variable quadratic equations with real number coefficients that can be solved using techniques like factoring, completing the square, and using the quadratic formula. Overall the document provides a large collection of example problems working with quadratic equations.
Քառակուսային անհավասարումների 100-ից ավել օրինակ
This document contains 144 examples of quadratic inequalities in Armenian. The examples cover a variety of quadratic inequality types including single variable quadratic inequalities, quadratic inequalities with multiple terms, and quadratic inequalities combined with other inequality types.
Լուծենք քառակուսային հավասարումները բանավոր
The document contains 30 sets of 10 quadratic equations each. Each set lists the equations in the format x^2 + bx + c = 0, where b and c are coefficients that vary across the equations.
Nov. 17 Rational Inequalities
The document discusses rational inequalities and absolute value inequalities. It explains how to solve rational inequalities by simplifying the expression, factoring any quadratics, placing critical numbers on a number line, testing points in each interval, and stating the solution intervals. Examples are provided of solving rational inequalities algebraically and graphically. Absolute value inequalities are introduced and it is explained how the graphs of absolute value functions can be used to solve absolute value inequalities both graphically and algebraically. Practice exercises involving various types of inequalities are presented.
Tablas de multiplicar para imprimir
The document lists the multiplication tables for the numbers 2 through 9 multiplied by 1 through 10. It shows each multiplication problem and solution in order to demonstrate the multiplication patterns for those numbers.
Tablas de Multiplicar
Las Tablas de Multiplicar para tenerlas siempre a mano. Se colorean, recortan y plastifican, después se enganchan a un aro.
Listas para estudiarlas......
Tablas
The document shows multiplication tables for numbers 1-10 multiplied by numbers 1-10. For each number from 1-10 in the left column, its multiplication results from 1-10 are listed in the right column showing the multiplication of that number. This follows for numbers 1 through 9 as the left column multiplier.
Tablas multiplicar
The document contains 10 tables showing the multiplication tables for numbers 1 through 10. Each table lists the results of multiplying the number in the title by integers from 0 to 10.
Algebra Lineal. Tarea1
This document provides 10 systems of linear equations and asks to find the solution to each system. It lists the equations for 10 different systems of linear equations, with the unknowns x1, x2 and x3. The task is to solve for the values of the unknowns that satisfy all equations simultaneously in each system.
5 6 slideand_divide_11_19_12
This document provides examples and steps for factoring trinomials using the "slide and divide" method. It demonstrates factoring trinomials of the form ax^2 + bx + c through 4 examples, showing the steps of finding the greatest common factor, "sliding" terms to group like terms, factoring, dividing and simplifying, and "pushing back" the factors. Exercises are assigned from the green algebra book problems 25-39 odds on page 328.
Las tablas de multiplicar
The document presents the multiplication tables from 2 to 11, listing the product of each number from 1 to 12 multiplied by the given number. It provides the full multiplication table for the numbers 2 through 10, and the header for 11 to indicate it would follow the same format.
Day 8 - Rational Inequalities
This document discusses solving rational inequalities by finding the values of x where the numerator and denominator are equal to 0, as these are the points where the rational expression changes signs. It provides examples of solving rational inequalities algebraically and checking the solutions graphically. Students are asked to solve some practice problems finding the values of x that satisfy the given rational inequalities.
แบบทดสอบ ชุดที่ 2 สมการเชิงเส้นตัวแปรเดียว
1) The solution to the equation 2x + 3 = 11 is x = 4.
2) By solving the series of equations, the value of x is found to be 3.
3) Solving the equation 3x - 5 = 8 results in x = 3.
Tablas de multiplicar
The document shows a multiplication table for the numbers 1 through 10 multiplied by x. Each line gives the result of multiplying a number from 1 to 10 by x from 0 to 10. The table is organized with the number being multiplied by x listed first, followed by the result of multiplying that number by each value of x from 0 to 10.
Tablas de multiplicar
The document shows a multiplication table for the numbers 1 through 10 multiplied by the variable x. Each line lists the result of multiplying a number from 1 to 10 by x from 0 to 10. For example, 1x0 = 0, 1x1 = 1, and so on up to 10x10 = 100.
Tabla multiplicar
The document contains two tables showing the multiplication tables from 1 to 10. The first table shows the full multiplication table up to 10x10. The second table is a reduced version only showing the key results for brevity. Both tables are from a Spanish educational website on multiplication tables.
Tablas de multiplicar
The document shows a multiplication table going from 1 to 10 for the numbers 1 through 10. For each number from 1 to 10 in the left column (representing the multiplier), and each number from 0 to 10 in the top row (representing the multiplicand), it shows the result of multiplying those two numbers.
Solving Trinomial Equations
1. The document shows the steps to solve a quadratic equation using algebra tiles.
2. It represents the equation x2 + 5x + 6 = 0 with algebra tiles, grouping like terms to write it as (x + 2)(x + 3) = 0.
3. It then solves for x by finding the two numbers whose product is zero, determining x = -2 or -3.
Tablas de multiplicar
The document contains the multiplication tables from 1 to 9. Each table lists the results of multiplying that number by 0 through 10. For example, the table of 3 shows 3 x 0 = 0, 3 x 1 = 3, and so on up to 3 x 10 = 30.
Aprende las tablas de multiplicar
This document contains tables for multiplication from 1 to 10. Each table lists the multiplication problems and solutions for multiplying a number from 1 to 10 by 0 through 10. There are 10 tables in total, one for each number 1 through 10. The tables are presented side by side for easy reference when learning multiplication facts.
2 statistics -standard deviation may 20
The document provides instructions for calculating the standard deviation from a set of test scores. It defines standard deviation as the square root of the sum of the squared differences between each score and the mean, divided by n-1. It then lists the steps to calculate standard deviation from a sample of 10 test scores, which are to be organized in a 3 column chart and used to determine the mean, differences from the mean, squared differences, sum of squares, and final standard deviation value.
Ch03 12
The document contains solutions to 12 math exercises:
1) Exercise a finds x = 1, exercise b finds x = -3, exercise c finds x = 3
2) Exercise d finds x = 8, exercise e finds x = 9
3) Exercise f finds x = 72, exercise g finds x = 12
4) Exercise h finds x = 120, exercise i finds x = 1
5) Exercise j finds the solution is impossible, exercise k finds x is any real number
6) Exercise l finds x = b - a
Bazmapatkum gcerov
The document contains mathematical equations and calculations. It begins with setting up the equation 123x54 and proceeds to work through the steps to solve for the answer. It ultimately calculates the solution as 6642.
División de un polinomio entre un binomio
The document is a video cast that demonstrates dividing a polynomial by a binomial. It shows the step-by-step operations to divide the polynomial 5x^3 - 2x^2 + 3x + 1 by the binomial x + 1. The division results in the quotient of 5x^2 - 7x + 10 and the remainder of 0x - 9. The video cast provides credit to the source of an image and details about the software and music used.
Completing the square
1) The document discusses completing the square, which involves transforming quadratic expressions into perfect square trinomial form.
2) An example problem walks through completing the square to solve the equation x2 + 6x = 7. This involves adding a constant term, finding the constant to make the expression a perfect square, and then using square roots to solve for x.
3) Another example solves the equation x2 + 10x - 8 = 0 by following similar steps but leaving the radical term in the solution instead of simplifying further.
2º tablas-multiplicar-mini
The document contains multiplication tables from 1 x 0 to 10 x 10. It shows the multiplication of each single digit number from 0 to 10 by the numbers 1 through 10 in a table format. The purpose is to help students learn and practice their multiplication tables to be able to do quick math calculations and solve problems.
Banana republic final
This document provides an analysis of the retail space and customer demographics of a clothing store called BR. It includes an agenda covering analysis of the retail space, window displays, sections for women's business clothing and demographics. It then details interviews with customers and a store manager. Recommendations are provided to repaint, maintain sales displays, reorganize the layout to prioritize female shoppers who make up most customers, utilize all window space for displays, and do more advertising.
Marketing research
The document discusses marketing research, defining it as the systematic process of designing, collecting, analyzing, and reporting data to address a specific marketing problem or opportunity. It outlines the marketing research process, methods used including qualitative and quantitative approaches, and common areas of focus like segmentation, product, pricing, promotion, and distribution research. The benefits of market research are highlighted as tapping into opportunities, encouraging communication, minimizing risks, and finding potential problems. Mistakes to avoid are only doing one type of research, limited research sources, not identifying the target audience, and not incentivizing consumer participation.
決済金融から始めるデータドリブンカンパニー #yjmu
Yahoo! JAPAN MeetUp #9 (EC技術カンファレンス)
LT「決済金融から始めるデータドリブンカンパニー」の発表で使用した資料となります。
https://yj-meetup.connpass.com/event/48215/
More Related Content
What's hot
Tablas multiplicar
The document contains 10 tables showing the multiplication tables for numbers 1 through 10. Each table lists the results of multiplying the number in the title by integers from 0 to 10.
Algebra Lineal. Tarea1
This document provides 10 systems of linear equations and asks to find the solution to each system. It lists the equations for 10 different systems of linear equations, with the unknowns x1, x2 and x3. The task is to solve for the values of the unknowns that satisfy all equations simultaneously in each system.
5 6 slideand_divide_11_19_12
This document provides examples and steps for factoring trinomials using the "slide and divide" method. It demonstrates factoring trinomials of the form ax^2 + bx + c through 4 examples, showing the steps of finding the greatest common factor, "sliding" terms to group like terms, factoring, dividing and simplifying, and "pushing back" the factors. Exercises are assigned from the green algebra book problems 25-39 odds on page 328.
Las tablas de multiplicar
The document presents the multiplication tables from 2 to 11, listing the product of each number from 1 to 12 multiplied by the given number. It provides the full multiplication table for the numbers 2 through 10, and the header for 11 to indicate it would follow the same format.
Day 8 - Rational Inequalities
This document discusses solving rational inequalities by finding the values of x where the numerator and denominator are equal to 0, as these are the points where the rational expression changes signs. It provides examples of solving rational inequalities algebraically and checking the solutions graphically. Students are asked to solve some practice problems finding the values of x that satisfy the given rational inequalities.
แบบทดสอบ ชุดที่ 2 สมการเชิงเส้นตัวแปรเดียว
1) The solution to the equation 2x + 3 = 11 is x = 4.
2) By solving the series of equations, the value of x is found to be 3.
3) Solving the equation 3x - 5 = 8 results in x = 3.
Tablas de multiplicar
The document shows a multiplication table for the numbers 1 through 10 multiplied by x. Each line gives the result of multiplying a number from 1 to 10 by x from 0 to 10. The table is organized with the number being multiplied by x listed first, followed by the result of multiplying that number by each value of x from 0 to 10.
Tablas de multiplicar
The document shows a multiplication table for the numbers 1 through 10 multiplied by the variable x. Each line lists the result of multiplying a number from 1 to 10 by x from 0 to 10. For example, 1x0 = 0, 1x1 = 1, and so on up to 10x10 = 100.
Tabla multiplicar
The document contains two tables showing the multiplication tables from 1 to 10. The first table shows the full multiplication table up to 10x10. The second table is a reduced version only showing the key results for brevity. Both tables are from a Spanish educational website on multiplication tables.
Tablas de multiplicar
The document shows a multiplication table going from 1 to 10 for the numbers 1 through 10. For each number from 1 to 10 in the left column (representing the multiplier), and each number from 0 to 10 in the top row (representing the multiplicand), it shows the result of multiplying those two numbers.
Solving Trinomial Equations
1. The document shows the steps to solve a quadratic equation using algebra tiles.
2. It represents the equation x2 + 5x + 6 = 0 with algebra tiles, grouping like terms to write it as (x + 2)(x + 3) = 0.
3. It then solves for x by finding the two numbers whose product is zero, determining x = -2 or -3.
Tablas de multiplicar
The document contains the multiplication tables from 1 to 9. Each table lists the results of multiplying that number by 0 through 10. For example, the table of 3 shows 3 x 0 = 0, 3 x 1 = 3, and so on up to 3 x 10 = 30.
Aprende las tablas de multiplicar
This document contains tables for multiplication from 1 to 10. Each table lists the multiplication problems and solutions for multiplying a number from 1 to 10 by 0 through 10. There are 10 tables in total, one for each number 1 through 10. The tables are presented side by side for easy reference when learning multiplication facts.
2 statistics -standard deviation may 20
The document provides instructions for calculating the standard deviation from a set of test scores. It defines standard deviation as the square root of the sum of the squared differences between each score and the mean, divided by n-1. It then lists the steps to calculate standard deviation from a sample of 10 test scores, which are to be organized in a 3 column chart and used to determine the mean, differences from the mean, squared differences, sum of squares, and final standard deviation value.
Ch03 12
The document contains solutions to 12 math exercises:
1) Exercise a finds x = 1, exercise b finds x = -3, exercise c finds x = 3
2) Exercise d finds x = 8, exercise e finds x = 9
3) Exercise f finds x = 72, exercise g finds x = 12
4) Exercise h finds x = 120, exercise i finds x = 1
5) Exercise j finds the solution is impossible, exercise k finds x is any real number
6) Exercise l finds x = b - a
Bazmapatkum gcerov
The document contains mathematical equations and calculations. It begins with setting up the equation 123x54 and proceeds to work through the steps to solve for the answer. It ultimately calculates the solution as 6642.
División de un polinomio entre un binomio
The document is a video cast that demonstrates dividing a polynomial by a binomial. It shows the step-by-step operations to divide the polynomial 5x^3 - 2x^2 + 3x + 1 by the binomial x + 1. The division results in the quotient of 5x^2 - 7x + 10 and the remainder of 0x - 9. The video cast provides credit to the source of an image and details about the software and music used.
Completing the square
1) The document discusses completing the square, which involves transforming quadratic expressions into perfect square trinomial form.
2) An example problem walks through completing the square to solve the equation x2 + 6x = 7. This involves adding a constant term, finding the constant to make the expression a perfect square, and then using square roots to solve for x.
3) Another example solves the equation x2 + 10x - 8 = 0 by following similar steps but leaving the radical term in the solution instead of simplifying further.
2º tablas-multiplicar-mini
The document contains multiplication tables from 1 x 0 to 10 x 10. It shows the multiplication of each single digit number from 0 to 10 by the numbers 1 through 10 in a table format. The purpose is to help students learn and practice their multiplication tables to be able to do quick math calculations and solve problems.
What's hot (19)
Viewers also liked
Banana republic final
This document provides an analysis of the retail space and customer demographics of a clothing store called BR. It includes an agenda covering analysis of the retail space, window displays, sections for women's business clothing and demographics. It then details interviews with customers and a store manager. Recommendations are provided to repaint, maintain sales displays, reorganize the layout to prioritize female shoppers who make up most customers, utilize all window space for displays, and do more advertising.
Marketing research
The document discusses marketing research, defining it as the systematic process of designing, collecting, analyzing, and reporting data to address a specific marketing problem or opportunity. It outlines the marketing research process, methods used including qualitative and quantitative approaches, and common areas of focus like segmentation, product, pricing, promotion, and distribution research. The benefits of market research are highlighted as tapping into opportunities, encouraging communication, minimizing risks, and finding potential problems. Mistakes to avoid are only doing one type of research, limited research sources, not identifying the target audience, and not incentivizing consumer participation.
決済金融から始めるデータドリブンカンパニー #yjmu
Yahoo! JAPAN MeetUp #9 (EC技術カンファレンス)
LT「決済金融から始めるデータドリブンカンパニー」の発表で使用した資料となります。
https://yj-meetup.connpass.com/event/48215/
Possessive 's
The document explains how to use possessive 's to show belonging or possession. It states that possessive 's is an apostrophe followed by an s and is used as a determiner when something belongs to someone or something. It provides examples for singular and plural nouns, and when something belongs to multiple people, where the apostrophe goes after the last mentioned person. It concludes with practice sentences to fill in the possessive 's.
CPATT SAMPLE WORKS
This document summarizes several projects from a design portfolio. It describes a 4 person, 18 week project to revitalize the Old Post Office in Chicago which involved site investigation and a master plan proposal. It also summarizes a 2+ year ongoing research project with faculty to develop low-cost modular housing and a 3 person, 6 week project for a paper dress and sustainable fashion pavilion for an expo in Milan. Additionally, it notes that sketching and watercolors are passions that aid the design process.
Digital competence strategy
This document discusses the challenges of the 21st century related to digitalization, globalization, and new economic trends. It argues that digital literacy is key to learning, work, job opportunities, and civic engagement in this new environment. The document outlines different dimensions and processes of developing digital competence over time, from basic competence to socio-communicative competence associated with cyberspace. It discusses questions around whose responsibility it is to develop these competencies and what educational goals should be.
Postimpresionismo
El documento describe el contexto histórico del postimpresionismo entre 1880-1905, una época de cambios políticos y alianzas en Europa. El postimpresionismo surgió como una reacción al impresionismo, dando más énfasis al color y la imaginación que al naturalismo. Artistas clave como Paul Cézanne y Vincent van Gogh pintaron en una variedad de estilos compartiendo este enfoque y allanando el camino para los movimientos artísticos del siglo XX.
Recursos y herramientas con un uso pedagógico
El documento describe diferentes recursos y herramientas pedagógicas que pueden utilizarse en la enseñanza, incluyendo materiales escritos, representaciones gráficas, videos, personas expertas, y tecnologías como procesadores de texto, hojas de cálculo, blogs, y Internet. Explica cómo estas herramientas pueden mejorar la presentación de información, permitir la colaboración, y facilitar la comunicación y el aprendizaje activo.
Los medios naturales:Lucía,álvaro,sara,amaia,antoine 1ºa
España tiene varios tipos de bosques y vegetación que se adaptan a los diferentes climas del país. Estos incluyen el bosque atlántico caducifolio en el clima oceánico, los hayedos y robledales en el bosque mediterráneo, y el bosque subtropical canario con especies como la laurisilva. La vegetación también varía según la altitud en las montañas y la humedad cerca de los ríos.
Gillette - Innovation may not be enough
Whether the level of innovation has reached to peak for Gillette?
Whether Gillette should reduce the price?
What should Gillette do to fight low-cost competitors like Dollar Shave Club?
What should be strategy for Gillette in long term
Resume_RohitKumar
Rohit Kumar is seeking a challenging position where he can utilize his technical skills and contribute to organizational growth. He has a diploma in mechanical engineering and certifications in CNC programming. His technical skills include programming languages, operating systems, and CAD software. He has over 3 years of work experience in quality engineering and sales roles at various manufacturing companies. His responsibilities included meeting production and sales targets, quality control, and documentation.
HOJAS
El documento describe los impactos que pueden tener los sistemas técnicos a nivel local, regional y global en la naturaleza. Explica que a nivel local los impactos afectan a la comunidad, a nivel regional a una zona delimitada, y a nivel global al planeta entero. También habla sobre los residuos y desechos que generan los sistemas técnicos y cómo esto puede alterar los ecosistemas.
Viewers also liked (14)
Los medios naturales:Lucía,álvaro,sara,amaia,antoine 1ºa
Los medios naturales:Lucía,álvaro,sara,amaia,antoine 1ºa
Recently uploaded
一比一原版(UMN文凭证书)明尼苏达大学毕业证如何办理
毕业原版【微信:176555708】【(UMN毕业证书)明尼苏达大学毕业证】【微信:176555708】成绩单、外壳、offer、留信学历认证(永久存档真实可查)采用学校原版纸张、特殊工艺完全按照原版一比一制作(包括:隐形水印,阴影底纹,钢印LOGO烫金烫银,LOGO烫金烫银复合重叠,文字图案浮雕,激光镭射,紫外荧光,温感,复印防伪)行业标杆!精益求精,诚心合作,真诚制作!多年品质 ,按需精细制作,24小时接单,全套进口原装设备,十五年致力于帮助留学生解决难题,业务范围有加拿大、英国、澳洲、韩国、美国、新加坡,新西兰等学历材料,包您满意。
【我们承诺采用的是学校原版纸张(纸质、底色、纹路),我们拥有全套进口原装设备,特殊工艺都是采用不同机器制作,仿真度基本可以达到100%,所有工艺效果都可提前给客户展示,不满意可以根据客户要求进行调整,直到满意为止!】
【业务选择办理准则】
一、工作未确定,回国需先给父母、亲戚朋友看下文凭的情况,办理一份就读学校的毕业证【微信176555708】文凭即可
二、回国进私企、外企、自己做生意的情况,这些单位是不查询毕业证真伪的,而且国内没有渠道去查询国外文凭的真假,也不需要提供真实教育部认证。鉴于此,办理一份毕业证【微信176555708】即可
三、进国企,银行,事业单位,考公务员等等,这些单位是必需要提供真实教育部认证的,办理教育部认证所需资料众多且烦琐,所有材料您都必须提供原件,我们凭借丰富的经验,快捷的绿色通道帮您快速整合材料,让您少走弯路。
留信网认证的作用:
1:该专业认证可证明留学生真实身份
2:同时对留学生所学专业登记给予评定
3:国家专业人才认证中心颁发入库证书
4:这个认证书并且可以归档倒地方
5:凡事获得留信网入网的信息将会逐步更新到个人身份内,将在公安局网内查询个人身份证信息后,同步读取人才网入库信息
6:个人职称评审加20分
7:个人信誉贷款加10分
8:在国家人才网主办的国家网络招聘大会中纳入资料,供国家高端企业选择人才
留信网服务项目:
1、留学生专业人才库服务(留信分析)
2、国(境)学习人员提供就业推荐信服务
3、留学人员区块链存储服务
→ 【关于价格问题(保证一手价格)】
我们所定的价格是非常合理的,而且我们现在做得单子大多数都是代理和回头客户介绍的所以一般现在有新的单子 我给客户的都是第一手的代理价格,因为我想坦诚对待大家 不想跟大家在价格方面浪费时间
对于老客户或者被老客户介绍过来的朋友,我们都会适当给一些优惠。
选择实体注册公司办理,更放心,更安全!我们的承诺:客户在留信官方认证查询网站查询到认证通过结果后付款,不成功不收费!
Beyond the Basics of A/B Tests: Highly Innovative Experimentation Tactics You...
This webinar will explore cutting-edge, less familiar but powerful experimentation methodologies which address well-known limitations of standard A/B Testing. Designed for data and product leaders, this session aims to inspire the embrace of innovative approaches and provide insights into the frontiers of experimentation!
一比一原版(牛布毕业证书)牛津布鲁克斯大学毕业证如何办理
毕业原版【微信:41543339】【(牛布毕业证书)牛津布鲁克斯大学毕业证】【微信:41543339】成绩单、外壳、offer、留信学历认证(永久存档真实可查)采用学校原版纸张、特殊工艺完全按照原版一比一制作(包括:隐形水印,阴影底纹,钢印LOGO烫金烫银,LOGO烫金烫银复合重叠,文字图案浮雕,激光镭射,紫外荧光,温感,复印防伪)行业标杆!精益求精,诚心合作,真诚制作!多年品质 ,按需精细制作,24小时接单,全套进口原装设备,十五年致力于帮助留学生解决难题,业务范围有加拿大、英国、澳洲、韩国、美国、新加坡,新西兰等学历材料,包您满意。
【我们承诺采用的是学校原版纸张(纸质、底色、纹路),我们拥有全套进口原装设备,特殊工艺都是采用不同机器制作,仿真度基本可以达到100%,所有工艺效果都可提前给客户展示,不满意可以根据客户要求进行调整,直到满意为止!】
【业务选择办理准则】
一、工作未确定,回国需先给父母、亲戚朋友看下文凭的情况,办理一份就读学校的毕业证【微信41543339】文凭即可
二、回国进私企、外企、自己做生意的情况,这些单位是不查询毕业证真伪的,而且国内没有渠道去查询国外文凭的真假,也不需要提供真实教育部认证。鉴于此,办理一份毕业证【微信41543339】即可
三、进国企,银行,事业单位,考公务员等等,这些单位是必需要提供真实教育部认证的,办理教育部认证所需资料众多且烦琐,所有材料您都必须提供原件,我们凭借丰富的经验,快捷的绿色通道帮您快速整合材料,让您少走弯路。
留信网认证的作用:
1:该专业认证可证明留学生真实身份
2:同时对留学生所学专业登记给予评定
3:国家专业人才认证中心颁发入库证书
4:这个认证书并且可以归档倒地方
5:凡事获得留信网入网的信息将会逐步更新到个人身份内,将在公安局网内查询个人身份证信息后,同步读取人才网入库信息
6:个人职称评审加20分
7:个人信誉贷款加10分
8:在国家人才网主办的国家网络招聘大会中纳入资料,供国家高端企业选择人才
留信网服务项目:
1、留学生专业人才库服务(留信分析)
2、国(境)学习人员提供就业推荐信服务
3、留学人员区块链存储服务
→ 【关于价格问题(保证一手价格)】
我们所定的价格是非常合理的,而且我们现在做得单子大多数都是代理和回头客户介绍的所以一般现在有新的单子 我给客户的都是第一手的代理价格,因为我想坦诚对待大家 不想跟大家在价格方面浪费时间
对于老客户或者被老客户介绍过来的朋友,我们都会适当给一些优惠。
选择实体注册公司办理,更放心,更安全!我们的承诺:客户在留信官方认证查询网站查询到认证通过结果后付款,不成功不收费!
一比一原版(UO毕业证)渥太华大学毕业证如何办理
UO毕业证录取书【微信95270640】购买(渥太华大学毕业证成绩单硕士学历)Q微信95270640代办UO学历认证留信网伪造渥太华大学学位证书精仿渥太华大学本科/硕士文凭证书补办渥太华大学 diplomaoffer,Transcript购买渥太华大学毕业证成绩单购买UO假毕业证学位证书购买伪造渥太华大学文凭证书学位证书,专业办理雅思、托福成绩单,学生ID卡,在读证明,海外各大学offer录取通知书,毕业证书,成绩单,文凭等材料:1:1完美还原毕业证、offer录取通知书、学生卡等各种在读或毕业材料的防伪工艺(包括 烫金、烫银、钢印、底纹、凹凸版、水印、防伪光标、热敏防伪、文字图案浮雕,激光镭射,紫外荧光,温感光标)学校原版上有的工艺我们一样不会少,不论是老版本还是最新版本,都能保证最高程度还原,力争完美以求让所有同学都能享受到完美的品质服务。
文凭办理流程:
1客户提供办理信息:姓名生日专业学位毕业时间等(如信息不确定可以咨询顾问:微信95270640我们有专业老师帮你查询);
2开始安排制作毕业证成绩单电子图;
3毕业证成绩单电子版做好以后发送给您确认;
4毕业证成绩单电子版您确认信息无误之后安排制作成品;
5成品做好拍照或者视频给您确认;
6快递给客户(国内顺丰国外DHLUPS等快读邮寄)。
7完成交易删除客户资料
高精端提供以下服务:
一:渥太华大学渥太华大学毕业证文凭证书全套材料从防伪到印刷水印底纹到钢印烫金
二:真实使馆认证(留学人员回国证明)使馆存档
三:真实教育部认证教育部存档教育部留服网站可查
四:留信认证留学生信息网站可查
五:与学校颁发的相关证件1:1纸质尺寸制定(定期向各大院校毕业生购买最新版本毕,业证成绩单保证您拿到的是鲁昂大学内部最新版本毕业证成绩单微信95270640)
A.为什么留学生需要操作留信认证?
留信认证全称全国留学生信息服务网认证,隶属于北京中科院。①留信认证门槛条件更低,费用更美丽,并且包过,完单周期短,效率高②留信认证虽然不能去国企,但是一般的公司都没有问题,因为国内很多公司连基本的留学生学历认证都不了解。这对于留学生来说,这就比自己光拿一个证书更有说服力,因为留学学历可以在留信网站上进行查询!
B.为什么我们提供的毕业证成绩单具有使用价值?
查询留服认证是国内鉴别留学生海外学历的唯一途径但认证只是个体行为不是所有留学生都操作所以没有办理认证的留学生的学历在国内也是查询不到的他们也仅仅只有一张文凭。所以这时候我们提供的和学校颁发的一模一样的毕业证成绩单就有了使用价值。只硕大的蛇皮袋手里拎着长铁钩正站在门口朝黑色的屋内张望不好坏人小偷山娃一怔却也灵机一动立马仰起头双手拢在嘴边朝楼上大喊:“爸爸爸——有人找——那人一听朝山娃尴尬地笑笑悻悻地走了山娃立马“嘭的一声将铁门锁死心却咚咚地乱跳当山娃跟父亲说起这事时父亲很吃惊抚摸着山娃的头说还好醒得及时要不家早被人掏空了到时连电视也没得看啰不过父亲还是夸山娃能临危不乱随机应变有胆有谋山娃笑笑说那都是书上学的看童话和小说时多
The Ipsos - AI - Monitor 2024 Report.pdf
According to Ipsos AI Monitor's 2024 report, 65% Indians said that products and services using AI have profoundly changed their daily life in the past 3-5 years.
Learn SQL from basic queries to Advance queries
Dive into the world of data analysis with our comprehensive guide on mastering SQL! This presentation offers a practical approach to learning SQL, focusing on real-world applications and hands-on practice. Whether you're a beginner or looking to sharpen your skills, this guide provides the tools you need to extract, analyze, and interpret data effectively.
Key Highlights:
Foundations of SQL: Understand the basics of SQL, including data retrieval, filtering, and aggregation.
Advanced Queries: Learn to craft complex queries to uncover deep insights from your data.
Data Trends and Patterns: Discover how to identify and interpret trends and patterns in your datasets.
Practical Examples: Follow step-by-step examples to apply SQL techniques in real-world scenarios.
Actionable Insights: Gain the skills to derive actionable insights that drive informed decision-making.
Join us on this journey to enhance your data analysis capabilities and unlock the full potential of SQL. Perfect for data enthusiasts, analysts, and anyone eager to harness the power of data!
#DataAnalysis #SQL #LearningSQL #DataInsights #DataScience #Analytics
DSSML24_tspann_CodelessGenerativeAIPipelines
Codeless Generative AI Pipelines
(GenAI with Milvus)
https://ml.dssconf.pl/user.html#!/lecture/DSSML24-041a/rate
Discover the potential of real-time streaming in the context of GenAI as we delve into the intricacies of Apache NiFi and its capabilities. Learn how this tool can significantly simplify the data engineering workflow for GenAI applications, allowing you to focus on the creative aspects rather than the technical complexities. I will guide you through practical examples and use cases, showing the impact of automation on prompt building. From data ingestion to transformation and delivery, witness how Apache NiFi streamlines the entire pipeline, ensuring a smooth and hassle-free experience.
Timothy Spann
https://www.youtube.com/@FLaNK-Stack
https://medium.com/@tspann
https://www.datainmotion.dev/
milvus, unstructured data, vector database, zilliz, cloud, vectors, python, deep learning, generative ai, genai, nifi, kafka, flink, streaming, iot, edge
Experts live - Improving user adoption with AI
Bekijk de slides van onze sessie Enhancing Modern Workplace Efficiency op Experts Live 2024.
一比一原版(Harvard毕业证书)哈佛大学毕业证如何办理
毕业原版【微信:41543339】【(Harvard毕业证书)哈佛大学毕业证】【微信:41543339】成绩单、外壳、offer、留信学历认证(永久存档真实可查)采用学校原版纸张、特殊工艺完全按照原版一比一制作(包括:隐形水印,阴影底纹,钢印LOGO烫金烫银,LOGO烫金烫银复合重叠,文字图案浮雕,激光镭射,紫外荧光,温感,复印防伪)行业标杆!精益求精,诚心合作,真诚制作!多年品质 ,按需精细制作,24小时接单,全套进口原装设备,十五年致力于帮助留学生解决难题,业务范围有加拿大、英国、澳洲、韩国、美国、新加坡,新西兰等学历材料,包您满意。
【我们承诺采用的是学校原版纸张(纸质、底色、纹路),我们拥有全套进口原装设备,特殊工艺都是采用不同机器制作,仿真度基本可以达到100%,所有工艺效果都可提前给客户展示,不满意可以根据客户要求进行调整,直到满意为止!】
【业务选择办理准则】
一、工作未确定,回国需先给父母、亲戚朋友看下文凭的情况,办理一份就读学校的毕业证【微信41543339】文凭即可
二、回国进私企、外企、自己做生意的情况,这些单位是不查询毕业证真伪的,而且国内没有渠道去查询国外文凭的真假,也不需要提供真实教育部认证。鉴于此,办理一份毕业证【微信41543339】即可
三、进国企,银行,事业单位,考公务员等等,这些单位是必需要提供真实教育部认证的,办理教育部认证所需资料众多且烦琐,所有材料您都必须提供原件,我们凭借丰富的经验,快捷的绿色通道帮您快速整合材料,让您少走弯路。
留信网认证的作用:
1:该专业认证可证明留学生真实身份
2:同时对留学生所学专业登记给予评定
3:国家专业人才认证中心颁发入库证书
4:这个认证书并且可以归档倒地方
5:凡事获得留信网入网的信息将会逐步更新到个人身份内,将在公安局网内查询个人身份证信息后,同步读取人才网入库信息
6:个人职称评审加20分
7:个人信誉贷款加10分
8:在国家人才网主办的国家网络招聘大会中纳入资料,供国家高端企业选择人才
留信网服务项目:
1、留学生专业人才库服务(留信分析)
2、国(境)学习人员提供就业推荐信服务
3、留学人员区块链存储服务
→ 【关于价格问题(保证一手价格)】
我们所定的价格是非常合理的,而且我们现在做得单子大多数都是代理和回头客户介绍的所以一般现在有新的单子 我给客户的都是第一手的代理价格,因为我想坦诚对待大家 不想跟大家在价格方面浪费时间
对于老客户或者被老客户介绍过来的朋友,我们都会适当给一些优惠。
选择实体注册公司办理,更放心,更安全!我们的承诺:客户在留信官方认证查询网站查询到认证通过结果后付款,不成功不收费!
一比一原版(UCSB文凭证书)圣芭芭拉分校毕业证如何办理
毕业原版【微信:176555708】【(UCSB毕业证书)圣芭芭拉分校毕业证】【微信:176555708】成绩单、外壳、offer、留信学历认证(永久存档真实可查)采用学校原版纸张、特殊工艺完全按照原版一比一制作(包括:隐形水印,阴影底纹,钢印LOGO烫金烫银,LOGO烫金烫银复合重叠,文字图案浮雕,激光镭射,紫外荧光,温感,复印防伪)行业标杆!精益求精,诚心合作,真诚制作!多年品质 ,按需精细制作,24小时接单,全套进口原装设备,十五年致力于帮助留学生解决难题,业务范围有加拿大、英国、澳洲、韩国、美国、新加坡,新西兰等学历材料,包您满意。
【我们承诺采用的是学校原版纸张(纸质、底色、纹路),我们拥有全套进口原装设备,特殊工艺都是采用不同机器制作,仿真度基本可以达到100%,所有工艺效果都可提前给客户展示,不满意可以根据客户要求进行调整,直到满意为止!】
【业务选择办理准则】
一、工作未确定,回国需先给父母、亲戚朋友看下文凭的情况,办理一份就读学校的毕业证【微信176555708】文凭即可
二、回国进私企、外企、自己做生意的情况,这些单位是不查询毕业证真伪的,而且国内没有渠道去查询国外文凭的真假,也不需要提供真实教育部认证。鉴于此,办理一份毕业证【微信176555708】即可
三、进国企,银行,事业单位,考公务员等等,这些单位是必需要提供真实教育部认证的,办理教育部认证所需资料众多且烦琐,所有材料您都必须提供原件,我们凭借丰富的经验,快捷的绿色通道帮您快速整合材料,让您少走弯路。
留信网认证的作用:
1:该专业认证可证明留学生真实身份
2:同时对留学生所学专业登记给予评定
3:国家专业人才认证中心颁发入库证书
4:这个认证书并且可以归档倒地方
5:凡事获得留信网入网的信息将会逐步更新到个人身份内,将在公安局网内查询个人身份证信息后,同步读取人才网入库信息
6:个人职称评审加20分
7:个人信誉贷款加10分
8:在国家人才网主办的国家网络招聘大会中纳入资料,供国家高端企业选择人才
留信网服务项目:
1、留学生专业人才库服务(留信分析)
2、国(境)学习人员提供就业推荐信服务
3、留学人员区块链存储服务
→ 【关于价格问题(保证一手价格)】
我们所定的价格是非常合理的,而且我们现在做得单子大多数都是代理和回头客户介绍的所以一般现在有新的单子 我给客户的都是第一手的代理价格,因为我想坦诚对待大家 不想跟大家在价格方面浪费时间
对于老客户或者被老客户介绍过来的朋友,我们都会适当给一些优惠。
选择实体注册公司办理,更放心,更安全!我们的承诺:客户在留信官方认证查询网站查询到认证通过结果后付款,不成功不收费!
My burning issue is homelessness K.C.M.O.
My burning issue is homelessness in Kansas City, MO
To: Tom Tresser
From: Roger Warren
State of Artificial intelligence Report 2023
Artificial intelligence (AI) is a multidisciplinary field of science and engineering whose goal is to create intelligent machines.
We believe that AI will be a force multiplier on technological progress in our increasingly digital, data-driven world. This is because everything around us today, ranging from culture to consumer products, is a product of intelligence.
The State of AI Report is now in its sixth year. Consider this report as a compilation of the most interesting things we’ve seen with a goal of triggering an informed conversation about the state of AI and its implication for the future.
We consider the following key dimensions in our report:
Research: Technology breakthroughs and their capabilities.
Industry: Areas of commercial application for AI and its business impact.
Politics: Regulation of AI, its economic implications and the evolving geopolitics of AI.
Safety: Identifying and mitigating catastrophic risks that highly-capable future AI systems could pose to us.
Predictions: What we believe will happen in the next 12 months and a 2022 performance review to keep us honest.
办(uts毕业证书)悉尼科技大学毕业证学历证书原版一模一样
原版一模一样【微信:741003700 】【(uts毕业证书)悉尼科技大学毕业证学历证书】【微信:741003700 】学位证,留信认证(真实可查,永久存档)offer、雅思、外壳等材料/诚信可靠,可直接看成品样本,帮您解决无法毕业带来的各种难题!外壳,原版制作,诚信可靠,可直接看成品样本。行业标杆!精益求精,诚心合作,真诚制作!多年品质 ,按需精细制作,24小时接单,全套进口原装设备。十五年致力于帮助留学生解决难题,包您满意。
本公司拥有海外各大学样板无数,能完美还原海外各大学 Bachelor Diploma degree, Master Degree Diploma
1:1完美还原海外各大学毕业材料上的工艺:水印,阴影底纹,钢印LOGO烫金烫银,LOGO烫金烫银复合重叠。文字图案浮雕、激光镭射、紫外荧光、温感、复印防伪等防伪工艺。材料咨询办理、认证咨询办理请加学历顾问Q/微741003700
留信网认证的作用:
1:该专业认证可证明留学生真实身份
2:同时对留学生所学专业登记给予评定
3:国家专业人才认证中心颁发入库证书
4:这个认证书并且可以归档倒地方
5:凡事获得留信网入网的信息将会逐步更新到个人身份内,将在公安局网内查询个人身份证信息后,同步读取人才网入库信息
6:个人职称评审加20分
7:个人信誉贷款加10分
8:在国家人才网主办的国家网络招聘大会中纳入资料,供国家高端企业选择人才
Population Growth in Bataan: The effects of population growth around rural pl...
A population analysis specific to Bataan.
一比一原版(Coventry毕业证书)考文垂大学毕业证如何办理
毕业原版【微信:41543339】【(Coventry毕业证书)考文垂大学毕业证】【微信:41543339】成绩单、外壳、offer、留信学历认证(永久存档真实可查)采用学校原版纸张、特殊工艺完全按照原版一比一制作(包括:隐形水印,阴影底纹,钢印LOGO烫金烫银,LOGO烫金烫银复合重叠,文字图案浮雕,激光镭射,紫外荧光,温感,复印防伪)行业标杆!精益求精,诚心合作,真诚制作!多年品质 ,按需精细制作,24小时接单,全套进口原装设备,十五年致力于帮助留学生解决难题,业务范围有加拿大、英国、澳洲、韩国、美国、新加坡,新西兰等学历材料,包您满意。
【我们承诺采用的是学校原版纸张(纸质、底色、纹路),我们拥有全套进口原装设备,特殊工艺都是采用不同机器制作,仿真度基本可以达到100%,所有工艺效果都可提前给客户展示,不满意可以根据客户要求进行调整,直到满意为止!】
【业务选择办理准则】
一、工作未确定,回国需先给父母、亲戚朋友看下文凭的情况,办理一份就读学校的毕业证【微信41543339】文凭即可
二、回国进私企、外企、自己做生意的情况,这些单位是不查询毕业证真伪的,而且国内没有渠道去查询国外文凭的真假,也不需要提供真实教育部认证。鉴于此,办理一份毕业证【微信41543339】即可
三、进国企,银行,事业单位,考公务员等等,这些单位是必需要提供真实教育部认证的,办理教育部认证所需资料众多且烦琐,所有材料您都必须提供原件,我们凭借丰富的经验,快捷的绿色通道帮您快速整合材料,让您少走弯路。
留信网认证的作用:
1:该专业认证可证明留学生真实身份
2:同时对留学生所学专业登记给予评定
3:国家专业人才认证中心颁发入库证书
4:这个认证书并且可以归档倒地方
5:凡事获得留信网入网的信息将会逐步更新到个人身份内,将在公安局网内查询个人身份证信息后,同步读取人才网入库信息
6:个人职称评审加20分
7:个人信誉贷款加10分
8:在国家人才网主办的国家网络招聘大会中纳入资料,供国家高端企业选择人才
留信网服务项目:
1、留学生专业人才库服务(留信分析)
2、国(境)学习人员提供就业推荐信服务
3、留学人员区块链存储服务
→ 【关于价格问题(保证一手价格)】
我们所定的价格是非常合理的,而且我们现在做得单子大多数都是代理和回头客户介绍的所以一般现在有新的单子 我给客户的都是第一手的代理价格,因为我想坦诚对待大家 不想跟大家在价格方面浪费时间
对于老客户或者被老客户介绍过来的朋友,我们都会适当给一些优惠。
选择实体注册公司办理,更放心,更安全!我们的承诺:客户在留信官方认证查询网站查询到认证通过结果后付款,不成功不收费!
一比一原版(爱大毕业证书)爱丁堡大学毕业证如何办理
毕业原版【微信:41543339】【(爱大毕业证书)爱丁堡大学毕业证】【微信:41543339】成绩单、外壳、offer、留信学历认证(永久存档真实可查)采用学校原版纸张、特殊工艺完全按照原版一比一制作(包括:隐形水印,阴影底纹,钢印LOGO烫金烫银,LOGO烫金烫银复合重叠,文字图案浮雕,激光镭射,紫外荧光,温感,复印防伪)行业标杆!精益求精,诚心合作,真诚制作!多年品质 ,按需精细制作,24小时接单,全套进口原装设备,十五年致力于帮助留学生解决难题,业务范围有加拿大、英国、澳洲、韩国、美国、新加坡,新西兰等学历材料,包您满意。
【我们承诺采用的是学校原版纸张(纸质、底色、纹路),我们拥有全套进口原装设备,特殊工艺都是采用不同机器制作,仿真度基本可以达到100%,所有工艺效果都可提前给客户展示,不满意可以根据客户要求进行调整,直到满意为止!】
【业务选择办理准则】
一、工作未确定,回国需先给父母、亲戚朋友看下文凭的情况,办理一份就读学校的毕业证【微信41543339】文凭即可
二、回国进私企、外企、自己做生意的情况,这些单位是不查询毕业证真伪的,而且国内没有渠道去查询国外文凭的真假,也不需要提供真实教育部认证。鉴于此,办理一份毕业证【微信41543339】即可
三、进国企,银行,事业单位,考公务员等等,这些单位是必需要提供真实教育部认证的,办理教育部认证所需资料众多且烦琐,所有材料您都必须提供原件,我们凭借丰富的经验,快捷的绿色通道帮您快速整合材料,让您少走弯路。
留信网认证的作用:
1:该专业认证可证明留学生真实身份
2:同时对留学生所学专业登记给予评定
3:国家专业人才认证中心颁发入库证书
4:这个认证书并且可以归档倒地方
5:凡事获得留信网入网的信息将会逐步更新到个人身份内,将在公安局网内查询个人身份证信息后,同步读取人才网入库信息
6:个人职称评审加20分
7:个人信誉贷款加10分
8:在国家人才网主办的国家网络招聘大会中纳入资料,供国家高端企业选择人才
留信网服务项目:
1、留学生专业人才库服务(留信分析)
2、国(境)学习人员提供就业推荐信服务
3、留学人员区块链存储服务
→ 【关于价格问题(保证一手价格)】
我们所定的价格是非常合理的,而且我们现在做得单子大多数都是代理和回头客户介绍的所以一般现在有新的单子 我给客户的都是第一手的代理价格,因为我想坦诚对待大家 不想跟大家在价格方面浪费时间
对于老客户或者被老客户介绍过来的朋友,我们都会适当给一些优惠。
选择实体注册公司办理,更放心,更安全!我们的承诺:客户在留信官方认证查询网站查询到认证通过结果后付款,不成功不收费!
06-12-2024-BudapestDataForum-BuildingReal-timePipelineswithFLaNK AIM
06-12-2024-BudapestDataForum-BuildingReal-timePipelineswithFLaNK AIM
by
Timothy Spann
Principal Developer Advocate
https://budapestdata.hu/2024/en/
https://budapestml.hu/2024/en/
tim.spann@zilliz.com
https://www.linkedin.com/in/timothyspann/
https://x.com/paasdev
https://github.com/tspannhw
https://www.youtube.com/@flank-stack
milvus
vector database
gen ai
generative ai
deep learning
machine learning
apache nifi
apache pulsar
apache kafka
apache flink
一比一原版(Glasgow毕业证书)格拉斯哥大学毕业证如何办理
毕业原版【微信:41543339】【(Glasgow毕业证书)格拉斯哥大学毕业证】【微信:41543339】成绩单、外壳、offer、留信学历认证(永久存档真实可查)采用学校原版纸张、特殊工艺完全按照原版一比一制作(包括:隐形水印,阴影底纹,钢印LOGO烫金烫银,LOGO烫金烫银复合重叠,文字图案浮雕,激光镭射,紫外荧光,温感,复印防伪)行业标杆!精益求精,诚心合作,真诚制作!多年品质 ,按需精细制作,24小时接单,全套进口原装设备,十五年致力于帮助留学生解决难题,业务范围有加拿大、英国、澳洲、韩国、美国、新加坡,新西兰等学历材料,包您满意。
【我们承诺采用的是学校原版纸张(纸质、底色、纹路),我们拥有全套进口原装设备,特殊工艺都是采用不同机器制作,仿真度基本可以达到100%,所有工艺效果都可提前给客户展示,不满意可以根据客户要求进行调整,直到满意为止!】
【业务选择办理准则】
一、工作未确定,回国需先给父母、亲戚朋友看下文凭的情况,办理一份就读学校的毕业证【微信41543339】文凭即可
二、回国进私企、外企、自己做生意的情况,这些单位是不查询毕业证真伪的,而且国内没有渠道去查询国外文凭的真假,也不需要提供真实教育部认证。鉴于此,办理一份毕业证【微信41543339】即可
三、进国企,银行,事业单位,考公务员等等,这些单位是必需要提供真实教育部认证的,办理教育部认证所需资料众多且烦琐,所有材料您都必须提供原件,我们凭借丰富的经验,快捷的绿色通道帮您快速整合材料,让您少走弯路。
留信网认证的作用:
1:该专业认证可证明留学生真实身份
2:同时对留学生所学专业登记给予评定
3:国家专业人才认证中心颁发入库证书
4:这个认证书并且可以归档倒地方
5:凡事获得留信网入网的信息将会逐步更新到个人身份内,将在公安局网内查询个人身份证信息后,同步读取人才网入库信息
6:个人职称评审加20分
7:个人信誉贷款加10分
8:在国家人才网主办的国家网络招聘大会中纳入资料,供国家高端企业选择人才
留信网服务项目:
1、留学生专业人才库服务(留信分析)
2、国(境)学习人员提供就业推荐信服务
3、留学人员区块链存储服务
→ 【关于价格问题(保证一手价格)】
我们所定的价格是非常合理的,而且我们现在做得单子大多数都是代理和回头客户介绍的所以一般现在有新的单子 我给客户的都是第一手的代理价格,因为我想坦诚对待大家 不想跟大家在价格方面浪费时间
对于老客户或者被老客户介绍过来的朋友,我们都会适当给一些优惠。
选择实体注册公司办理,更放心,更安全!我们的承诺:客户在留信官方认证查询网站查询到认证通过结果后付款,不成功不收费!
End-to-end pipeline agility - Berlin Buzzwords 2024
We describe how we achieve high change agility in data engineering by eliminating the fear of breaking downstream data pipelines through end-to-end pipeline testing, and by using schema metaprogramming to safely eliminate boilerplate involved in changes that affect whole pipelines.
A quick poll on agility in changing pipelines from end to end indicated a huge span in capabilities. For the question "How long time does it take for all downstream pipelines to be adapted to an upstream change," the median response was 6 months, but some respondents could do it in less than a day. When quantitative data engineering differences between the best and worst are measured, the span is often 100x-1000x, sometimes even more.
A long time ago, we suffered at Spotify from fear of changing pipelines due to not knowing what the impact might be downstream. We made plans for a technical solution to test pipelines end-to-end to mitigate that fear, but the effort failed for cultural reasons. We eventually solved this challenge, but in a different context. In this presentation we will describe how we test full pipelines effectively by manipulating workflow orchestration, which enables us to make changes in pipelines without fear of breaking downstream.
Making schema changes that affect many jobs also involves a lot of toil and boilerplate. Using schema-on-read mitigates some of it, but has drawbacks since it makes it more difficult to detect errors early. We will describe how we have rejected this tradeoff by applying schema metaprogramming, eliminating boilerplate but keeping the protection of static typing, thereby further improving agility to quickly modify data pipelines without fear.
Recently uploaded (20)
A presentation that explain the Power BI Licensing
A presentation that explain the Power BI Licensing
Beyond the Basics of A/B Tests: Highly Innovative Experimentation Tactics You...
Beyond the Basics of A/B Tests: Highly Innovative Experimentation Tactics You...
Population Growth in Bataan: The effects of population growth around rural pl...
Population Growth in Bataan: The effects of population growth around rural pl...
06-12-2024-BudapestDataForum-BuildingReal-timePipelineswithFLaNK AIM
06-12-2024-BudapestDataForum-BuildingReal-timePipelineswithFLaNK AIM
End-to-end pipeline agility - Berlin Buzzwords 2024
End-to-end pipeline agility - Berlin Buzzwords 2024
200 problemas cuadraticos
- 1. 1 2 3 4 5 6 7 8 x2 + (7 − x)2 = 25 9 7x2 + 21x − 28 = 0 10 −x2 + 4x − 7 = 0 11 12 6x2 −5x +1 = 0 13 14
- 2. 15 16