2 Vapor compression cycle abd multistage compression
1.
Dr. Antash Najib
Departmentof Engineering Sciences
National University of Sciences and Technology
PN Engineering College, PNS Jauhar, Karachi
HVAC
Topic 2 & 3: Pure substance properties and
Refrigeration cycles
Property Diagrams forPhase-change
Processes
T-v Diagrams
1. Water boiling at a
much higher
temperatures (179.9°C)
2. The specific volume of
the saturated liquid is
larger and the specific
volume of the
saturated vapor is
smaller than the
corresponding values
at 1 atm pressure
4.
Property Diagrams forPhase-change
Processes
T-v Diagrams
• As the pressure is increased
further, this saturation
(horizontal) line continues to
shrink
• Critical point: the point at
which the saturated liquid
and saturated vapor states
are identical
• For water
Pcr = 22.06 MPa,
Tcr= 373.95°C
vcr= 0.003106 m3/kg.
5.
Property Diagrams forPhase-change
Processes
T-v Diagrams
• Above the critical point there
exists a state of matter that is
continuously connected with
(can be transformed without
phase transition into) both the
liquid and the gaseous state.
• It is called supercritical fluid.
• The common textbook
knowledge is that all distinction
between liquid and vapor
disappears beyond the critical
point.
• This has been challenged by
Fisher and Widom who
identified a P–T line that
separates states with different
asymptotic statistical properties
(Fisher–Widom line).
Fisher, Widom: Decay of Correlations in Linear
Systems, J. Chem. Phys. 50, 3756 (1969).
6.
Property Tables
1a SaturatedLiquid and Saturated Vapor States
• The properties of saturated liquid and saturated
vapor for water are listed in Tables A–4 and A–5.
• Both tables give the same information. The only
difference is that in Table A–4 properties are listed
under temperature and in Table A–5 under pressure.
• Saturated liquid: f
• Saturated vapor: g
• Difference between vapor and liquid: fg
• E.g. hfg= latent heat of vaporization
The Carnot Engine
•Highest possible efficiency of
an engine working between
two temperatures.
• Reversible cycle
• No irreversibility such as
friction, unrestrained
expansion, mixing of two
fluids, heat transfer across a
finite temperature
difference, electric
resistance, inelastic
deformation of solids, and
chemical reactions.
13.
The Carnot RefrigerationCycle
• Reverse of a heat engine
• Requires external work
• 1-2 Adiabatic compression
• 2-3 Isothermal heat rejection
• 3-4 Adiabatic expansion
• 4-1 Isothermal addition of heat
• Carnot Refrigeration Cycle is “ideal” but
it serves as
– Standard to compare
– Temperatures that should be maintained
14.
Efficiency or COP
•Efficiency is the ratio of output energy by input
energy
• If we use the same formula for refrigeration
efficiency will be more than 100%
• Introduce a new term, Coefficient of Performance
(COP)
• Do we need high COP or low COP?
15.
Coefficient of Performance
•What can be highest COP? We will use Carnot
Refrigeration Cycle to find it out.
• Heat transfer in a reversible process is given as
qrev=ʃTds
• Useful refrigeration: Area under 4-1
• Heat Rejected: Area under 2-3
• Net Work is = Heat rejected-Heat added by
Refrigeration
• So the Area enclosed in rectangle 1-2-3-4 is the
amount of Work Done
Coefficient of Performance
•COP is entirely a function of Temperature
• Low value of T2 is desirable to get high COP
• While T1 is more important to have high value as its
effect is on both numerator and denominator
• To get a high COP operate on low T2 and high T1
• So why not go to T1=T2 ?
18.
• Limitations onTemperature
– If we have to maintain a refrigerated room at -20C and
reject heat in atmosphere at 30C
– We can not flow heat at the same temperature
– So both heat reject and heat addition need some Δt
– This is not a reversible process and this is not a carnot cycle
– However we can work very close to Carnot cycle by keeping
the Δt small
Q=UAΔt
For Q=Const and Δt0
A infinity
When A infinity
Cost infinity
Same goes for U value
19.
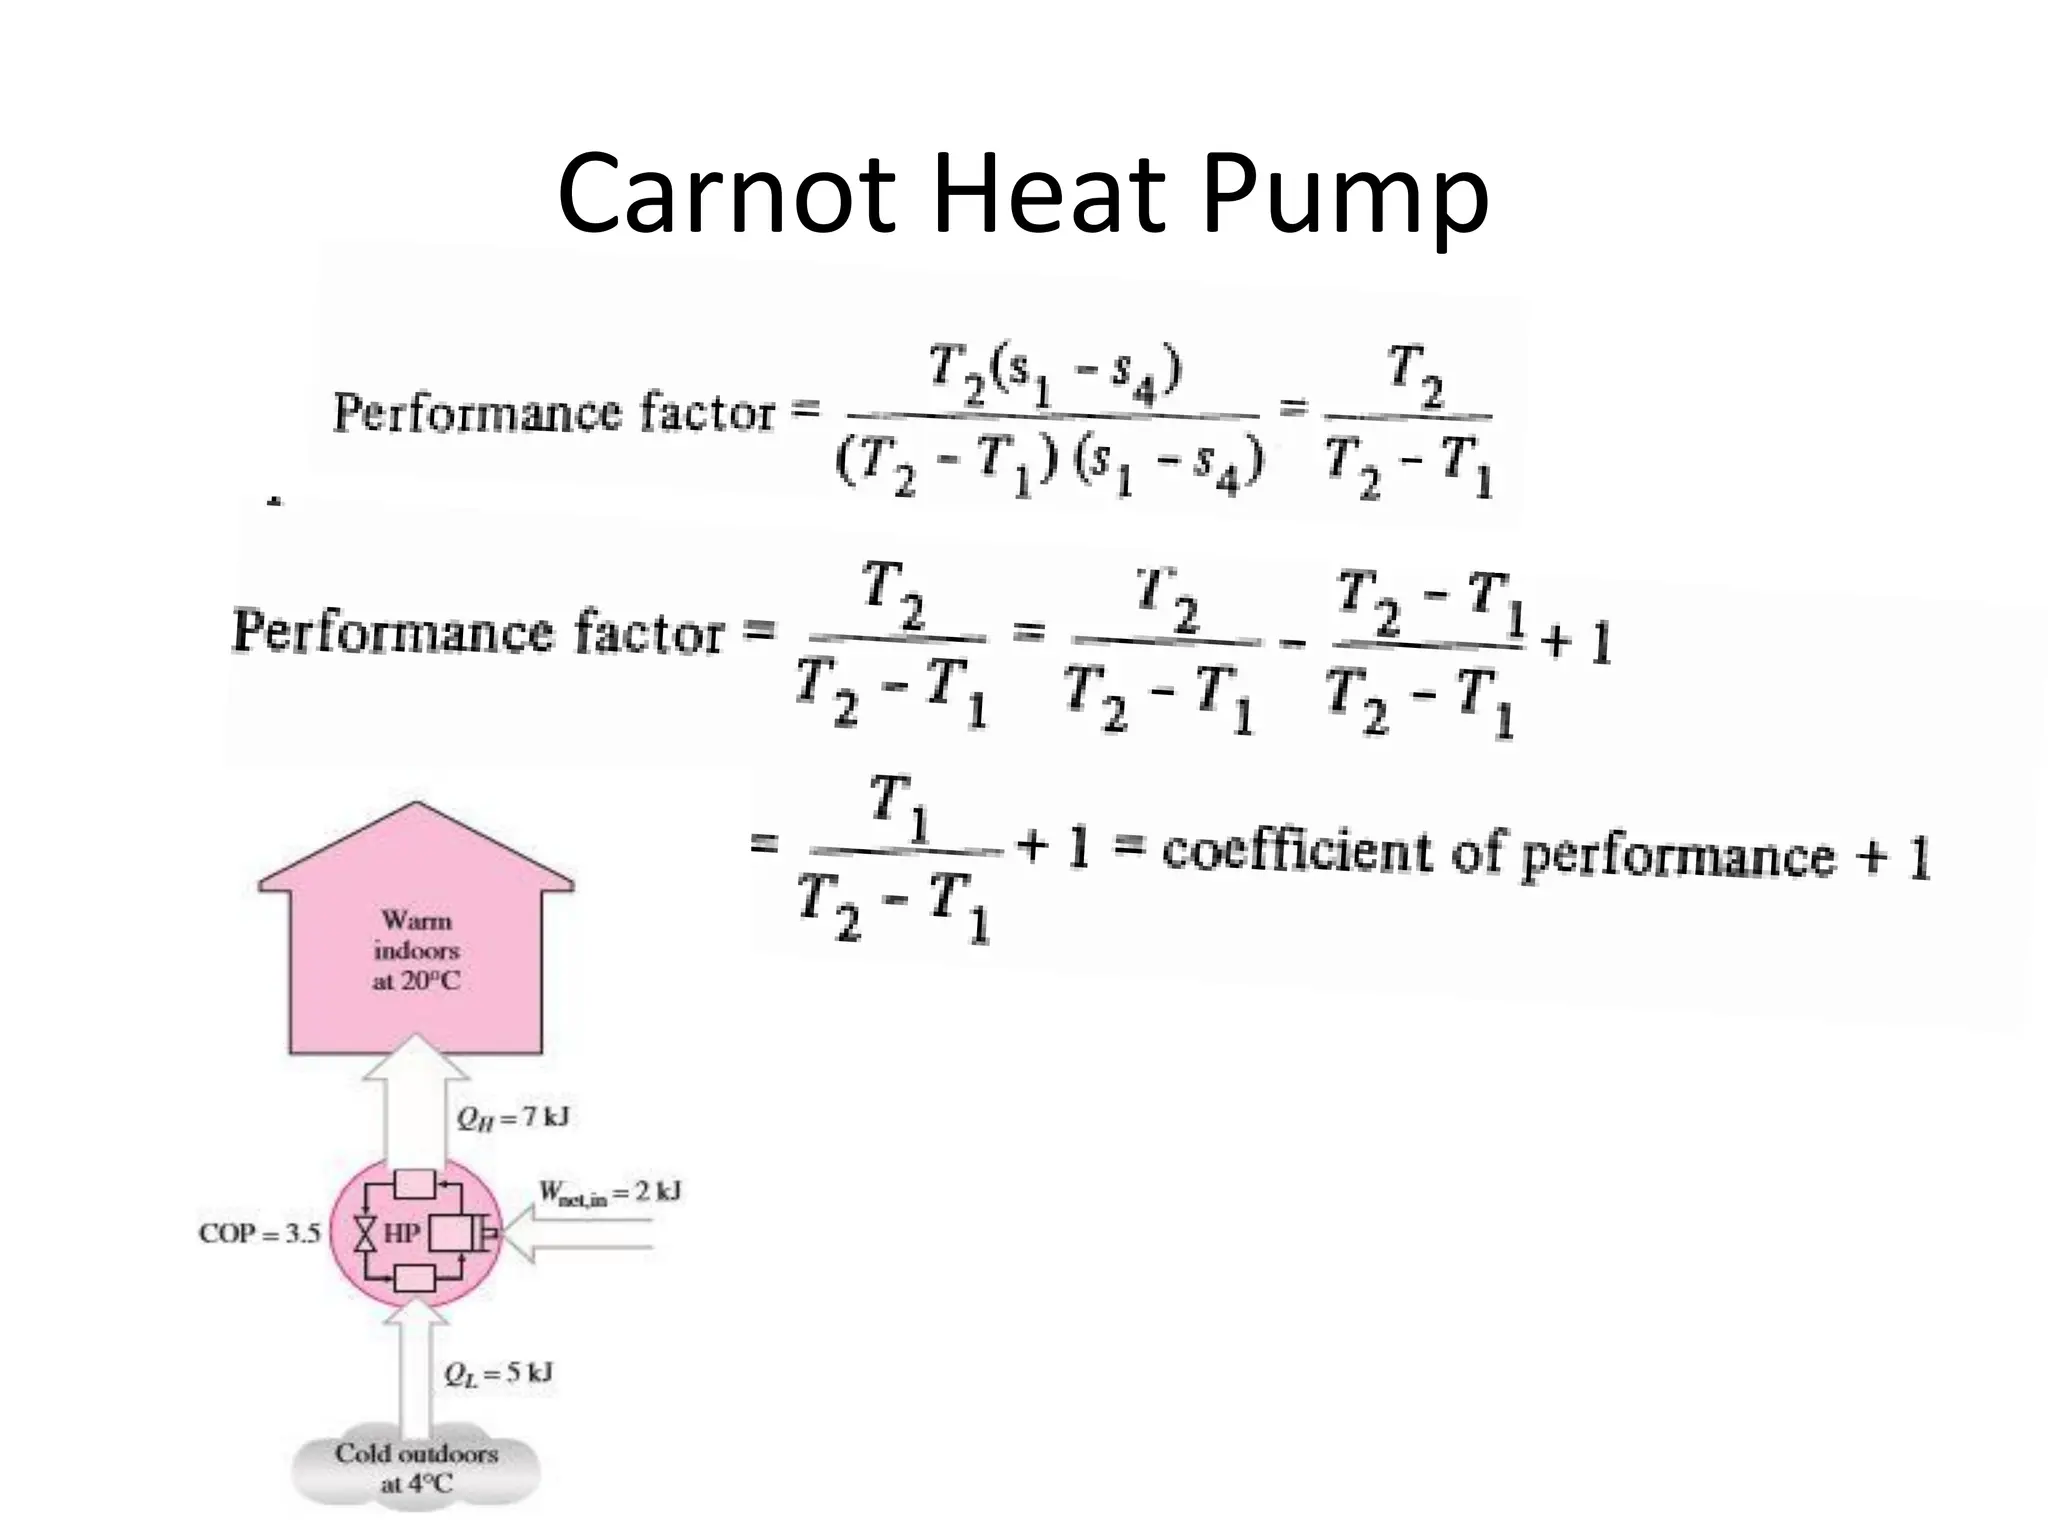
Carnot Heat Pump
•Although a heat pump is same as refrigeration
system, however, its purpose of use is different.
• Therefore, we can not use the terms efficiency and
COP for the performance check
• We define a new term “performance factor”
Replicating Carnot RefrigerationCycle
• Since Carnot Refrigeration Cycle is the most efficient
cycle we try to replicate actual cycle close to it.
• At least we should try to keep the rectangular shape
• How is that possible?
• For any gas the cycle
22.
Previous Cycle usingideal gas Cycle using gas as a refrigerant
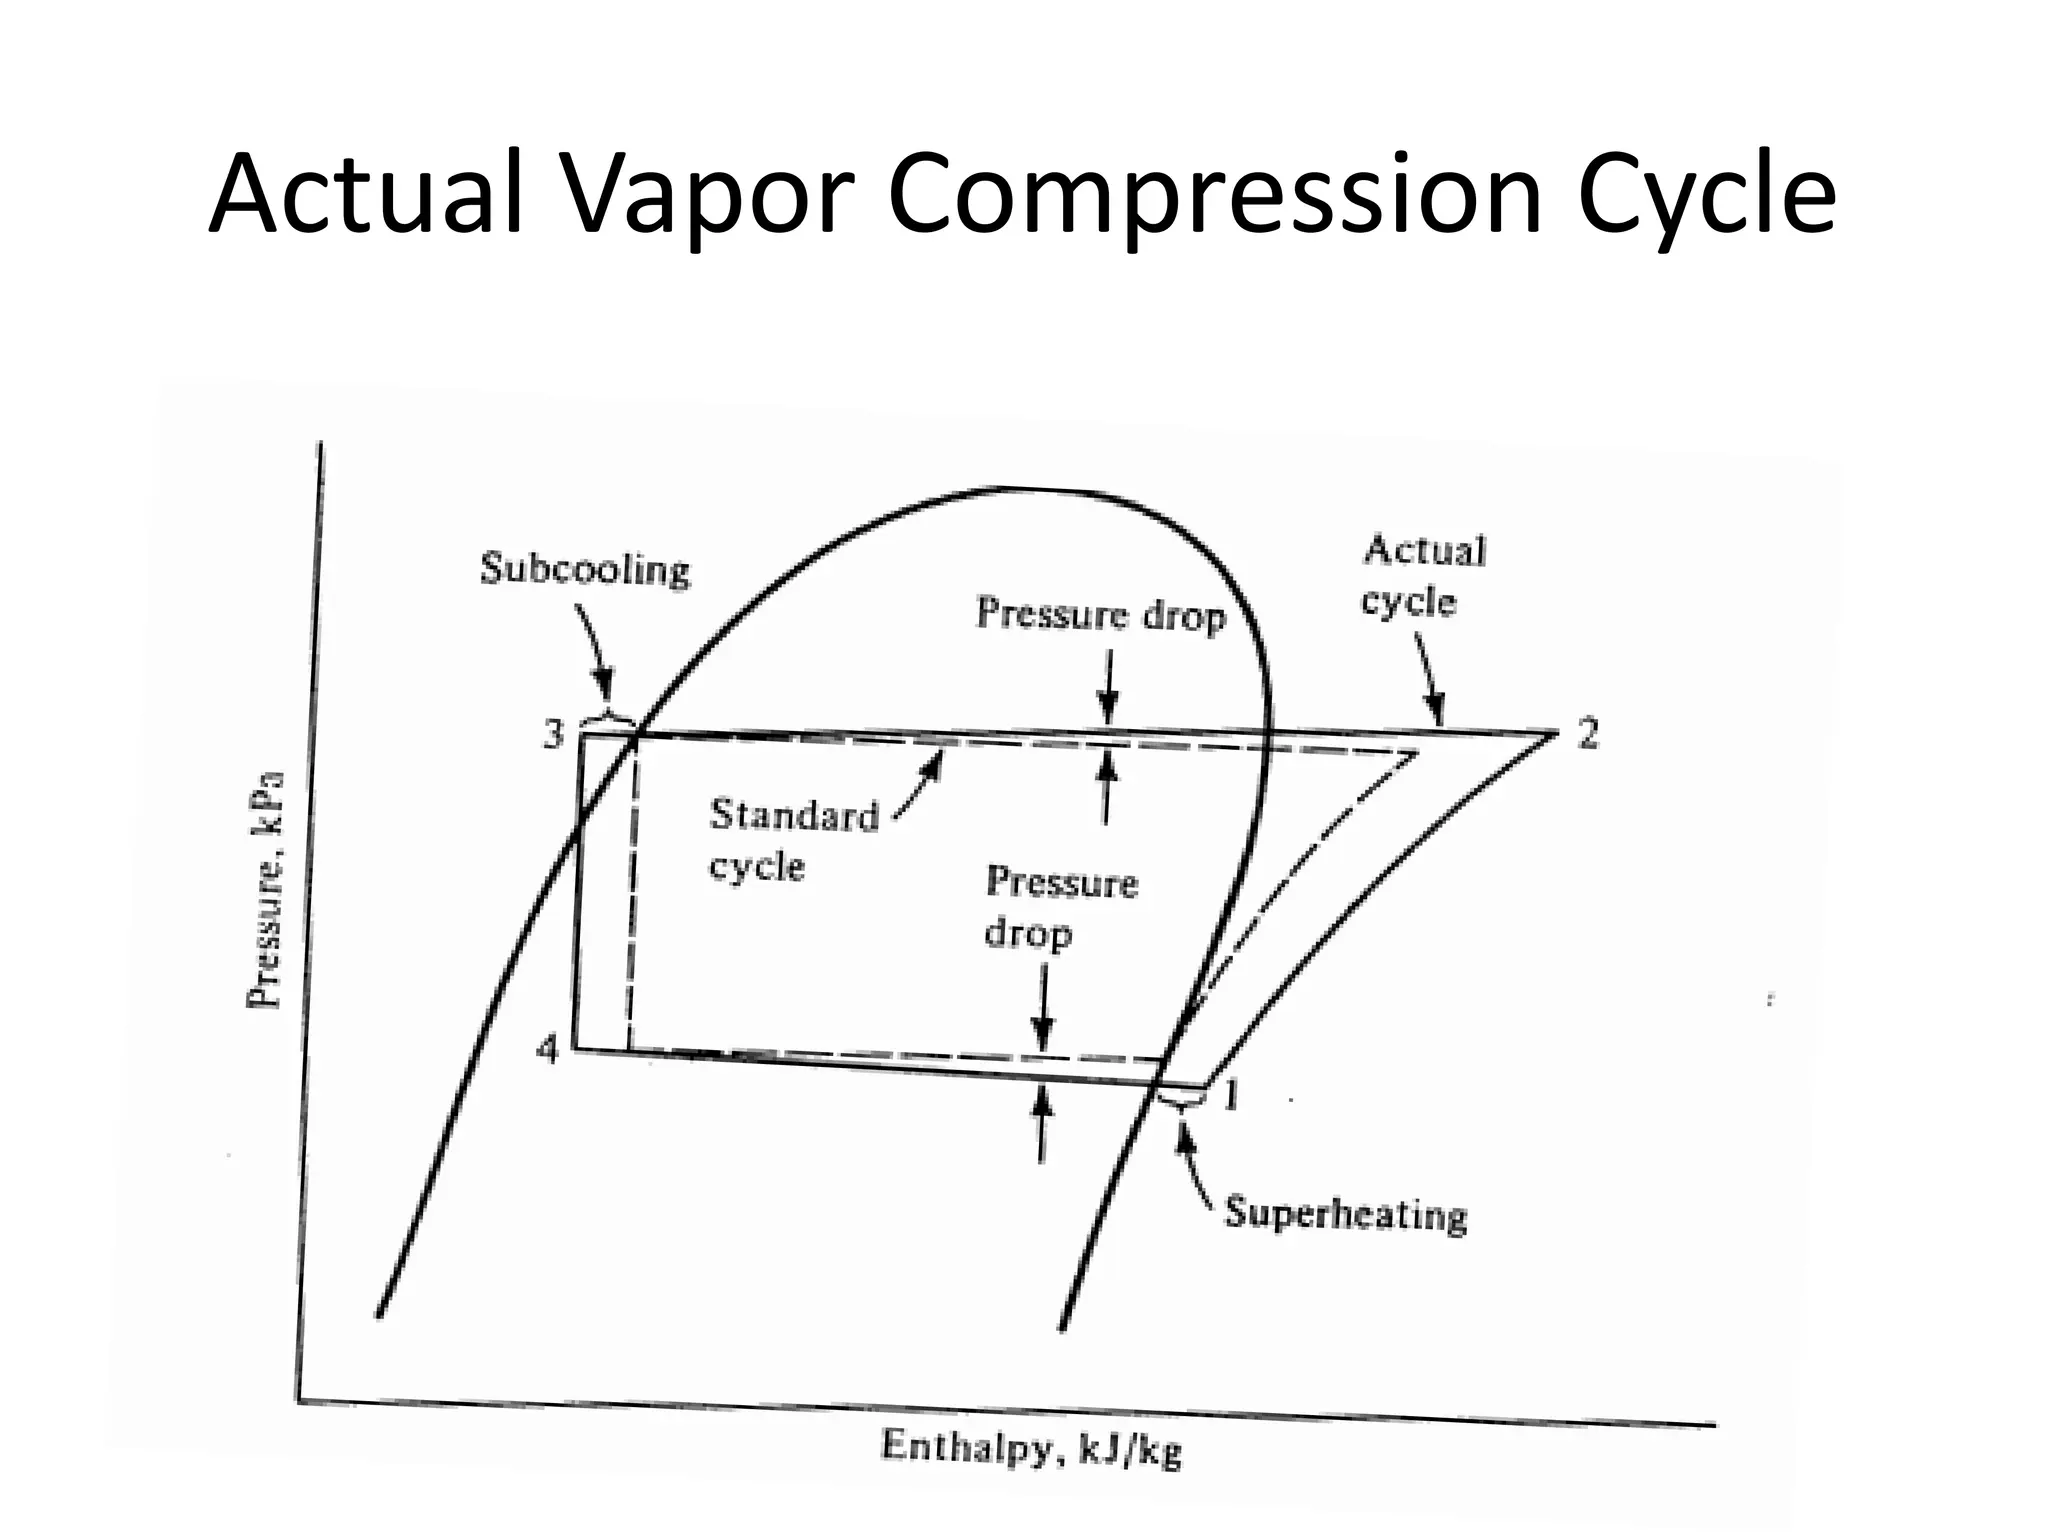
This cycle differs from the Carnot cycle operating between the two temperatures by the addition
of areas x and y. At pt. 4 the temperature must be lower than the cold room temperature so that
as the gas receives heat in the constant pressure process it rises up to a temperature no higher
than that of the cold room. For similar reasons, T2, must be above the atmospheric
temperature. The effect of area x is to increase the work required, which decreases the COP. The
effect of area y is to increase the work required and to decrease the amount of refrigeration.
Both these effects of area y reduce the coefficient of performance.
1. Practical Revisionof Carnot Cycle
• Problems in Wet
Compression
– Problems in piston
– Extra wear and tear
• So we use Dry
Compression
– Loss of rectangular shape
– Additional work done
25.
2. Practical Revisionof Carnot Cycle
• Isentropic Expansion is practically not possible.
– Work derived is negligible compared to compressor
work
– Its difficult to use two phase fluid in a turbine
– Cost is not justified
• So we use an expansion valve instead of an
expansion engine.
• Constant enthalpy process
26.
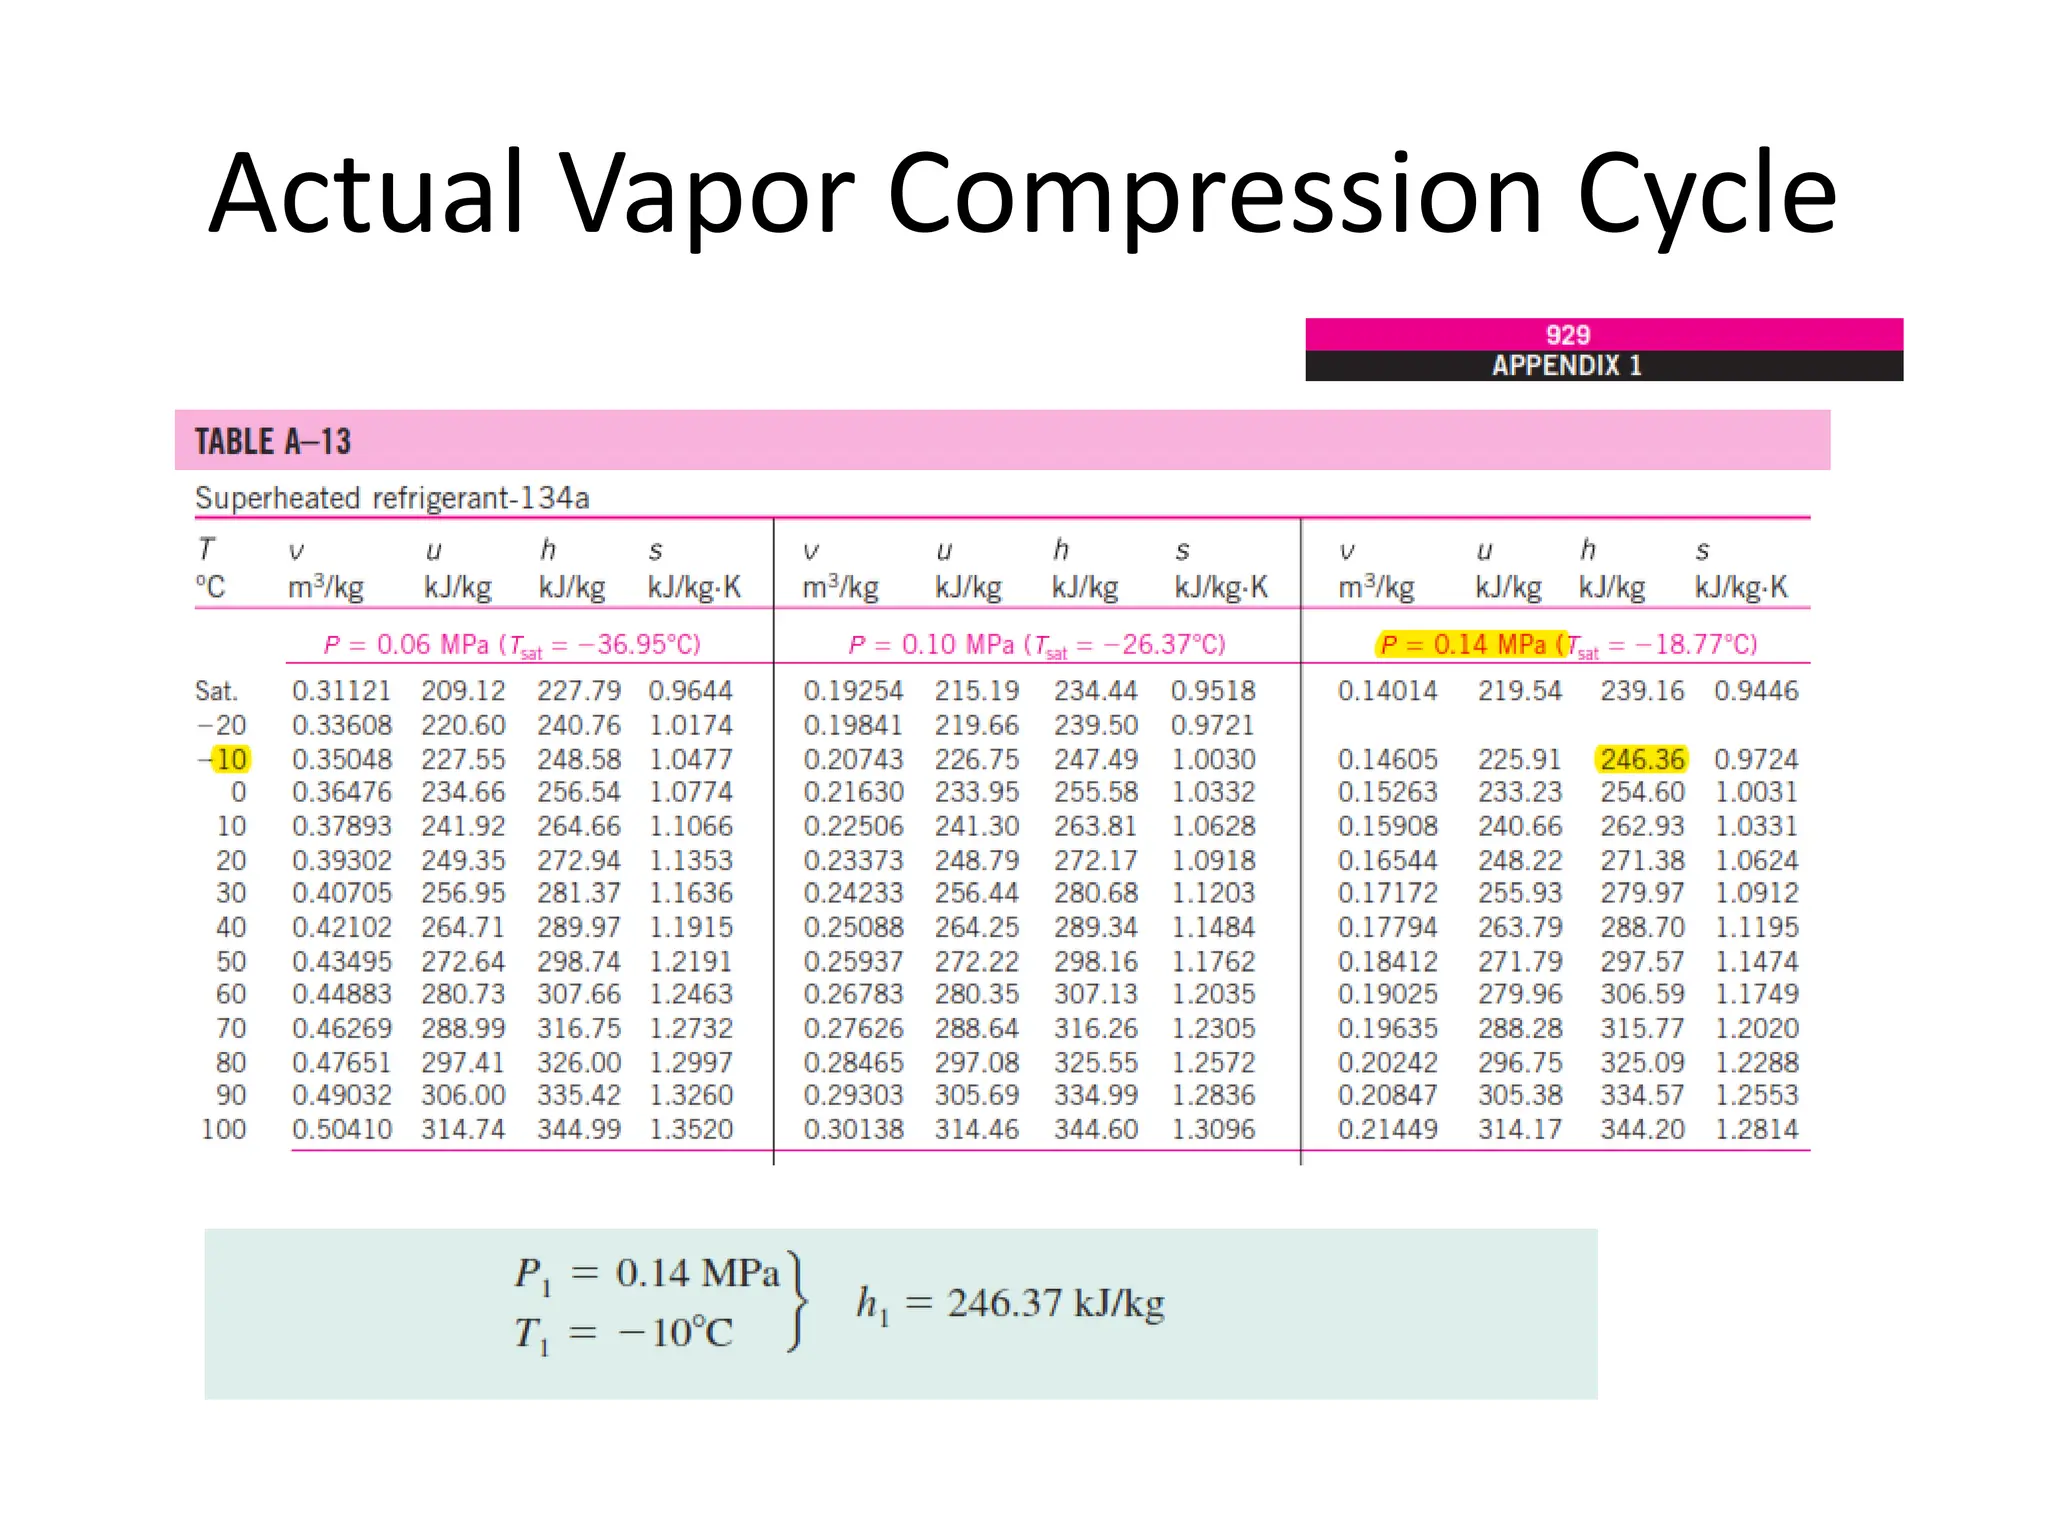
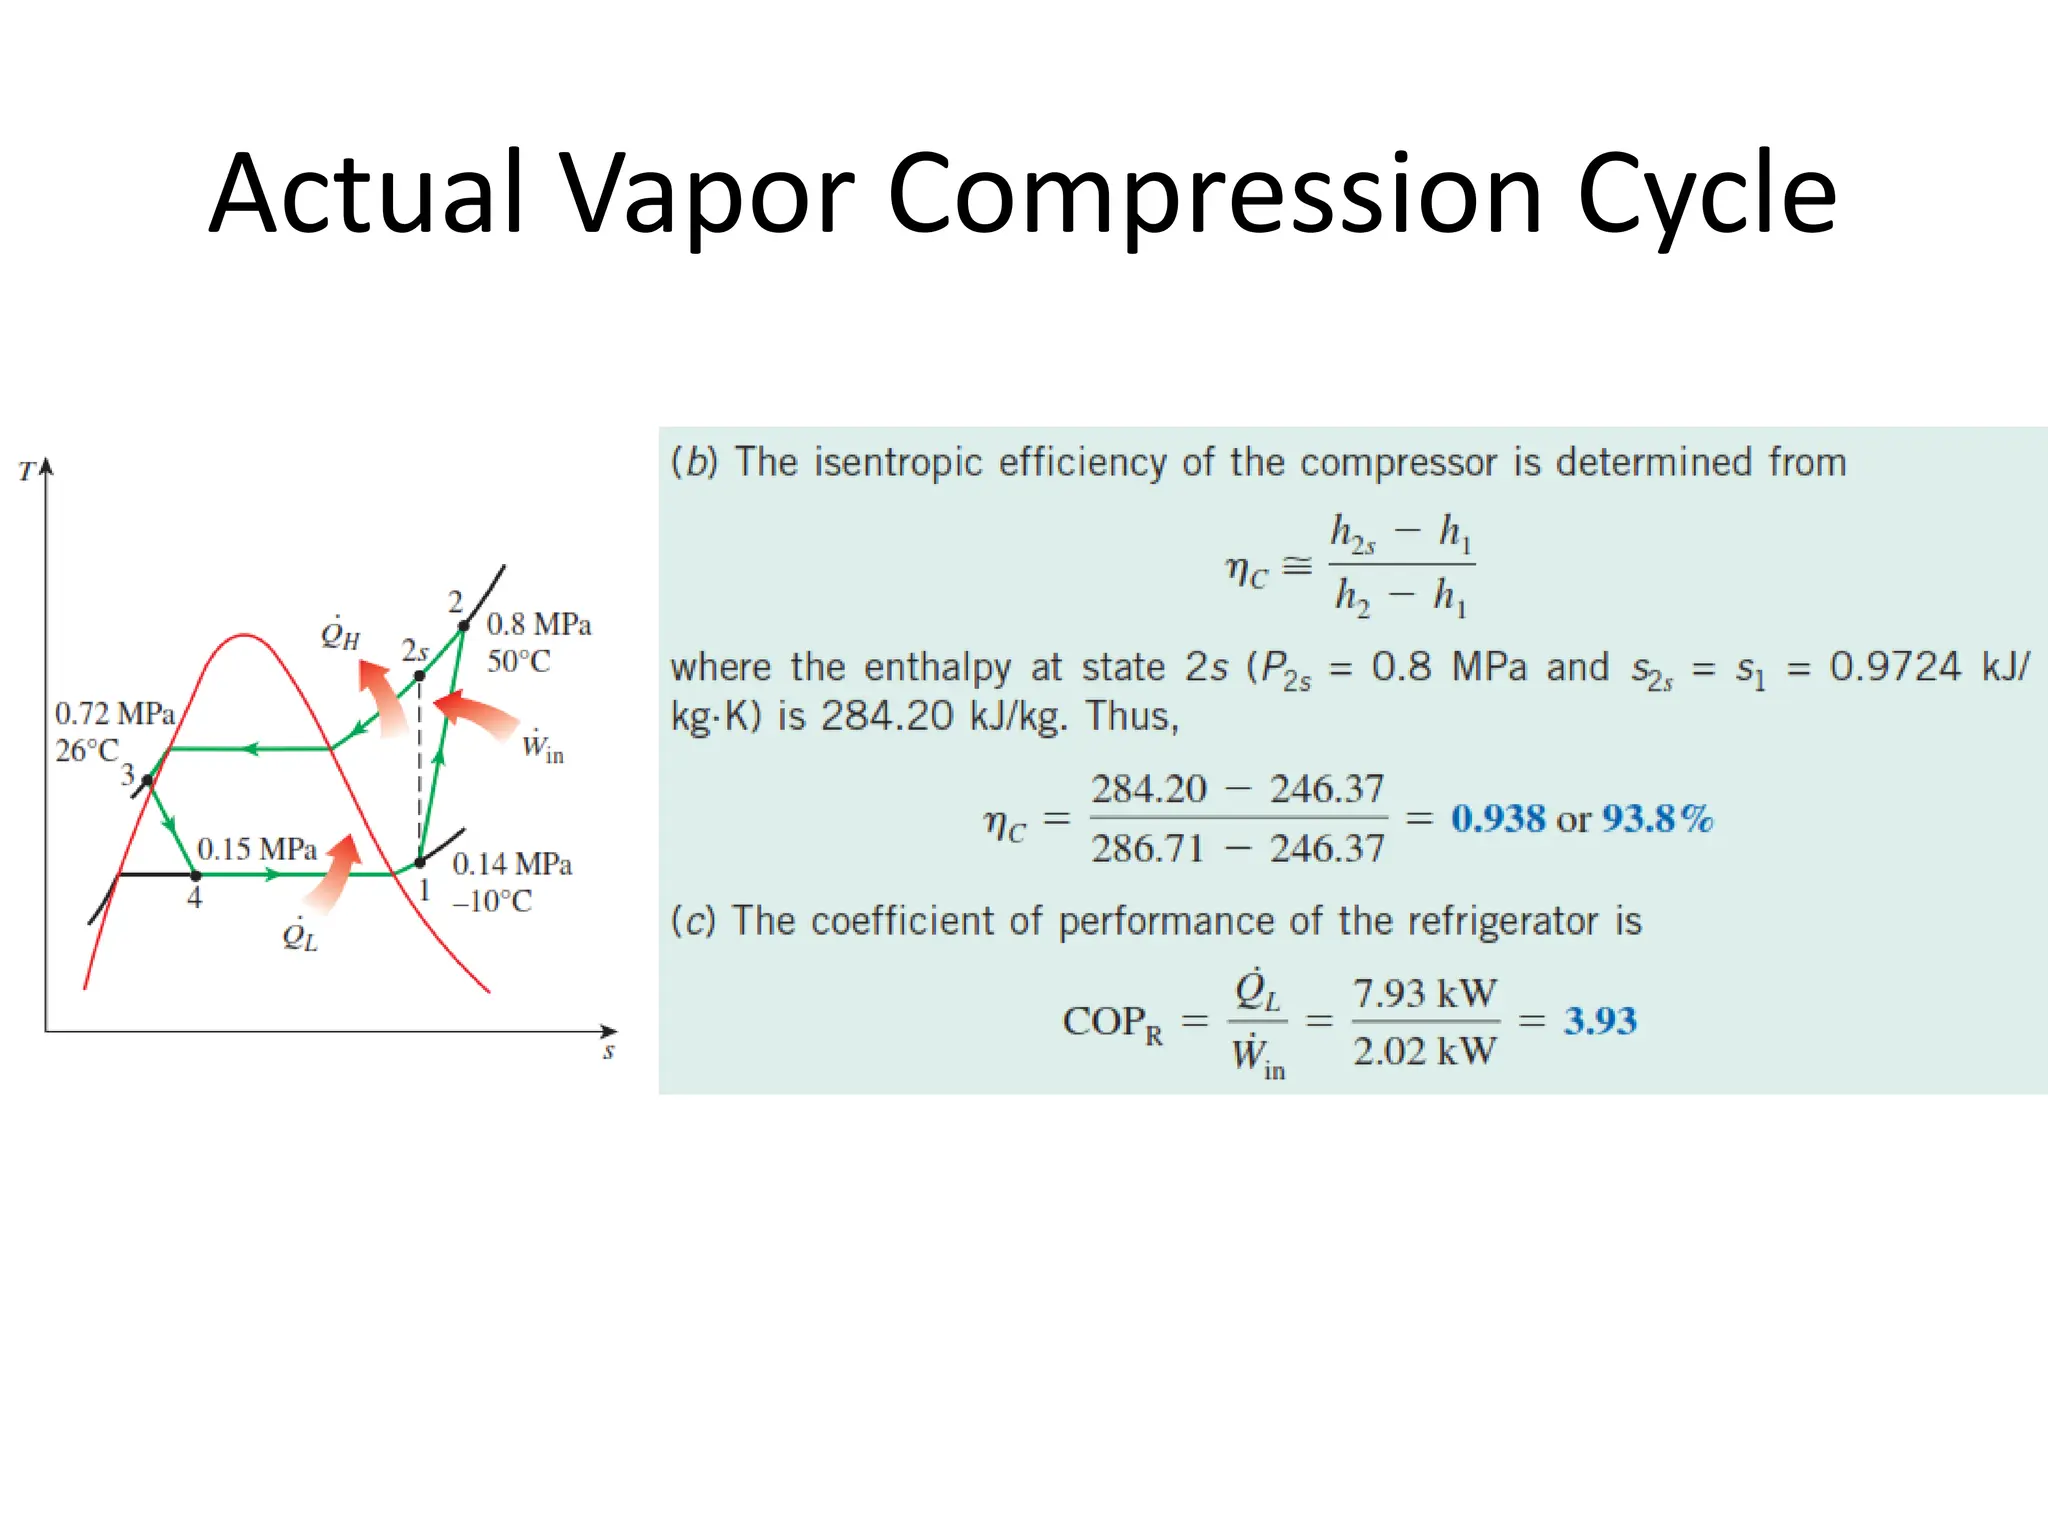
Performance of thestandard vapor
compression cycle
Mollier chart (P-h diagram) vs T-s diagram
Performance of thestandard vapor
compression cycle
• Work of Compression:
• Heat Rejection:
• Refrigeration Effect:
• COP:
• Power/unit
Refrigeration:
With the help of P-h diagram we can calculate different energies easily.
Vapor Compression Cycle
•11–13 A refrigerator uses refrigerant-134a as the working fluid and operates on an
ideal vapor-compression refrigeration cycle between 0.12 and 0.7 MPa. The mass
flow rate of the refrigerant is 0.05 kg/s. Show the cycle on a T-s diagram with
respect to saturation lines. Determine (a) the rate of heat removal from the
refrigerated space and the power input to the compressor, (b) the rate of heat
rejection to the environment, and (c) the coefficient of performance.
34.
Vapor Compression Cycle
•11–13 A refrigerator uses refrigerant-134a as the working fluid and operates on an ideal vapor-
compression refrigeration cycle between 0.12 and 0.7 MPa. The mass flow rate of the refrigerant is 0.05
kg/s. Show the cycle on a T-s diagram with respect to saturation lines. Determine (a) the rate of heat
removal from the refrigerated space and the power input to the compressor, (b) the rate of heat
rejection to the environment, and (c) the coefficient of performance.
35.
Vapor Compression Cycle
•11–13 A refrigerator uses refrigerant-134a as the working fluid and operates on an ideal vapor-
compression refrigeration cycle between 0.12 and 0.7 MPa. The mass flow rate of the refrigerant is 0.05
kg/s. Show the cycle on a T-s diagram with respect to saturation lines. Determine (a) the rate of heat
removal from the refrigerated space and the power input to the compressor, (b) the rate of heat
rejection to the environment, and (c) the coefficient of performance.
36.
Vapor Compression Cycle
•11–13 A refrigerator uses refrigerant-134a as the working fluid and operates on an ideal vapor-
compression refrigeration cycle between 0.12 and 0.7 MPa. The mass flow rate of the refrigerant is 0.05
kg/s. Show the cycle on a T-s diagram with respect to saturation lines. Determine (a) the rate of heat
removal from the refrigerated space and the power input to the compressor, (b) the rate of heat
rejection to the environment, and (c) the coefficient of performance.
37.
Vapor Compression Cycle
•11–13 A refrigerator uses refrigerant-134a as the working fluid and operates on an ideal vapor-
compression refrigeration cycle between 0.12 and 0.7 MPa. The mass flow rate of the refrigerant is 0.05
kg/s. Show the cycle on a T-s diagram with respect to saturation lines. Determine (a) the rate of heat
removal from the refrigerated space and the power input to the compressor, (b) the rate of heat
rejection to the environment, and (c) the coefficient of performance.
Air-conditioner
• Performance ofair-conditioners expressed in terms of the energy
efficiency rating (EER).
EER = 3.412 COPR
• EER between 8 and 12 (a COP of 2.3 to 3.5).
• High-efficiency heat pump manufactured by the Trane Company
using a reciprocating variable-speed compressor is reported to have
a COP of 3.3 in the heating mode and an EER of 16.9 (COP of 5.0) in
the air-conditioning mode.
46.
Refrigerators
The COPs ofrefrigerators are in
the range of:
2.6–3.0 for cutting and
preparation rooms;
2.3–2.6 for meat, deli, dairy, and
produce;
1.2–1.5 for frozen foods;
and 1.0–1.2 for ice cream units.
• The EER or COP of a refrigerator decreases with decreasing
refrigeration temperature thus it is not economical to refrigerate to
lower temperature than needed.
Problems in singlestage VC Cycle
• This is a single stage compression
and single stage evaporation cycle
• One low pressure and one high
pressure.
• However, there are inefficiencies
and practical difficulties
associated with large temperature
differences
49.
Problems in singlestage VC Cycle
• As the temperature difference
increases
– Throttling losses increase
– Superheat losses increase
– Compressor discharge
temperature increases
– Quality of the vapor at the
inlet to the evaporator
increases
– Refrigeration effect decreases
– Work of compression
increases
50.
Flash Gas (toget more liq. in evap. coil)
• During throttling process in high temperature
difference, lot of fluid is converted into vapor and
this is called Flash Gas.
• In order to have effective refrigeration we need a
low quality vapor (i.e. more liquid) at the inlet of
evaporator.
• Flash gas does not contribute in refrigeration
rather it increases the pressure drop in
evaporator
• So we recompress the flash gas.
Multistage VC Cycles
•As a solution multi-compressor or multi-evaporators
are used
• More than two evaporators/compressors are
possible to achieve a very low temperature
• Multistage refrigeration are also used when
refrigeration effect at two different temperatures are
required
• For example: ice cream making at -30C and milk
storage at 2C
53.
Inter-cooling
It can beseen that specific work input reduces as specific volume (v) is reduced. At
a given pressure, the specific volume can be reduced by reducing the temperature.
This is the principle behind intercooling in multi-stage compression.
54.
Inter-cooling during compression
•Inter-cooling reduces the
amount of work required to
compress the gas.
• Inter-cooling also decreases
compressor discharge
temperature.
• Inter-cooling can be achieved
by water cooling
• Other method is to intercool in
the flash tank
Optimum intermediate pressure:
INTERCOOLING BY USINGFLASH TANK AS AN INTERCOOLER
• Inter-cooling using liquid refrigerant from condenser in the flash tank
may or may not reduce the power input to the system, as it depends
upon the nature of the refrigerant.
• This is due to the fact that the heat rejected by the refrigerant during
inter-cooling generates additional vapor in the flash tank, which has to
be compressed by the high stage compressor.
• Thus the mass flow rate of refrigerant through the high stage
compressor will be more than that of the low stage compressor.
58.
INTERCOOLING BY USINGFLASH TANK AS AN INTERCOOLER:
• Whether total power input to the system decreases or not depends on
whether the increased power consumption due to higher mass flow
rate is compensated by reduction in specific work of compression or
not.
• For ammonia, the power input usually decreases with inter-cooling by
liquid refrigerant, however, for refrigerants such as R12, R22, the
power input marginally increases. Thus inter-cooling using liquid
refrigerant is not effective for R12 and R22.
• However, as mentioned one benefit of inter-cooling is the reduction in
compressor discharge temperature, which leads to better compressor
lubrication and its longer life.
59.
INTERCOOLING BY USINGFLASH TANK AS AN INTERCOOLER:
• It is also possible to intercool the refrigerant vapor by a combination of
water-cooled heat exchanger and the refrigerant liquid in the flash
tank.
• As a result of using both water cooling and flash-tank, the amount of
refrigerant vapor handled by the high-stage compressor reduces
leading to lower power consumption. However, the possibility of this
again depends on the availability of cooling water at required
temperature.
LIQUID RECIRCULATION SYSTEM:
Thequantity of liquid supplied to each evaporator is in excess of that which will be
vaporized. This results in liquid refrigerant leaving the evaporator along with the vapor
generated in the refrigeration process. Excess liquid is called overfeed (the alternate name
for recirculation systems is overfeed systems). The overfeed returns with the vapor from
many evaporators to the recirculation vessel (separation vessel).
70.
LIQUID RECIRCULATION SYSTEM:
Theseoverfeed quantities may seem wasteful and unnecessary, but they perform the
important function of totally wetting the inside of the evaporator coil surface with liquid
refrigerant from the beginning to the end of the coil. This gives the highest heat transfer
coefficient and optimizes the coil surface, which results in the smallest coil for a given
capacity.
Cascaded Refrigeration system
•Some industrial applications require
moderately low temperatures, and the
temperature range they involve may be too
large for a single vapor-compression
refrigeration cycle to be practical
• The compressor work decreases and the
amount of heat absorbed from the
refrigerated space increases as a result of
cascading.
• In actual cascade refrigeration systems, the
two cycles would overlap somewhat since a
temperature difference between the two
fluids is needed for any heat transfer to take
place.


![Refregeration & Air Conditioning[1].pptx](https://cdn.slidesharecdn.com/ss_thumbnails/refregerationairconditioning1-251006061651-30262e8a-thumbnail.jpg?width=640&height=640&fit=bounds)


