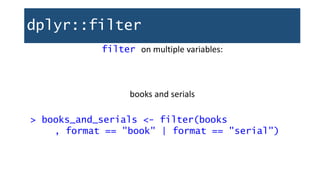
This document provides an outline for exploring data in R. It discusses loading packages like tidyverse and reading data into R from files. Common functions for exploring data frames are demonstrated, like dim(), str(), and table(). Data manipulation with dplyr is explained through functions like filter(), select(), arrange(), and mutate() to subset, select variables, sort, and create new variables. Pipe operators (%>%) can combine multiple data transformation steps into a readable workflow.

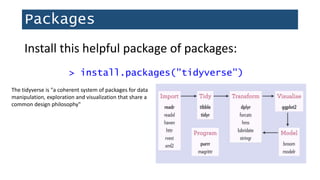
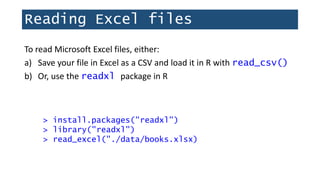
![Set your working directory
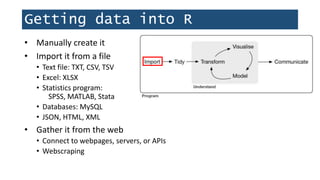
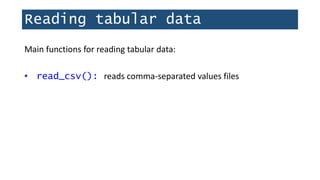
> getwd()
[1] "C:/Users/iakovakis/Desktop/r.workshop.files"
Print the current working directory to the console:](https://image.slidesharecdn.com/1-230720065137-709aa774/85/1-R_For_Libraries_Session_2_-_Data_Exploration-pptx-12-320.jpg)
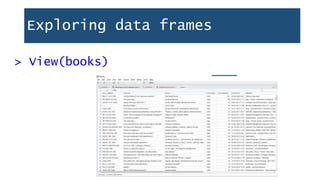
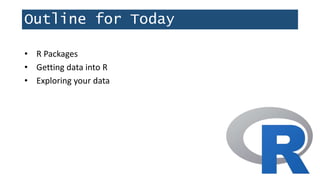
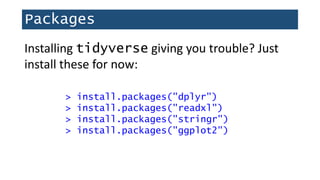
![Exploring data frames
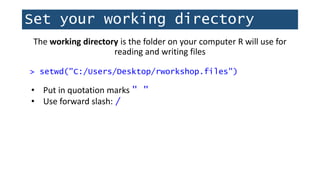
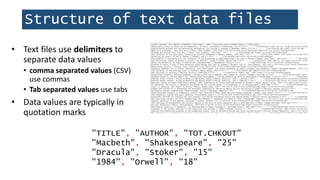
> dim(books)
[1] 4000 12
> nrow(books)
[1] 4000
> ncol(books)
[1] 12
Dimensions:
4,000 rows, 12 columns
Number of rows
Number of columns](https://image.slidesharecdn.com/1-230720065137-709aa774/85/1-R_For_Libraries_Session_2_-_Data_Exploration-pptx-20-320.jpg)
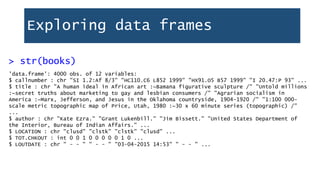
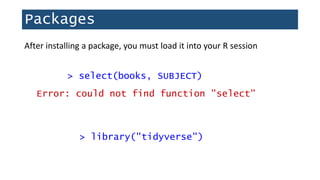
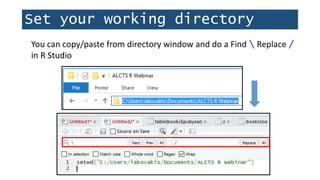
![Exploring vectors
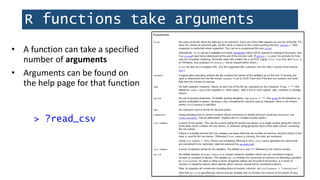
> str(books$LOCATION)
chr [1:4000] "clstk" "clstk" "clstk" "clstk" "clstk"...
Use the dollar sign $ to specify a variable in a data frame](https://image.slidesharecdn.com/1-230720065137-709aa774/85/1-R_For_Libraries_Session_2_-_Data_Exploration-pptx-22-320.jpg)
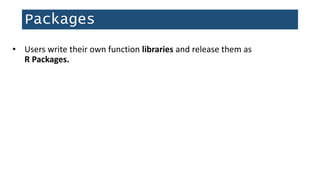
![unique()
unique() returns all the distinct values in a variable
> unique(books$LOCATION)
[1] clcdr clchi clcir clcre clfhd clids cljre cljuv clref clrsd clstk clthe cltxd clua clusd
In this case, it displays all unique book location codes.](https://image.slidesharecdn.com/1-230720065137-709aa774/85/1-R_For_Libraries_Session_2_-_Data_Exploration-pptx-23-320.jpg)
![duplicated()
duplicated() will give you a logical vector of duplicated values
> z <- c("111", "222", "111", "333", "444")
> duplicated(z)
[1] FALSE FALSE TRUE FALSE FALSE
> !duplicated(z)
[1] TRUE TRUE FALSE TRUE TRUE](https://image.slidesharecdn.com/1-230720065137-709aa774/85/1-R_For_Libraries_Session_2_-_Data_Exploration-pptx-25-320.jpg)
![duplicated()
Use duplicated() nested in table() to find out how many
values are dupes
> table(duplicated(z))
FALSE TRUE
4 1
Use which() to identify the duplicated element
> which(duplicated(z))
[1] 3](https://image.slidesharecdn.com/1-230720065137-709aa774/85/1-R_For_Libraries_Session_2_-_Data_Exploration-pptx-26-320.jpg)
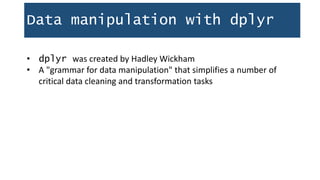
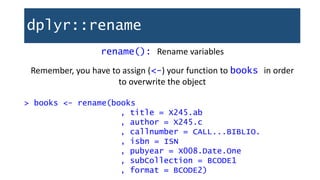
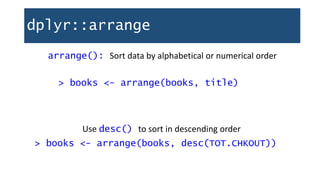
![dplyr::rename
> names(books)
[1] "CALL...BIBLIO." "X245.ab" "X245.c" "LOCATION"
"TOT.CHKOUT" "LOUTDATE"
[7] "SUBJECT" "ISN" "CALL...ITEM." "X008.Date.One"
"BCODE2" "BCODE1"](https://image.slidesharecdn.com/1-230720065137-709aa774/85/1-R_For_Libraries_Session_2_-_Data_Exploration-pptx-31-320.jpg)
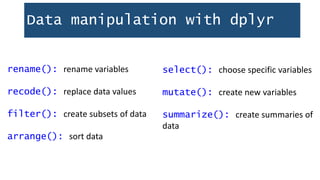
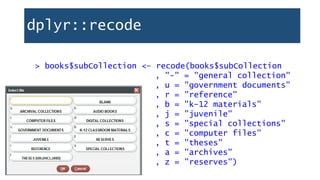
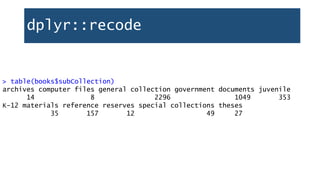
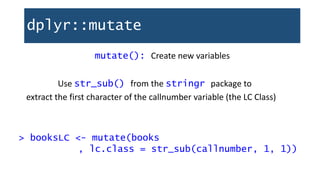
![dplyr::recode
recode(): replace data values
First, use unique() to see all elements in a variable
> unique(books$subCollection)
[1] "u" "-" "j" "r" "b" "a" "s" "c" "t" "z"](https://image.slidesharecdn.com/1-230720065137-709aa774/85/1-R_For_Libraries_Session_2_-_Data_Exploration-pptx-33-320.jpg)
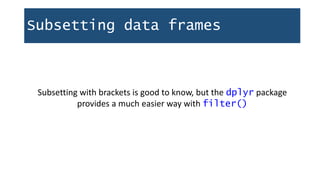
![Subsetting data frames
In the same way you use brackets [] to subset vectors, you also use
them to subset data frames.
> scale <- c("do", "re", "mi", "fa", "so")
> scale[1]
[1] "do"
However, vectors have only one direction, but dataframes have two.
myDataFrame[row, column]](https://image.slidesharecdn.com/1-230720065137-709aa774/85/1-R_For_Libraries_Session_2_-_Data_Exploration-pptx-36-320.jpg)
![Subsetting data frames
> books[5, 2]
[1] "Fear of intimacy / "
Can also use column names:
> books[5, c("title", "TOT.CHKOUT")]
title TOT.CHKOUT
5 Fear of intimacy / 7](https://image.slidesharecdn.com/1-230720065137-709aa774/85/1-R_For_Libraries_Session_2_-_Data_Exploration-pptx-37-320.jpg)
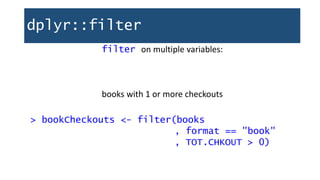
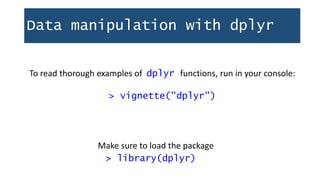
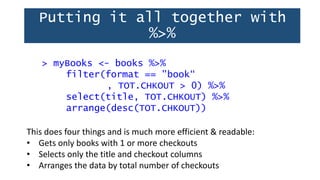
![dplyr::filter
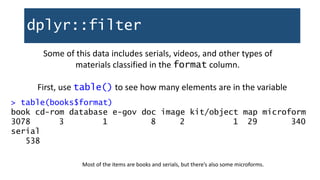
How many are there?
> nrow(bookCheckouts)
[1] 3616
What percentage is that of all books?
> nrow(bookCheckouts)/nrow(booksOnly) * 100
[1] 63.93762
…not bad!](https://image.slidesharecdn.com/1-230720065137-709aa774/85/1-R_For_Libraries_Session_2_-_Data_Exploration-pptx-45-320.jpg)
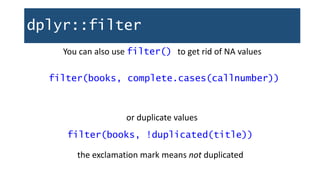
![dplyr::select
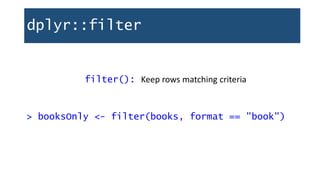
select(): Keep (or remove) only the variables you mention
> booksTitleCheckouts <- select(books, title,
TOT.CHKOUT)
> dim(booksTitleCheckouts)
[1] 10000 2](https://image.slidesharecdn.com/1-230720065137-709aa774/85/1-R_For_Libraries_Session_2_-_Data_Exploration-pptx-47-320.jpg)


![[1062BPY12001] Data analysis with R / week 2](https://cdn.slidesharecdn.com/ss_thumbnails/dataanalyzer01-180307063046-thumbnail.jpg?width=640&height=640&fit=bounds)