꧁❤ Hauz Khas Call Girls Service Hauz Khas Delhi ❤꧂ 9999965857 ☎️ Hard And Sex...
Organizational, Process and Relationship Factors Impact Internal Audit Effectiveness
1. International Journal of Business and Management; Vol. 13, No. 6; 2018
ISSN 1833-3850 E-ISSN 1833-8119
Published by Canadian Center of Science and Education
238
The Internal Audit Effectiveness Evaluated with an Organizational,
Process and Relationship Perspective
Stefano Azzali1
& Tatiana Mazza2
1
University of Parma, Parma, Italy
2
Free University of Bozen, Bolzano, Italy
Correspondence: Tatiana Mazza, Free University of Bozen, Bolzano, Italy, piazza Università, 1, 39100 Bolzano,
Italy. E-mail: tatiana.mazza@unibz.it
Received: October 23, 2018 Accepted: March 30, 2018 Online Published: May 15, 2018
doi:10.5539/ijbm.v13n6p238 URL: https://doi.org/10.5539/ijbm.v13n6p238
Abstract
Using a unique database of Italian companies, we perform structural equation modeling technique to test the
association between organizational, processes and relationship measure of internal audit effectiveness and firm
pressures and performances. We find that size, listing and Big4 are significantly and positively associated with
the internal audit effectiveness. We contribute to literature showing that organizational (e.g. presence of a charter,
chief auditing executive experience), processes (audit plan risk based, quality assurance program, guidelines),
and relationship (with auditee, senior management, chief financial officer, audit committee) measures are useful
to evaluate the internal audit effectiveness. We provide support for profession, agency and institutional theories.
We implement the measure of internal audit effectiveness with a structural equation model to be able to consider
the different components of organizational, processes and relationship separately in a single model. Extending
previous literature, we show that this measure of internal audit effectiveness is effective in discovering
significant determinant of internal audit effectiveness and could be used in future research.
Keywords: agency theory, Big4, internal audit, performance, structural equation model
1. Introduction
The research aims to test the association between organizational, processes and relationship measure of internal
audit effectiveness and firm pressures and performances indicators. Analyzing literature about IA effectiveness,
we find research developing several measures of IA effectiveness and theories useful to border our framework.
However, for the best of our knowledge, none of the studies use IA effectiveness evaluated with an
organizational, process and relationship perspective in a structural equation model. This methodology helps in
analyzing organizational, process and relationship as different aspects that measure audit quality from different
perspective (first order construct) and that together form a single measure of IA effectiveness (second order
construct). We use the agency theory, institutional and profession theories to explain the different perspectives of
organizational, process and relationship. Following profession theory, IA effectiveness is measured with
organization because internal auditor acts to advocate the profession developing the function inside the
organization. Following agency theory, IA effectiveness is measured with process because internal auditor as
agent act for the benefit of the manager as principal that ask for effective actions in the process. Following
institutional theory, IA effectiveness is measured with relationships with managers because the objectives and
their achievement depend on the goals set out by the management, that act as institutional pressures.
We develop two hypotheses to measure the IA effectiveness. The first Hypothesis tests the association between
listing status, size, consolidate financial statement and Big4 with IA effectiveness. The second hypothesis tests
the association between firm performances (loss, return on assets, cash flow from operations and their volatility)
and IA effectiveness. These independent variables, widely used in accounting and auditing research, can be very
useful also as determinants of IA effectiveness, interpreted in turn as a set of variables grouped in the three
classes of organizational, process and relationship.
In collaboration with the Italian association of internal auditors and a Big4, we develop a questionnaire. We
tested it on firms on the target population. The 128 companies’ answers allow us to test the measure of IA
2. ijbm.ccsenet.org International Journal of Business and Management Vol. 13, No. 6; 2018
239
effectiveness in a unique database with empirical analyses. We also test the common method and non-response
bias.
Results show that all our analytical variables selected to measure IA effectiveness are positive and significant at
0.01 level related to it. All are very useful to measure IA effectiveness. Moreover, we find that organizational,
process and relationship, grouping the analytical variables in a valid and reliable structure, are also very useful to
measure IA effectiveness, given their positive and significant relation with IA effectiveness latent variable.
Given these strong results to measure IA effectiveness, we show its determinants in term of firms’ pressure and
performance. We show that listed companies, larger firms and firms audited by Big4 have a positive association
with IA effectiveness. We confirm our expectation incentives towards control and transparency coming from
listing status and Big4 and higher resources coming from firm size are important determinants of IA
effectiveness.
We contribute to literature in several ways. Firstly, we extend Lenz et al. (2014) model, performing an empirical
analysis on a large sample of chief audit executives in Italy. Secondly, we propose a measure of IA effectiveness
using a structural equation model showing empirically that all the variables selected grouped in the three classes
of organizational, process and relationship are valid and reliable measures of IA effectiveness. Thirdly, among
performances and incentives indicators, we contribute to literature underling that listing, size and Big4 are
significant determinants. Finally, this first empirical test of the Lenz et al. (2014) model has results that can be
useful for practitioners, identifying the ten variables to measure IA effectiveness and helping in the external
auditor choice.
2. Literature Review
2.1 Internal Audit Effectiveness Measures
IA, together with the audit committee, executive managers and external auditors, is widely recognized as one of
the four cornerstones of corporate governance (Gramling et al., 2004). Prior studies summarize results related to
IA for Europe, United States of America (USA), Asia (Allegrini et al., 2006; Hass et al. 2006; Cooper et al.
2006). Prior literature mainly analyzes the relations between IA and audit committee, executive managers and
external auditors (Raghunandan et al. 2001; Abbott et al., 2010; Sarens & De Beelde, 2006; Sarens, 2009;
Archambeault et al., 2008; Alzeban, 2015), and in other countries (Scarbrough et al., 1998; Goodwin and Yeo,
2001). Some studies employed a single variable to measure IA effectiveness, usually relating to the presence,
size, or extent of investment in IA (Selim et al., 2003, 2009; Abdolmohammadi, 2009; Burnaby et al., 2009;
Carcello et al. 2005a, b; Anderson et al., 2012; Sarens et al., 2011). Given that IA effectiveness is a multifaceted
concept, Lenz et al., (2014) measure it distinguishing factors like organization, resources, processes and
relationships. Jiang et al. (2014a, b) evaluate it with a factor score of competence, independence, planning and
quality assurance. Regoliosi and D’Eri (2014) create a weighted index for it using IA variables related to its
formality, structure, program and activity. Mihret and Yismaw (2007) measure it with staff expertise, scope of
service, effective audit planning, fieldwork and controlling, and effective communication. Arena and Azzone
(2009) evaluate it with the percentage of recommendations suggested by the internal auditors and actually
implemented by the auditees. Cohen and Sayag (2010), based on Ziegenfuss (2000), categorize it into audit
environment, input, process and output. See the literature review by Lenz and Hahn (2015) for the categorization
of the variables used in prior literature.
2.2 Internal Audit Effectiveness Theories
Shamki and Alhajri (2017) investigate IA effectiveness through the lens of agency theory. The principal (the
manager in the case of audit and board of directors in the case of the organization) hires the second party’s
efforts (internal auditor in the case of audit and the manager in case of organization) to perform tasks for the
benefit of principal and on his behalf (Jensen & Meckling, 1976). When internal audit accomplishes its goals,
brings a disciplined and systematic approach to well improve and evaluate risk management's effectiveness,
control and governance processes. Thus, following this theory, IA effectiveness is when IA perform tasks for the
benefit of the manager.
Tackie et al. (2016) investigate IA effectiveness through the lens of profession theory (Abbott, 1988) and
institutional theory. Based on profession theory, Winters (2009) argues that, individual internal auditors can only
achieve their full potential if the profession as such is strengthened. Thus, they act with the purpose to advocate
the profession. Based on institutional theory, when faced with uncertainty, DiMaggio and Powell (1983) suggest
that, as a result of institutional pressures, firms will adopt similar characteristics through the desire to organize
themselves in a manner that is similar to other firms in the same environment. Institutional pressures can be
pressures exerted to establish internal audit departments (Al-Twaijry et al., 2003). The IIA (2010) defines IA
3. ijbm.ccsenet.org International Journal of Business and Management Vol. 13, No. 6; 2018
240
effectiveness as “the degree to which established objectives are achieved.” The objectives of an internal audit
unit for every organization depend on the goals set out by the management of such an organization (Pungas,
2003). The advocation of profession and the institutional pressures, as well as IA effectiveness, are related linked
to the management will.
3. Hypothesis Development
3.1 Internal Audit Effectiveness Evaluated with an Organizational, Process and Relationship Perspective
Following Lenz et al. (2014) and linking the components of IA effectiveness to theories, we develop our
framework of IA effectiveness based on organization, processes and relationships (Note 1). Agency, profession
and institutional theories are related, and all can be used to explain any components of the IA effectiveness. Here,
we propose a link with the three different components of our framework.
IA organization includes variables related to charter, experience and communication. Organization is an
indicator of profession theory that shows how internal auditor acts to advocate the profession having a formal
charter, developing experience in the same profession for years and taking in consideration other control
functions. Firstly, IA effectiveness is positively related with the formally definition of the purpose, authority and
responsibility of the internal audit activity in an internal audit charter (IIA, 2016: standard No 1000). Lenz et al.
(2014) argue that IA that do not have a written IA charter will likely warrant an unsatisfactory rating in quality
assessment, as a written charter is regarded as a minimum. Secondly, auditor's proficiency requires the internal
auditors to be with high skills, knowledge and other competencies to better perform their responsibilities (IIA,
2016: standard No 1210). Auditing general experience is related to audit’s years of experience, training,
knowledge, skills and expertise that can be applied to any client (Wright and Wright 1997). Moreover, it has
been showed that IA experience is positively related to IA effectiveness in many different setting (Shamki &
Alhajri, 2017). Thirdly, in some countries, there are country-specific corporate governance mechanism to take in
consideration. Where there is a statutory board, that is a specific board for financial reporting controls, it is also
important to check the communication between IA and this board to consider effectiveness.
Risk-based, reviewed and guidelines-based processes are an index of better IA effectiveness. Following agency
theory, IA effectiveness is when IA (agent) perform tasks during the process for the benefit of the manager
(principal). These tasks should be risk-based, reviews and guidelines-based to achieve effectiveness. In fact,
following the IIA standards, first of all, IA to be effective should establish a risk-based audit plan to determine
the priorities of the internal audit activity, consistent with the organization’s goals (IIA, 2016: standard No.
2010). Resources are scarce and time is easily wasted if IA looks at the wrong matters, so a risk-based IA
generally helps the chief audit executives and IA staff to focus on what matters most (Lenz et al., 2014). The
importance of risk-based IA is supported by the literature (e.g., Allegrini & D’Onza, 2003; Spira & Page, 2003;
Burnaby & Hass, 2009). Secondly, IA quality assurance include the development and maintenance by the chief
audit executive of a quality assurance and improvement program that covers all aspects of the internal audit
activity (IIA, 2016: standard No 1300). Lin et al. (2011) showed, among other findings, that various IA activities
help IA effectiveness, including the use of quality assurance techniques. Thirdly, IA to be effective should
establish policies and procedures to guide the internal audit activity (IIA, 2016: standard No 2040).
Finally, following institutional theory, IA effectiveness is governed by institutional pressures that come from
relationship between IA and managers at different level. IA to be effective should periodically communicate to
auditee, senior management and the board of directors or its internal committee on the internal audit activity's
purpose, authority, responsibility and performance relative to its plan. Reporting must also include significant
risk exposures and control issues, including fraud risks, governance issues and other matters needed or requested
by senior management and the board (IIA, 2016: standard No 2060), the results of engagement (IIA, 2016:
standard No 2400). Relationships, when they are characterized by regular interactions, reports and an open
dialogue, are expected to aid the IA’s pursuit of effectiveness (Lenz et al., 2014).
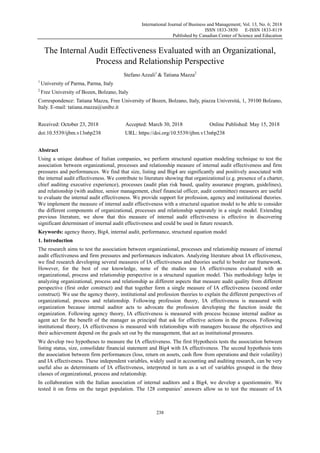
We grouped these variables into three main classes (Figure 1). We model perceived IA effectiveness as
formative (Note 2) because a change in the organization, process and relationship will lead to a change in
perceived IA effectiveness. Organization, process and relationships as well as competences and independence
are different aspects that measure audit quality from different perspective (DeAngelo, 1981). We model them as
first order reflective constructs for each single interchangeable item. (Note 3)
4. ijbm.ccsen
Figure
Table 1. V
IA effective
ORGANIZA
PROCESS
RELATION
Determinan
Listing
Consolidate
Size
Big4
Loss
ROA
CFO
SD CFO
net.org
e 1. Framewor
Variable defin
eness
ATION Charte
CAE
experi
Statuto
board
Risk b
Qualit
assura
Guide
NSHIP Audite
Senior
manag
CFO
Audit
comm
nts
=1 if o
e = 1 if t
= the
Regoli
= 1 if t
= 1 if n
= ratio
= cash
= stan
Int
rk: internal aud
nitions
er = 1 i
activ
Stand
ience
Num
<2; 2
D’Er
ory Leve
(repl
based Leve
the p
Stand
ty
ance
1= if
progr
No.
2011
lines Leve
proce
2014
ee
r
gement
mittee
1= if
and 0
enga
organization is pu
the company has
natural logarithm
iosi and D’Eri (2
the external audit
net income < 0, a
o of net income to
h flow from opera
dard deviation of
ternational Jour
dit effectivene
if there is a form
vity in an internal
dard No. 1000; L
mber of years of ex
2= 3-5; 3= 6-10;
ri, 2014).
el from 1 (low)
aced by audit firm
el from 1 (low) to
priorities of the
dard No. 2010; Ji
f the chief audit
ram that covers a
1300; Jiang et al
)
el from 1 (low)
edures/framework
4a, b)
f there is a report
0 otherwise; follo
gement (IIA, 201
ublicly traded, and
to prepare a cons
m of total assets
014), Anderson e
tor is KPMG, Ern
and 0 otherwise, K
o lagged total asse
ation / total assets
f cash flow from o
rnal of Business
241
ess evaluated
perspective
mal definition of
l audit charter app
Lenz and Sarens, 2
xperience of chie
; 4= 11-15; 5= >
to 5 (high) (Lik
m in some non-lis
o 5 (high) (Likert
internal audit a
iang et al. 2014a,
t executive must
all aspects of the
l. 2014a, b; Lenz
to 5 (high) (Li
ks to guide the in
to audited subjec
owing the sugge
12, Standard No.
d 0 otherwise; Ar
solidated financia
at the end of th
et al. (2012)
nst &Young, Delo
Koch (2014)
ets; Carcello et al
s; Carcello et al. (
operation / lagged
s and Managem
with an organ
the purpose, auth
proved by the Bo
2012; Regoliosi a
ef audit executive
>15 (Prawitt et a
kert-like scale) o
sted firms in Italy
t-like scale) for w
ctivity, consisten
b; Lenz and Sare
develop and ma
e internal audit ac
z and Sarens, 20
kert-like scale)
nternal audit activ
ct, senior manage
stion that interna
2400).
rena and Azzone
al statement; 0 oth
e fiscal year; Ca
oitte or PWC, 0 o
l. (2005b)
(2005a, b), Abbot
d total assets; Jian
ment
nizational, pro
hority and respon
oard of Directors,
and D’Eri, 2014)
s (CAE) measure
al. 2009; Jiang et
of communication
y), (IIA, 2012, Sta
which the audit pl
nt with the orga
ens, 2012; Allegri
aintain a quality
ctivity, and 0 oth
012; Regoliosi an
for which the a
vity (IIA, 2012, S
ment, chief finan
al auditors should
(2007, 2009), An
herwise
rcello et al. (200
otherwise; Jiang e
tt et al. (2010)
ng (2014b)
Vol. 13, N
ocess and relat
nsibility of the in
, and 0 otherwise
ed with a Likert-l
t al. 2014a, b; R
n with audit sta
andard No. 2060)
lan is risk-based
anization’s goals
rini and D’Onza,
assurance and i
herwise, (IIA, 20
nd D’Eri, 2014;
audit plan have
Standard No.2040
ncial officer, audi
d communicate t
nderson et al. (201
05a, b), Abbott e
et al. (2014a)
No. 6; 2018
tionship
nternal audit
e, (IIA, 2012,
ike scale: 1=
Regoliosi and
tutory board
).
to determine
(IIA, 2012,
2003)
improvement
12, Standard
Sarens et al.
policies and
0; Jiang et al.
it committee;
he results of
12)
et al. (2010),
5. ijbm.ccsenet.org International Journal of Business and Management Vol. 13, No. 6; 2018
242
3.2 Firms Incentives
We investigate the determinants of IA effectiveness answering at prior call of research. Shamki and Alhajri,
(2017) emphasize that future studies are called to extend their study by examining the influence of factors on the
IA effectiveness. After the collapse of Arthur Andersen in 2002, the auditing profession has faced increasing
pressure from external parties to enhance and improve audit quality. These pressures led to a continued need to
study the factors that affect audit quality (Hussein and Hanefah, 2013).
We expect that IA effectiveness is related to incentives to high quality from capital market (listing status, size),
minority (consolidate or individual), and audit (Big4). Literature has investigated the listing status (Arena and
Azzone, 2007, 2009; Anderson et al., 2012) and size (Carcello et al., 2005a, b; Abbott et al., 2010; Regoliosi &
D’Eri, 2014; Anderson et al., 2012) as possible determinant of IA effectiveness, with different measures of IA
effectiveness construct. We expect that our measure of IA effectiveness based on organization, process and
relationship is positive related with capital market and minority pressure that increases the monitoring to have an
effective IA function in all its three components. Market incentives come from the firms listing status as well as
by the size of a firm. Moreover, we expect that external auditor reputation - competences (Big4) to be related to
the work of IA. Big4 reputation increases the incentive to check the effectiveness of IA, and in the long run,
Big4 help and promote the development of an effective internal control system.
H1: firms’ incentives are positively associated with IA effectiveness
3.3 Firms’ Performance
We expect that IA effectiveness is related to firms’ total performance (loss), firm operating performance (ROA),
cash flow (CFO) and variability of cash flow (SDCFO) that create availability of resources to invest in internal
control. We investigate separately total from operating performance (Carcello et al., 2005b), expecting a higher
relation with operating performance given the IA relation with the operating activity. Finally, the level and
variability of cash (CFO, SDCFO) are other determinants of the development of the IA function (Carcello et al.,
2005a, b; Abbott et al., 2010) related to the resources available in cash to invest in internal controls and to their
stability to have similar investment over time. On the other hand, economic performance and cash flow can be
negative related with IA effectiveness because negative performance provides higher incentives for controls.
However, negative performance can also change the focus of the firms and reduce the investment in controls.
Thus, we expect a positive relation with firms’ performance.
H2: firms’ performance is positively associated with IA effectiveness
4. Research Method
4.1 Questionnaire and Sample
We collect private data through questionnaires. We prepared the questionnaire together with external auditors
from one of the Big4 and from the Association of Italian Internal Auditors (AIIA). The external auditors and
AIIA make a key contribution in ensuring language would be comprehensible for the target companies. We test
the questionnaire on firms from the target population. Based on their responses and comments, the questionnaire,
the study design and the measurement of some constructs are slightly adapted. We distribute the questionnaire
using a web-based survey system. The distribution procedure involves sending out a survey package containing
the questionnaire and a covering letter. In order to increase the response rate, we contact by phone companies
that are slow to respond.
We opt to make the questionnaire confidential; i.e. although the names of respondent companies are known to us,
they are not disclosed here and results are shown only in aggregate form. We are thus able to link the data
collected by questionnaires with other sources, such as financial statement data from company websites for
banks and from databases (Bureau van Dick, National Insurance Association database). In addition, we
emphasize that the research is under the auspices of a well-known university, widely recognized as trustworthy,
so that firms could be confident that sensitive information would not be disclosed. We sent the questionnaire to
616 companies members of the AIIA and we received 128 usable answers with a response rate of 21% (Table 2,
Panel A). The questionnaire refers to the year 2013.
4.2 Non-Response and Common Method Bias
To evaluate our questionnaire, we compute the test for non-response bias and tests for common method bias. In
Table 2, Panel B, we present the results for the non-response bias. We perform a comparison of firm
characteristics (ROE and equity/total assets) between listed (non-listed) financial firms in our sample and listed
(non-listed) financial firms in the sample of non-respondents. Then, we repeat this comparison between listed
6. ijbm.ccsenet.org International Journal of Business and Management Vol. 13, No. 6; 2018
243
(non-listed) non-financial firms in our sample and listed (non-listed) non-financial firms in the sample of
non-respondents. The latter includes 616 companies associated with the national institute of internal audit that
has received but not answered at the questionnaire. We find no statistically significant differences between these
groups in term of profitability and leverage, except for the comparison of leverage between non-financial
non-listed firms in our sample and in the sample of Italian population (Table 2 Panel B).
Furthermore, we repeat this comparison between listed (non-listed) financial firms in our sample and listed
(non-listed) financial firms in the Italian population and between listed (non-listed) non-financial firms in our
sample and listed (non-listed) non-financial firms in the Italian population. The latter includes all firms listed on
the Milan Stock Exchange and non-listed firms with minimum total assets of euro 2 million with data available
for total assets, operating earnings, net income and share capital from the database of Bureau Van Dick. We find
that there are no statistically significant differences between the groups. We conclude that our sample is
qualitatively similar to the population, so that results can be generalized to the population of Italian firms (Table
2 Panel B).
Table 2. Sample
Panel A - Sample Selection
Description N (year=2013)
Number of Italian companies associated with Italian Association of Internal Auditors to which we sent the questionnaire 616
-Number of companies not responding -488
Final sample 128
Panel B - Non-response bias
Sample of respondents Sample of respondents
Financial Non-financial Financial Non-financial
Variables
Listed Non-listed Listed Non-listed Listed
Non-liste
d
Listed Non-listed
N 10 64 86 328 13 43 26 46
ROE -0.02 0.01 -0.03 -0.22 0.03 0.01 0.06 -0.01
Equity/assets 0.11 0.10 0.41 0.32 0.06 0.09 0.45 0.39
Italian population Sample of respondents
Financial Non-financial Financial Non-financial
Variables
Listed Non-listed Listed Non-listed Listed
Non-liste
d
Listed Non-listed
N 33 548 97 1892 13 43 26 46
ROE 0.03 0.005 0.005 0.10 0.03 0.01 0.06 -0.01
Equity/assets 0.16 0.12 0.20 0.10 0.08 0.09 0.45 0.39**
Note. We compare the means of the variables through a t-test between the mean of listed financial firms, non-listed financial firms, listed
non-financial firms, non-listed non-financial firms of the non-respondents (or Italian population) and the mean of respectively listed financial
firms, non-listed financial firms, listed non-financial firms, non-listed non-financial firms of our sample. * and ** indicate respectively 0.05,
0.01 level of statistically significant difference between the mean. The Italian population includes all firms listed on the Milan Stock
Exchange and non-listed firms with minimum total assets of euro 2 million with data available for total assets, operating earnings, net income
and share capital from the database of Bureau Van Dick.
We perform three tests for common method bias: Harman’s single factor test; a confirmatory factor analysis
comparison of the model by loading all the questions of the survey into a single-factor; and the test of partialling
out a general factor score following the approach of Elbashir et al. (2011) and Dowling (2009). First, in
Harman’s single factor test no single factor emerges from the exploratory factor analysis and no single general
factor accounts for the majority of the variance in the items used in the model. Secondly, in the confirmatory
factor analysis the item loadings are all lower when constrained to load onto a single-factor than when the items
are loaded onto their respective theoretical construct. This suggests that the theoretical measurement model
provides a better fit to the data than a single-factor item. Thirdly, in partialling out a general factor score test, we
add the highest factor from the “unrotated” exploratory factor analysis on the main model used in our analysis.
7. ijbm.ccsenet.org International Journal of Business and Management Vol. 13, No. 6; 2018
244
We add it as a control variable. We assume that this factor contains the best approximation of the common
method variance (Podsakoff & Organ 1986; Podsakoff et al., 2003). The findings show the original results are
not affected by the general factor included in the model. Concluding, the results indicate no significant common
method variance that threatens the quality of the data. Importantly, prior to data collection, we attempted to
minimize the potential for common method bias by collecting the data with different scales, protecting
respondents’ confidentiality, asking respondents to answer honestly and conducting pilot tests to reduce item
ambiguity (following Podsakoff et al., 2003).
4.3 Model
We use Partial Least Squares (PLS), a component based structural equation modeling (SEM) technique (Note 4),
to test our hypothesis. We first discuss the choice of PLS for this analysis and its advantages. Secondly, we
define our model, explaining the reflective and formative construct and the measurement scale used in the
questionnaire. (Note 5)
PLS has several advantages. First, given that audit quality is based on competence and that independence has
two key elements of quality, it is important to use a method, which allows including both reflective and
formative constructs, following the approach of Dowling (2009) and Elbashir et al. (2011) (Note 6). Secondly,
because our data are from questionnaires, PLS is useful because being nonparametric and using iterative
estimation algorithms that proceed block-by-block, it requires less stringent assumptions about the distributional
characteristics of the raw data (Chin, 1998; Hulland, 1999). Thirdly, PLS makes it possible to perform
path-analytic modelling between latent constructs like our constructs of IA effectiveness and coordination. (Note
7) Moreover, PLS is also suitable for analyzing complex models with second-order constructs, such as our
concept of IA effectiveness (Chin and Newsted, 1999). PLS is used extensively in social sciences. A number of
recent studies in accounting (e.g., Naranjo and Hartmann, 2007; Hall 2008; Hall and Smith, 2009; Chapman and
Kihn 2009; Elbashir et al. 2011; Glaum et al. 2013; Du et al. 2013) and auditing (Dowling 2009; Diaz and
Loraas, 2010; Eulerich et al. 2015) use PLS for similar reasons. However, there is high potential for adopting
PLS more widely in the field of accounting (Lee et al. 2011). Hall et al. (2005) and Blanthorne et al. (2006) have
recognized the potential benefits of using it on traditional accounting data sets.
We supply details (Table 1) on the development of the scales used in the survey (Lee et al. 2011), grouping
variables into three main classes: organization, process and relationship. Starting from the full list of questions,
we select 10 questions for the analysis of IA effectiveness. (Note 8) We measure organization variables, using a
five-point Likert-like scale ranging from <2 (1) to >15 (5) for CAE number of years of experience, and a
five-point Likert-like scale ranging from low frequency (1) to high frequency (5) for communication with the
Statutory board. We than use a dummy variable for the presence of a formal charter. The use of different scales
such as Likert-like and yes-no questions helps to lower common method bias. Next, we measure the construct
process with three variables. We use a five-point Likert-like scale ranging from low importance (1) to high
importance (5) to measure the risk-based approach and the policies and procedures (guidelines). We use a
dummy variable for the presence of an internal program of quality assurance. We also measure relationships with
four dummy variables that represent the presence of a report to auditee, senior management, CFO and audit
committee.
5. Results
In this section, we present descriptive statistics, correlation matrix, validity reliability and the structural model
results.
5.1 Descriptive Statistics
Table 3 shows the descriptive statistics for IA effectiveness measures, grouped into 3 main elements: IA
organization, IA process, IA relationship. Among IA organization variables, 84% of companies of our sample
have a charter that discloses objectives, competencies and responsibilities of the IA function. The mean number
of years of CAE experience almost reaches class 4 (from 11 to 15 years). Communication to the statutory board
has a mean value of 3.9 out of 5, showing it is considered fairly important. These results show that our sample of
companies have an IA function with a good organization, independence and competencies. Processes performed
by IA function are evaluated with variables related to quality assurance, guidelines and the audit plan, using a
risk assessment approach. Quality assurance is not very much developed, and is more frequently performed
internally (38%) than externally (16%, untabulated). On the other hand, most companies have policies and
procedures to guide IA activities (score of 3.7 out of 5) and the audit plan is risk based with a score of 3.7 out of
5. Finally, IA relationships are evaluated with variables related to the reporting toward auditees, senior
management, CFO and Audit Committee. Reporting is more frequent towards the auditee (91%), senior
8. ijbm.ccsenet.org International Journal of Business and Management Vol. 13, No. 6; 2018
245
management (81%) and audit committee (74%) than towards CFO (64%). Table 4 also shows descriptive
statistics of the determinants.
Table 3. Descriptive statistics: IA effectiveness
Variables Range Mean Std.Dev.
IA organization
Charter 0-100% 84% 36%
CAE experience 1-5 3.8 1.3
Statutory board 1-5 3.9 1.2
IA process
Quality assurance 0-100% 38% 49%
Guidelines 1-5 3.7 1.2
Risk based 1-5 3.7 1.2
IA relationship
Auditee 0-100% 91% 29%
Senior management 0-100% 81% 39%
CFO 0-100% 64% 48%
Audit committee 0-100% 74% 44%
Table 4. Descriptive statistics: determinants
Variables Mean Std.Dev. Min Max
Firms’ pressure
Listing 0.30 0.46 0.00 1.00
Consolidate 0.65 0.48 0.00 1.00
Size 21.14 2.42 13.22 27.23
Big4 0.69 0.47 0.00 1.00
Firms’ performances
Loss 0.27 0.45 0.00 1.00
ROA 0.001 0.07 -0.28 0.20
CFO 0.04 0.07 -0.19 0.28
SD CFO 0.03 0.04 0.00 0.26
All the continuous variables have been winsorized at 1%.
5.2 Validity and Reliability of PLS Model
Because reflective and formative constructs are tested with different methods, we present validity and reliability
tests for them separately. (See for example Hulland, 1999; Naranjo & Hartmann, 2007; Chapman & Khin, 2009;
Elbashir et al., 2011; Dowling, 2009; Hartmann & Slapnicar, 2009; Diaz & Loraas, 2010; Eulerich et al., 2015).
(Note 9)
For reflective constructs, validity is addressed at content, convergent and discriminant construct level. Reliability
is addressed with internal consistency reliability index.
A previous study shows that in a sample of three companies and two Big4 firms, (Chapman & Kihn, 2009) the
content validity of perceived IA effectiveness is enhanced by IIA standards definitions and by pilot testing. In our
study, the key determinants of perceived IA effectiveness are deduced based on such prior studies.
Item loading, together with the Average Variance Extracted (AVE), captures the convergent validity of each of
the measures for constructs that are modeled reflectively. Firstly, we use confirmatory factor analyses to examine
the loading of items. (Note 10) Results show that all reflective items have high and significant loadings (Table 5,
Panel A, Confirmatory factor analysis loadings). (Note 11) Secondly, the output from PLS in relation to the
measurement model verifies the initial results from the confirmatory factor analysis tests for reflective construct
(Table 5, Panel A, Partial least squares loadings). The loadings of the reflective items are qualitatively similar
(Hulland, 1999; Hair et al., 1998; Chenhall, 2005; Yi & Davis, 2003; Vandenbosch, 1999). Thirdly, results show
that the AVE for all reflective constructs exceed 0.45 (square root of AVE presented in Table 5, Panel C in the
diagonal), supporting the convergent validity of the items (Fornell & Larcker, 1981; Chin, 1998). This ensures
9. ijbm.ccsenet.org International Journal of Business and Management Vol. 13, No. 6; 2018
246
that measurement error does not dominate the variance captured by the construct (Vandenbosch, 1996).
The cross loadings and the comparison of AVE and correlation coefficient capture the discriminant validity.
Looking at cross-loadings (Table 5, Panel B), all items load significantly and higher on their respective latent
construct than on another latent construct (Chin, 1998). (Note 12) The comparison of correlation and AVE
determines the extent to which a construct shares more variance with its measures than it shares with other
constructs, following the Fornell-Larcker (1981) criterion. The values of the square roots of the AVE (Table 5,
Panel C) are all greater than the inter-construct correlations indicating that more variance is shared within a
construct than between constructs and thus, that all measures have appropriate discriminant validity (Chin, 1998;
Yi and Davis, 2003).
Internal consistency reliability (ICR in Table 5, Panel C), also called composite reliability, incorporates the
loading weights of the items and provides a more appropriate indication of internal consistency than Cronbach
(1951)'s alpha when the item loadings are not tau-equivalent (Bacon et al., 1995; Salisbury et al., 2002). The ICR
scores of the latent constructs are all greater than 0.70, indicating acceptable reliability for the measurement of
the reflective items for each construct (Nunnaly & Bernstein, 1994; Vandenbosch, 1996). (Note 13)
When assessing formative construct validity, the indicator weights (Table 5, Panel D) rather than loadings should
be assessed (Chin, 1998; Diamantopoulos and Winklhofer, 2001; Petter et al., 2007). Classical measurement
theory testing assumptions are not applicable for assessing formative indicators because there is no expected
pattern of inter-relationship (Bollen and Lennox, 1991; Diamantopoulos et al., 2008). Table 5 Panel D shows that
all weights are significant. For the reliability of formative construct instead of the correlation, the Variance
Inflation Factor (VIF) should be computed. The VIF is below 3 for all indicators (Table 5 Panel D), indicating
that multicollinearity is not a major concern (Petter et al., 2007).
Table 5. Validity and reliability
Panel A – Loadings of items for reflective constructs
Constructs Items Confirmatory factor analysis loadings Partial Least Squares loadings
ORGANIZATION
Charter 0.507*** 0.714***
CAE experience 0.305*** 0.580***
Statutory board 0.417*** 0.702***
PROCESS
Quality assurance 0.450*** 0.678***
Guidelines 0.612*** 0.774***
Risk based 0.797*** 0.825***
RELATIONSHIP
Auditee 0.599*** 0.748***
Senior management 0.757*** 0.790***
CFO 0.449*** 0.555***
Audit committee 0.516*** 0.713***
Panel B – Cross loadings organization process relationship
Charter 0.714 0.341 0.160
CAE experience 0.580 0.068 0.218
Statutory board 0.702 0.091 0.144
Quality assurance 0.201 0.678 0.268
Guidelines 0.132 0.774 0.268
Risk based 0.294 0.825 0.193
Auditee 0.228 0.279 0.748
Senior management 0.253 0.218 0.790
CFO -0.109 0.073 0.555
Audit committee 0.233 0.274 0.713
10. ijbm.ccsenet.org International Journal of Business and Management Vol. 13, No. 6; 2018
247
Panel C – ICR, square root of average variance extracted and construct correlations
ICR 1 2 3
1 Organization 0.706 0.667
2 Process 0.804 0.282 0.761
3 Relationship 0.797 0.256 0.318 0.707
Panel D – Weights of indicators for the second order formative construct
Constructs Indicators Weights VIF
IA EFFECTIVENESS
Organization 0.271*** 1.175
Process 0.477*** 1.264
Relationship 0.600*** 1.176
Panels A and D: *0.10, **0.05, ***0.00. Significance level of the PLS loadings and weights come from a bootstrapping of 1000 samples.
Panel C: Internal Consistency Reliability (ICR), and diagonally, the square root of the Average Variance Extracted (AVE) by latent constructs
from their indicators (Calculated following Chin (1998a, b)) following the Fornell Larcker Criterion to evaluate discriminant validity
(SmartPLS software).
5.3. Structural Model Results
The adequacy of the structural model is assessed with standardized beta-statistics, used as path coefficients and
generated by the PLS, from ordinary least squares regression (OLS). Bootstrapping using 1000 samples with
replacement is used to assess the significance of the path coefficients. The framework that posits a direct relation
between constructs of Organization, Process and Relationship is confirmed by the sign and significance of path
coefficients (0.270, 0.480, 0.598 respectively, significant at 0.001), which indicate the direction of the
relationships among the latent variables. Also, all the survey questions related to the three constructs
Organization, Process and Relationship are positively and significantly related to the respective constructs,
confirm their relevance to measure IA effectiveness.
Finally, Table 6 shows results of our hypothesis. Results about the determinants show that the market pressure
from the listing status and the size as well as the pressure from Big4 are positively related to IA effectiveness.
This confirms our first hypothesis that the market investors, the reputation of the company and of the auditor are
determinants of higher incentive to develop the IA work. This determinant has been found in a model that
consider the different aspects of organization, process and relationships separately in a single model. This
structural equation model better captures the nature of internal audit effectiveness and is able to show that
pressure from the market and the reputation of auditors are important elements for all the three categories of
internal audit effectiveness.
Table 6. PLS results: determinants of perceived IA effectiveness
Dependent variable is IA effectiveness (Bootstrapping) Estimate p-value
Latent variables
Organization 0.270 <0.001
Process 0.480 <0.001
Relationship 0.598 <0.001
IA effectiveness variables
Charter 0.714 <0.001
CAE experience 0.580 <0.001
Statutory board 0.702 <0.001
Quality assurance 0.678 <0.001
Guidelines 0.774 <0.001
Risk based 0.825 <0.001
Auditee 0.748 <0.001
Senior management 0.790 <0.001
CFO 0.555 <0.001
Audit committee 0.713 <0.001
Determinants
Listing 0.548 <0.001
Consolidate -0.197 0.186
Size 0.606 <0.001
Big4 0.389 0.001
Loss -0.014 0.917
ROA -0.054 0.770
CFO 0.016 0.926
SD CFO -0.181 0.191
11. ijbm.ccsenet.org International Journal of Business and Management Vol. 13, No. 6; 2018
248
6. Robustness Checks
It is possible that results reflect the construction of the model, so we repeat the analysis without the second order
latent variables. Results are qualitatively the same (Table 7). Therefore, results are robust to a model where the
perceptions of IA effectiveness are not assumed to map to organization, process, and relationship. However, we
suggest future research to implement the structural equation model with second order latent variable to better
capture the role of organization, process and relationships in the measurement of internal audit effectiveness.
Table 7. PLS robustness results: without Organization, Process and Relationship constructs
Dependent variable is IA effectiveness (Bootstrapping) Estimate p-value
IA effectiveness variables
Charter 0.297 0.015
CAE experience 0.404 <0.001
Statutory board 0.392 0.001
Quality assurance 0.398 <0.001
Guidelines 0.584 <0.001
Risk based 0.596 <0.001
Auditee 0.537 <0.001
Senior management 0.555 <0.001
CFO 0.330 0.014
Audit committee 0.756 <0.001
Determinants
Listing 0.682 <0.001
Consolidate -0.114 0.450
Size 0.493 0.002
Big4 0.278 0.041
Loss -0.017 0.887
ROA -0.010 0.949
CFO -0.018 0.919
SD CFO -0.187 0.355
See Table 1 for variable definitions.
7. Conclusion
Including the Lenz et al. (2014) model of IA effectiveness evaluation in the agency, professional and
institutional theories, this research tests the association between organization, process and relationships measures
of IA effectiveness and firms’ incentives and performance. Using data collected from 128 Italian companies and
performing partial least square technique, we find that large companies, listed companies and companies audited
by Big4 represent significant incentives toward IA effectiveness. Through these results, we contribute to
literature in several ways. Firstly, we extend Lenz et al (2014) model performing an empirical analysis with the
structural equation model on a large set of empirical data. Secondly, our ten variables expression of agency,
professional and institutional theories are useful in the measurement of IA effectiveness, individually, grouped in
three main classes (organization, process and relationships) and considered as a single index. Thirdly, the
research suggests useful incentives (listing status, size and Big4) for the improvement of IA effectiveness.
Finally, our results could be also useful for practitioners both in IA and external audit.
Limitation of this research can be related to the exclusively analysis of Italian context: our results are
country-specific and could not be extended or comparable with those of other European, American, Asian,
African and Oceania countries. Moreover, another limitation could be the choice of the variables of the model
based on a specific stream of literature: other literature can suggest different variables. Future research can
investigate other determinants, like corporate governance, ownership or other variables.
8. Acknowledgements
We express our thanks to the participants at the 39th European Accounting Association Congress in Maastricht,
May 11-13, 2016 and the participants at the 14th European Academic Conference on Internal Audit and
Corporate Governance in Rotterdam, April 06-08, 2016. We thank also the reviewers of the 2016 Auditing
Section Midyear Meeting of the American Accounting Association.
12. ijbm.ccsenet.org International Journal of Business and Management Vol. 13, No. 6; 2018
249
References
Abbott, A. (1988). The systems of professions: An essay on the division of expert Labor. Chicago: Chicago
University Press.
Abbott, L. J., Parker, S., & Peters, G. F. (2010). Serving two masters: The association between audit committee
internal audit oversight and internal audit activities. Accounting Horizons, 24(1), 1-24.
http://doi.org/10.2308/acch.2010.24.1.1
Abdolmohammadi, M. J. (2009). Factors Associated with the Use of and Compliance with the IIA Standards: A
Study of Anglo-culture CAEs. International Journal of Auditing, 13(1), 27-42.
http://doi.org/10.1111/j.1099-1123.2008.00393.x
Allegrini, M., & D’Onza, G. (2003). Internal Auditing and Risk Assessment in Large Italian Companies: an
Empirical Survey. International Journal of Auditing, 7(3), 191-208.
http://doi.org/10.1046/j.1099-1123.2003.00070.x
Allegrini, M., D’Onza, G., Melville, R., Paape, L., & Sarens, G. (2006). The European literature review on
Internal Auditing. Managerial Auditing Journal, 21(8), 845-853.
Al-Twaijry, A. A. M., Brierley, J. A., & Gwilliam, D. R. (2003). The development of internal audit in Saudi
Arabia: An institutional theory perspective. Critical Perspectives on Accounting, 14(5), 507-531.
http://doi.org/10.1016/S1045-2354(02)00158-2
Alzeban, A. (2015). Influence of audit committees on internal audit conformance with internal audit standards.
Managerial Auditing Journal, 307(6), 539-559. http://doi.org/10.1108/MAJ-12-2014-1132
Anderson, U. L., Christ, M. H., Johnstone, K. M., & Rittenberg, L. E. (2012). A post-SOX examination of
factors associated with the size of internal audit functions. Accounting Horizons, 26(2), 167-191.
http://doi.org/10.2308/acch-50115
Archambeault, D. S., DeZoort, F. T., & Holt, T. P. (2008). The need for an internal auditor report to external
stakeholders to improve governance transparency. Accounting Horizons, 22(4), 375-388.
http://doi.org/10.2308/acch.2008.22.4.375
Arena, M., & Azzone, G. (2007). Internal Audit Departments: Adoption and Characteristics in Italian Companies.
International Journal of Auditing, 11, 91-114. http://doi.org/10.1111/j.1099-1123.2007.00357.x
Arena, M., & Azzone, G. (2009). Internal audit effectiveness: relevant drivers of auditees satisfaction.
International Journal of Auditing, (2000), 1-35. Retrieved from
https://www.cass.city.ac.uk/__data/assets/pdf_file/0003/37335/Marika-Arena.pdf
Bacon, D. R., Sauer, P. L., & Young, M. (1995). Composite Reliability in Structural Equations Modeling.
Educational and Psychological Measurement, 55(3), 394-406.
http://doi.org/10.1177/0013164495055003003
Blanthorne, C., Jones-Farmer, A., & Almer, E. D. (2006). Why you should consider SEM: A guide to getting
started. Advances in Accounting Behavioral Research, 9, 179-207.
Bollen, K., & Lennox, R. (1991). Conventional Wisdom on Measurement: A Structural Equation Perspective.
Psychological Bullettin, 110(2), 305-314.
Burnaby, P. a., Abdolmohammadi, M., Hass, S., Sarens, G., & Allegrini, M. (2009). Usage of Internal Auditing
Standards by companies in the United States and select European countries. Managerial Auditing Journal,
24(9), 835-860. http://doi.org/10.1108/02686900910994791
Carcello, J. V, Hermanson, D. R., & Raghunandan, K. (2005b). Changes in Internal Auditing During the Time of
the Major US Accounting Scandals. International Journal of Auditing, 9(2), 117-127.
http://doi.org/10.1111/j.1099-1123.2005.00273.x
Carcello, J. V., Hermanson, D. R., & Raghunandan, K. (2005a). Factors associated with U.S. public companies’
investment in internal auditing. Accounting Horizons, 19(2), 69-84.
http://doi.org/10.2308/acch.2005.19.2.69
Chapman, C. S., & Kihn, L. A. (2009). Information system integration, enabling control and performance.
Accounting, Organizations and Society, 34(2), 151-169. http://doi.org/10.1016/j.aos.2008.07.003
Chenhall, R. H. (2005). Integrative strategic performance measurement systems, strategic alignment of
manufacturing, learning and strategic outcomes: An exploratory study. Accounting, Organizations and
13. ijbm.ccsenet.org International Journal of Business and Management Vol. 13, No. 6; 2018
250
Society, 30(5), 395-422. http://doi.org/10.1016/j.aos.2004.08.001
Chin, W. W. (1998). The Partial Least Squares Approach to Structural Equation Modeling. Modern Methods for
Business Research, 295-336.
Chin, W. W., & Newsted, P. R. (1999). Structural Equation Modeling Analysis with Small Samples Using Partial
Least Square. Statistical Strategies for Small Sample Research, January, 307-341.
Cohen, A., & Sayag, G. (2010). The effectiveness of internal auditing: An empirical examination of its
determinants in Israeli organisations. Australian Accounting Review, 20(3), 241-255.
http://doi.org/10.1111/j.1835-2561.2010.00097.x
Cooper, B. J., Leung, P., & Wong, G. (2006). The Asia Pacific literature review on internal auditing. Managerial
Auditing Journal, 21(8), 822-834.
Cronbach, L. J. (1951). Coefficient alpha and the internal structure of tests. Psychometrika, 16(3), 297-334.
http://doi.org/10.1007/BF02310555
DeAngelo, L. E. (1981). Auditor size and audit quality. Journal of Accounting and Economics, 3(3), 183-199.
http://doi.org/10.1016/0165-4101(81)90002-1
Diamantopoulos, A., & Winklhofer, H. M. (2001). Index construction with formative indicators: An alternative
to scale development. Journal of Marketing Research, 38(2), 269-277.
Diamantopoulos, A., Riefler, P., & Roth, K. P. (2008). Advancing formative measurement models. Journal of
Business Research, 61(12), 1203-1218. http://doi.org/10.1016/j.jbusres.2008.01.009
Diaz, M. C., & Loraas, T. (2010). Learning new uses of technology while on an audit engagement:
Contextualizing general models to advance pragmatic understanding. International Journal of Accounting
Information Systems, 11(1), 61–77. http://doi.org/10.1016/j.accinf.2009.05.001
DiMaggio, P. J., & Powell, W. W. (1983). The Iron Cage Revisited: Institutional Isomorphism and Collective
Rationality in Organizational Fields. American Sociological Review, 48(2), 113-123.
Dowling, C. (2009). Appropriate audit support system use: The influence of auditor, audit team and firm factors.
Accounting Review, 84(3), 771–810. http://doi.org/10.2308/accr.2009.84.3.771
Du, Y., Deloof, M., Jorissen, A., Du, Y., & Salvador, C. (2013). HeadquartersSubsidiary Interdependencies and
the Design of Performance Evaluation and Reward Systems in Multinational Enterprises. European
Accounting Review, 22(2), 391-424. http://doi.org/10.1080/09638180.2012.739824
Elbashir, M. Z., Collier, P. A., & Sutton, S. G. (2011a). The role of organizational absorptive capacity in strategic
use of business intelligence to support integrated management control systems. Accounting Review, 86(1),
155-184. http://doi.org/10.2308/accr.00000010
Elbashir, M. Z., Collier, P. A., & Sutton, S. G. (2011b). The Role of Organizational Absorptive Capacity in
Strategic Use of Business Intelligence to Support Integrated Management Control Systems. The Accounting
Review, 86(1), 155-184.
Eulerich, M., Velte, P., & Theis, J. (2015). Internal auditor’s contribution to good corporate governance an
empirical analysis for the one-tier governance system with a focus on the relationship between internal audit
function and audit committee. Corporate Ownership and Control, 13, 141-151.
Fornell, C., & Larcker, D. (1981). Evaluating structural equation models with unobservable variables and
measurement error. Journal of Marketing Research, 18(1), 39-50.
Glaum, M., Baetge, J., Grothe, A., & Oberdörster, T. (2013). Introduction of International Accounting Standards,
Disclosure Quality and Accuracy of Analysts’ Earnings Forecasts. European Accounting Review, 22(1),
79-116. http://doi.org/10.1080/09638180.2011.558301
Goodwin, J., & Yeo, T. Y. (2001). Audit Independence and Objectivity : Evidence from Singapore. International
Journal of Auditing, 125(May), 107-125. http://doi.org/10.1111/j.1099-1123.2001.00329.x
Gramling, A. A., Maletta, M. J., Schneider, A., & Church, B. K. (2004). The role of the internal audit function in
corporate governance: a synthesys of the extant internal auditing literature and directions for future research.
Journal of Accounting Literature, 23, 194-244.
Hair, J. F., Anderson, R. E., Tathman, R. L., & Balck, W. C. (1998). Multivariate data analysis. (Fifth Edition).
Upper Saddle River, NJ: Prentice-Hall International.
14. ijbm.ccsenet.org International Journal of Business and Management Vol. 13, No. 6; 2018
251
Hall, M. (2008). The effect of comprehensive performance measurement systems on role clarity, psychological
empowerment and managerial performance. Accounting, Organizations and Society, 33(2-3), 141-163.
http://doi.org/10.1016/j.aos.2007.02.004
Hall, M., & Smith, D. (2009). Mentoring and turnover intentions in public accounting firms: A research note.
Accounting, Organizations and Society, 34(6-7), 695-704. http://doi.org/10.1016/j.aos.2008.11.003
Hall, M., Smith, D., & Langfield-smith, K. (2005). Accountants’ Commitment to Their Profession: Multiple
Dimensions of Professional Commitment and Opportunities for Future Research. Behavioral Research in
Accounting, 17, 89-109.
Hartmann, F., & Slapnicar, S. (2009). How formal performance evaluation affects trust between superior and
subordinate managers. Accounting, Organizations and Society, 34(6-7), 722-737.
http://doi.org/10.1016/j.aos.2008.11.004
Hass, S., Abdolmohammadi, M. J., & Burnaby, P. (2006). The Americas literature review on internal auditing.
Managerial Auditing Journal, 21(8), 835-844.
Hulland, J. (1999). Use of Partial Least Squares (PLS) in Strategic Management Research: A Review of Four
Recent Studies. Strategic Management Journal, 20(2), 195-204.
Hussein, F. E., & Hanefah, M. M. (2013). Overview of Surrogates to Measure Audit Quality. International
Journal of Business and Management, 8(17), 84-91. http://doi.org/10.5539/ijbm.v8n17p84
IIA -The Institute of Internal Auditors. (2010). Measuring internal audit effectiveness and efficiency.
IPPF-Practice Guide.
IIA -The Institute of Internal Auditors. (2016). International Standards for the Professional Practice of Internal
Auditing.
Jensen, M. C., & Meckling, W. H. (1976). Theory of the Firm: Managerial Behavior, Agency Costs and
Ownership Structure. Journal of Financial Economics, 3(4), 305-360.
http://doi.org/http://dx.doi.org/10.1016/0304-405X(76)90026-X
Jiang, L. (2014). Internal Audit Function Quality and Firm Performance Recovery : Evidence from Recent
Post-Crisis Period.
Jiang, L., André, P., & Richard, C. (2014). Determinants of Internal Audit Function Quality: An International
Study. Working Paper, 1-65.
Lee, L., Petter, S., Fayard, D., & Robinson, S. (2011). On the use of partial least squares path modeling in
accounting research. International Journal of Accounting Information Systems, 12(4), 305-328.
http://doi.org/10.1016/j.accinf.2011.05.002
Lenz, R., & Hahn, U. (2015). A synthesis of empirical internal audit effectiveness literature pointing to new
research opportunities. Managerial Auditing Journal, 30(1), 5-33.
Lenz, R., Sarens, G., & D’Silva, K. (2014). Probing the discriminatory power of characteristics of internal audit
functions: Sorting the wheat from the chaff. International Journal of Auditing, 18(2), 126-138.
http://doi.org/10.1111/ijau.12017
Lin, S., Pizzini, M., Vargus, M., & Bardhan, I. R. (2011). The role of the internal audit function in the disclosure
of material weaknesses. Accounting Review, 86(1), 287-323. http://doi.org/10.2308/accr.00000016
Mihret, D. G., & Yismaw, A. W. (2007). Internal audit effectiveness: An Ethiopian public sector case study.
Managerial Auditing Journal, 22(5), 470-84.
Naranjo-Gil, D., & Hartmann, F. (2007). Management accounting systems, top management team heterogeneity
and strategic change. Accounting, Organizations and Society, 32(7-8), 735-756.
http://doi.org/10.1016/j.aos.2006.08.003
Nunnaly, J. C., & Bernstein, I. H. (1994). Psychometric Theory. 3rd Edition. New York, NY: McGraw Hill.
Petter, S., Straub, D., & Rai, A. (2007). Specifying formative constructs in information system research. MIS
Quarterly, 31(4), 623-656.
Podsakoff, N. P., & Organ, D. W. (1986). Self-Reports in Organizational Research: Problems and Prospects.
Journal of Management, 12(4), 531-544. http://doi.org/10.1177/014920638601200408
Podsakoff, P. M., MacKenzie, S. B., Lee, J.-Y., & Podsakoff, N. P. (2003). Common method biases in behavioral
15. ijbm.ccsenet.org International Journal of Business and Management Vol. 13, No. 6; 2018
252
research: A critical review of the literature and recommended remedies. The Journal of Applied Psychology,
88(5), 879-903. http://doi.org/10.1037/0021-9010.88.5.879
Pungas, K. (2003). Risk assessment as part of internal auditing in the government institutions of the Estonian
Republic. EBS Review Summer, 42-46.
Raghunandan, K., Read, W. J., & Rama, D. V. (2001). Audit Committee Composition, Gray Directors and
Interaction with Internal Auditing. Accounting Horizons, 15(2), 105-118. Retrieved from
http://libaccess.mcmaster.ca.libaccess.lib.mcmaster.ca/login?url=http://search.ebscohost.com/login.aspx?dir
ect=true&db=bth&AN=4670387&site=ehost-live&scope=site
Regoliosi, C., & d’Eri, A. (2014). “Good” corporate governance and the quality of internal auditing departments
in Italian listed firms. An exploratory investigation in Italian listed firms. Journal of Management and
Governance, 18(3), 891-920. http://doi.org/10.1007/s10997-012-9254-1
Salisbury, D. W., Chin, W. W., Gopal, A., & Newsted, P. R. (2002). Research Report: Better Theory Through
Measurement — Developing a Scale to Capture Consensus on Appropriation. Information System Research,
13(1), 91-103.
Sarens, G. (2009). Internal Auditing Research: Where are we going? Editorial. International Journal of Auditing,
13, 1-7.
Sarens, G., & De Beelde, I. (2006). The relationship between internal audit and senior management: A
qualitative analysis of expectations and perceptions. International Journal of Auditing, 10(3), 219-241.
http://doi.org/10.1111/j.1099-1123.2006.00351.x
Sarens, G., Allegrini, M., D’Onza, G., & Melville, R. (2011). Are internal auditing practices related to the age of
the internal audit function?: Exploratory evidence and directions for future research. Managerial Auditing
Journal, 26(1), 51-64. http://doi.org/10.1108/02686901111090835
Scarbrough, D. P., Rama, D. V., & Raghunandan, K. (1998). Audit committee composition and interaction with
internal auditing: Canadian evidence. Accounting Horizons, 12(1), 51-62.
Selim, G. M., Sudarsanam, S., & Lavine, M. (2003). The Role of Internal Auditors in Mergers, Acquisitions and
Divestitures: An International Study. International Journal Od Auditing, 7, 223-245.
Selim, G., Woodward, S., & Allegrini, M. (2009). Internal Auditing and Consulting Practice: A Comparison
between UK/Ireland and Italy. International Journal of Auditing, 13(1), 9-25.
http://doi.org/10.1111/j.1099-1123.2008.00395.x
Shamki, D., & Alhajri, T. A. (2017). Factors Influence Internal Audit Effectiveness. International Journal of
Business and Management, 12(10), 143-154. http://doi.org/10.5539/ijbm.v12n10p143
Spira, L. F., & Page, M. (2003). Risk management: The reivention of internal control and the changing role of
internal audit. Accounting, Auditing & Accountability Journal, 16(4), 640-661.
http://doi.org/http://dx.doi.org/10.1108/09564230910978511
Tackie, G., Marfo-Yiadom, E., & Oduro Achina, S. (2016). Determinants of Internal Audit Effectiveness in
Decentralized Local Government Administrative Systems. International Journal of Business and
Management, 11(11), 184. http://doi.org/10.5539/ijbm.v11n11p184
Vandenbosch, B. (1999). An empirical analysis of the association between the use of executive support systems
and perceived organizational competitiveness. Accounting, Organizations and Society, 24, 77-92.
Vandenbosch, M. B. (1996). Confirmatory compositional approaches to the development of product spaces.
European Journal of Marketing, 30(3), 23-46.
Winters, R. (2009). Achieving our potential. Internal Auditor, 65(3), 48-53.
Wright, A., & Wright, S. (1997). The effect of industry experience on hypothesis generation and audit planning
decisions. Electronic Retrieved from http://papers.ssrn.com/paper.taf?abstract_id=42913.
Yi, M. Y., & Davis, F. D. (2003). Developing and validating an observational learning model of computer
software training and skill acquisition. Information System Research, 14(2), 146-169.
Ziegenfuss, D. E. (2000). Measuring Performance. Internal Auditor, February, 36-40.
16. ijbm.ccsenet.org International Journal of Business and Management Vol. 13, No. 6; 2018
253
Notes
Note 1. Given that the variables for resources do not significantly load on our model, we do not consider them.
Note 2. Reflective items are manifestations of changes in the underlying latent construct. As such, the direction
of causality is from construct to items. Reflective items should be interchangeable, have the same antecedents
and consequents and be highly correlated. In contrast, because changes in formative indicators cause changes in
the construct, these indicators are generally not interchangeable, and are not required to have the same
antecedents and consequents or be highly correlated (Jarvis et al., 2003; Petter et al., 2007). We use the term
"item" ("indicator") when we measure a construct reflectively (formatively). For reflective constructs, a simple
regression is performed with each item individually regressed on its latent variables; estimating inside the latent
construct score to determine the outer loading. Loadings represent the correlation between the indicator and the
latent construct. An indicator with a low loading implies that the indicator has little shared variance with the
latent construct. For formative constructs, the weights are the beta coefficients between the latent construct and
indicators in a multiple regression analysis. Weights correspond to the beta coefficient weights calculated as part
of a multiple regression analysis and represent the relative importance of each indicator in the formation of the
latent construct component score (Lee et al., 2011).
Note 3. The indicators are unlikely to be correlated because a change in one indicator should not automatically
result in a change in all other indicators. On the other hand, each item is measured by different questions that
measure the same aspect.
Note 4. Unlike variance–covariance-based SEM, which attempts to minimize the difference between sample
covariance and those predicted by a theoretical model on the underlying assumptions of normal multivariate
distribution (Chin, 1998), PLS estimates the structural model using an iterative OLS regression-like procedure,
which aims to explain variance of the dependent variables by minimizing the residual variance of all dependent
variables (both, latent and observed).
Note 5. Lee et al. (2011) suggest that future research using this approach should explain the justification of
constructs as reflective or formative, and give details on the development of the scales, the software used, the
power and the effect size. We aim to do this in this paper. The f square effect size is 0.231 (See Durlak, 2009).
Note 6. Using a covariance based SEM technique to model constructs as formative can result in unidentified
models (Kline 2006) or in admissible solutions (Fornell and Bookstein 1982). PLS however is suitable for
modeling constructs measured either reflectively, or formatively or in a combination of the two ways (Chin
1998).
Note 7. The PLS approach comprises a measurement model that specifies relations between manifest items
(observed values for specific survey questions) and the latent constructs that they represent (i.e., unobserved
values), plus a structural model that identifies relations among constructs. SEM is a merger of two powerful
approaches (Lee et al. 2011), factor analysis and path analysis, and allows researchers to simultaneously assess
the measurement model (traditionally accomplished with factor analysis) and the structural model (traditionally
accomplished with path analysis).
Note 8. The items included in the model are those left after dropping items with low and insignificant loadings
from the construct measure.
Note 9. Before the analysis, we check the factorability of items. The Bartlett test of sphericity shows that
nonzero correlations exist at the significance level of 0.000 for all the variables (untabulated). The
Kaiser–Meyer–Olkin measure of sampling adequacy (untabulated) is met in all cases with an MSA of >0.50
(Chapman and Kihn, 2009).
Note 10. We use confirmatory factor analyses instead of an explorative factor analysis because the framework to
measure IA effectiveness is established in advance.
Note 11. The weighting scheme is “Path”. Because there may be weaknesses in software, we repeat the analysis
with two different types of software, and the results hold.
Note 12. The same results are found running a principal component analysis rotated.
Note 13. We repeat the analysis without the variable CAE experience and obtain all ICR higher than 0.75. This
measure of perceived IA effectiveness yields qualitatively similar results to those in the main analysis of the
hypothesis. Because the literature emphasizes the importance of CAE experience in measuring IA effectiveness,
we opt to retain CAE experience in the analysis.
17. ijbm.ccsenet.org International Journal of Business and Management Vol. 13, No. 6; 2018
254
Copyrights
Copyright for this article is retained by the author(s), with first publication rights granted to the journal.
This is an open-access article distributed under the terms and conditions of the Creative Commons Attribution
license (http://creativecommons.org/licenses/by/4.0/).